Abstract
Objective:
To evaluate and compare the imaging feature of sinonasal oncocytic papilloma (OP) with inverted papilloma (IP).
Methods:
The CT and MR imaging manifestations of 17 pathology proven sinonasal OPs were reviewed and compared with 17 IPs randomly selected as a control group over the same period.
Results:
Seventeen sinonasal OPs had unilateral occurrence and 16 of them (94.1%) had a lobulated configuration.The distribution of original sites differed significantly between OPs and IPs (p < 0.05).OPs (47.1%) particularly involved the maxillary sinus,while IPs (64.7%) usually arose from the lateral nasal wall.OPs exhibited isointense in 5 cases and grape- or patchy-like hyperintense in 12 on T1 weighted image, and isointense in 13 and hyperintense in 4 on T2 weighted image, with moderate enhancement. 10 OPs appeared as a Type II time intensity curve (TIC).There was significant difference of pre-contrast T1 signal intensity between OPs and IPs (p < 0.05).The prevalence of the imaging findings of “focal osteitis” (11.8% vs 94.1%) and “cystic change” (94.1% vs 17.6%) differed significantly between OPs and IPs (p < 0.05), but not for “cerebriform”sign (82.4% vs 94.1%) (p > 0.05).
Conclusion:
Three imaging features including high signal on T1 weighted image, cystic change and only a rare association of focal osteitis may help the diagnosis of OP distinguished from IP.
Advances in knowledge:
The typical imaging characteristics should prompt an accurate diagnosis of sinonasal OPs in routine clinical practice. Combination of CT and MR imaging characteristics can be more helpful in discriminating OPs from IPs.
Introduction
Oncocytic papilloma (OP), also known as columnar cell papilloma in the literature, is a relatively rare benign neoplasm arising from the Schneiderian membrane. It accounts for only 3 to 5% of three histologically distinct papillomas (inverted, exophytic, and oncocytic) in the sinonasal tract, being the rarest subtype.1 Previous studies of OP mainly focused on clinical features, surgical approaches, recurrent risk, malignant transformation,2–8 and the special imaging findings of sinonasal OP has not been described in the literature. OP may be easily misinterpreted as a sinonasal inverted papilloma (IP) in the clinical practice, and there is difference in drilling the bone at the attachment site between OP and IP during the endoscopic surgery, therefore accurate differential diagnosis of two types of papillomas can provide important and valuable information for pre-surgical evaluation. The aim of this study is to review imagining characteristics of OPs and improve the differential diagnosis with IPs.
Methods and materials
Subjects
The retrospective study was approved by our institutional review board with a waiver of informed consent.
Between May 2006 and March 2017, 17 consecutive patients (10 males, 7 females; mean age, 60.5 years; range, 32–80 years) with pathologically proven sinonasal OPs undergoing CT and MR imaging were recruited. The major clinical manifestations included nasal obstruction, rhinorrhea, intermittent nose bleeding. Over the same period, gender and age-matched 17 patients (9 males, 8 females; mean age, 55.8 years; range, 28–75 years) with pathologically confirmed IPs were randomly sampled from our imaging database as a control group. All 17 IPs were unilateral occurrence and one of them was a recurrent IP. All the OPs and IPs were excised by endoscopy in ENT department.
CT protocol
Noncontrast CT of the paranasal sinus was conducted on a 64-detector row CT scanner (Philips Healthcare, Best, Netherlands) in 34 patients. The scanning parameters were as follows:voltage, 120 kVp; current, 200 mAs; collimation, 64 × 0.625 mm; pitch, 0.89; ration speed, 0.42s; Matrix 512 × 512, and bone and standard soft tissue reconstruction algorithm. The images were reformatted in accordance with the following protocol: axial and coronal planes; section thickness 2 mm, interval 4 mm; bone window (width 2000 HU, level 200 HU) and soft-tissue window (width 400 HU, level 50 HU); field of view (FOV) 25 × 25 cm; extent including all the paranasal sinuses in both planes.
MR imaging protocol
34 patients underwent paranasal sinus MR imaging with an 8-channel head coil in GE 1.5 T (Signa Twin Speed Excite, GE Healthcare) or 3.0 T unit (Signa HDx; GE Healthcare). The routine MR imaging scanning protocol was comprised of unenhanced axial FSE T1 weighted image (T1WI) 500/10 [repetition time (TR) ms/echo time (TE) ms], and FSE T2 weighted image (T2WI) 3500/120 (TR ms/TE ms), dynamic contrast-enhanced (DCE) MR imaging, enhanced axial (adding frequency-selective fat saturation), coronal, and sagittal T1WI.The detailed acquisition parameters of the conventional sequences included 4 or 5 mm section thickness with 0.5 or 1 mm intersection gap, matrix of 256 × 256, 2–4 of excite, bandwidth of 41.67 kHz, FOV of 18 × 18 cm. Acquisition of DCE-MR imaging started simultaneously at the time of rapid bolus intravenous administration of 0.1 mmol gadopentate dimeglumine (Magnevist,0.5-mol l–1 solution; Schering, Berlin, Germany) per kilogram of body weight injected at 3 ml s–1 followed by 20 ml of saline at 2 ml s–1. DCE-MR imaging were acquired by 3D-LAVA (Liver Acquisition with Volume Acceleration) (TR ms/TE ms 3.9/1.8, section thickness/intersection gap 3.2/0 mm, FOV 18 × 18 cm, Matrix 256 × 160, Excite 1,and Bandwidth 23 kHz) in 24 patients (10 OPs and 15 IPs). Each group collected 16 images at 9 s, and the total 36 groups were continuously acquired and took 5 min 24 s.
In addition, diffusion weighted imaging (DWI) sequence was added in 7 patients (2 OPs and 5 IPs). Axial DWI images were obtained using PROPELLER DUO (TR ms/TE ms 4000/75, section thickness/intersection gap 4.0/0.5 mm, FOV 18 × 18 cm, Matrix 128 × 128, Excite 1, B values 0, 1000 s mm–2).
Image interpretation
The image numbers were delivered to two observers (BT Yang and JY Dong with subspecialist expertise in head and neck imaging for 17, and 10 years, respectively) by co-author (J Li).Two observers were blind to the patients’ information and independently reviewed the CT and MR images on a picture archiving and communication system (Huahai, Xi An, China).
The raw DCE-MR and DWI images were processed with Function tool software at GE AW 4.5 workstation.
The same two radiologists drew ROIs in consensus and selected the fastest and most prominently enhancing area from each focus at DCE-MR imaging. The size of oval ROI was about 15 mm2 and the corresponding TIC (time-intensity curve) was automatically generated. The Tpeak, contrast index, and washout ratio were calculated subsequently. The TICs classification criterion referred to our previous studies9,10:
Type I (persistent ascending) curve is defined as gradually increasing enhancement over the entire DCE-MR imaging scanning process (Tpeak >60 s);
Type II (plateau) curve is defined as early rapid enhancement but subsequent producing a plateau (Tpeak ≤ 60 s; washout ratio, 10–20%);
Type III (washout) curve is defined as early rapid enhancement but subsequent rapid decrease (Tpeak ≤ 60 s; washout ratio >20%).
After ADC maps of the 7 foci were produced, the same two radiologists drew ROIs and then measured their ADC (apparent diffusion coefficient) values in each. The size and location of the selected ROIs were identical to those of DCE-MR imaging.
Statistical analysis
The evaluation results of two observers were given to J Li, which were assessed with consistency check.
Data analyses were performed using SPSS 18.0 for Windows (SPSS, Chicago, IL).Imaging differences between sinonasal OPs and IPs were tested with Monte Carlo and Fisher’s exact test. A p value < 0.05 was considered to indicate a significant difference.
Result
Two observers had very good agreement on the evaluation of the image indicators (Kappa = 0.92).
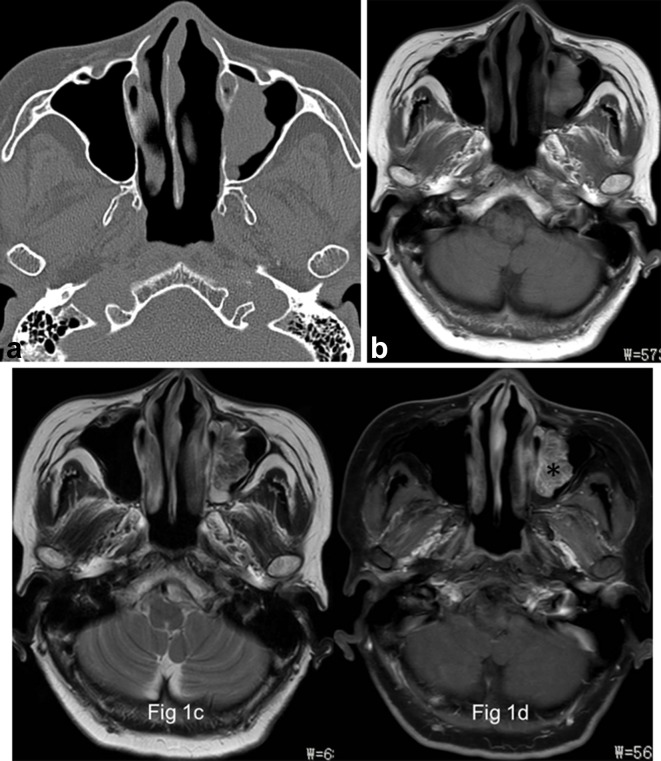
The mean greatest diameter of 17 sinonasal OPs was 3.6 cm (range, 1.5–6.2 cm) with a well-demarcated margin. Sixteen OPs (94.1%) had a lobulated configuration. All 17 OPs had unilateral sinonasal occurrence. The lesions occurred on the right in 12 cases (70.6%) and on the left in 5 (29.4%). Eight OPs (47.1%) arose from the maxillary sinus (Figure 1a), 4 (23.5%) from the lateral nasal wall, 3 from the choana- sphenoid region (17.6%), and 1 (5.9%) from the choana and sphenoid sinus in each. The Table 1 showed that the distribution of origin sites differed significantly between sinonasal OPs and IPs (p < 0.05).
Figure 1.
Images in a 66-year-old female with OP of the left maxillary sinus (a) Axial CT image shows a well-demarcated and lobulated mass arising from the medial wall of left maxillary sinus without bony hyperostosis. (b) and (c), The focus is of heterogeneously grape-like high signal (★) on axial T1- and isointense signal on T2 weighted MR images. (d) The focus exhibits a typical “cerebriform” sign on axial fat-suppressed contrast-enhanced MR image (*).
Table 1.
Comparison of the original site between sinonasal OPs and IPs
| Location | OP (n = 17) | IP (n = 17) |
| Maxillary sinus | 8 | 2 |
| Lateral nasal wall | 4 | 11 |
| Choana-spenoid region | 3 | 1 |
| Choana | 1 | 1 |
| Sphenoid sinus | 1 | 1 |
| Frontal sinus | 0 | 1 |
IP, inverted papilloma; OP, oncocytic papilloma.
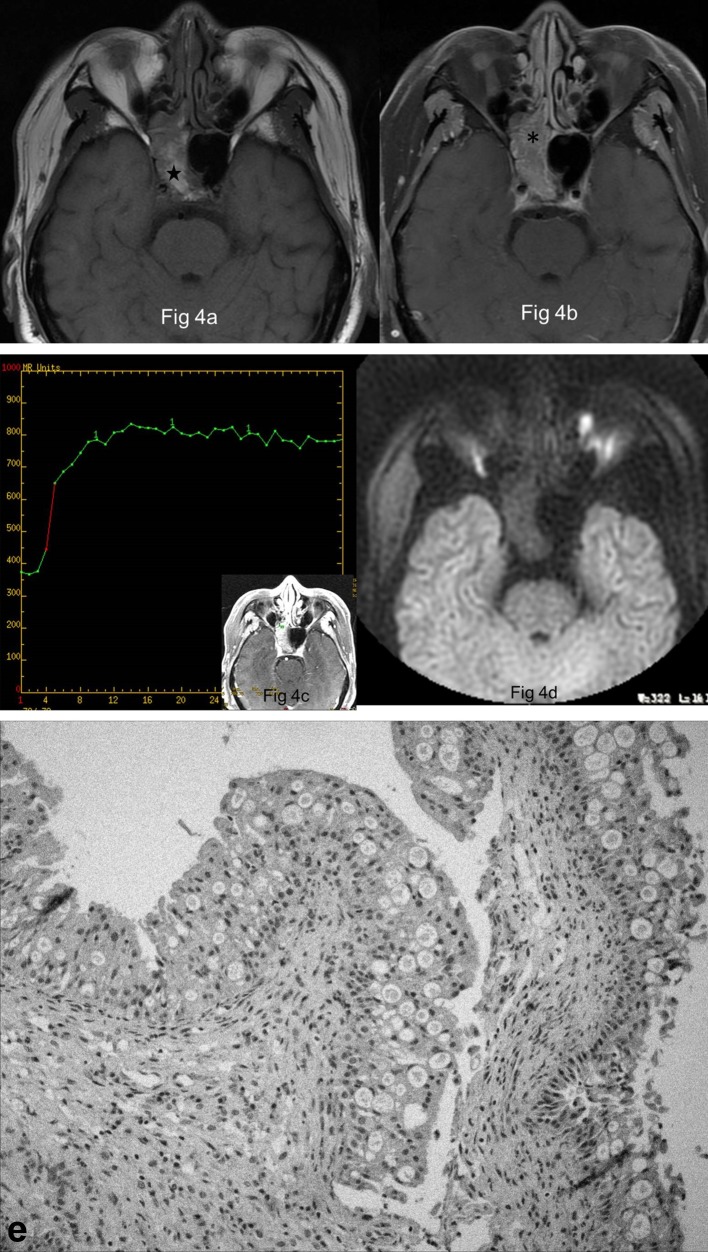
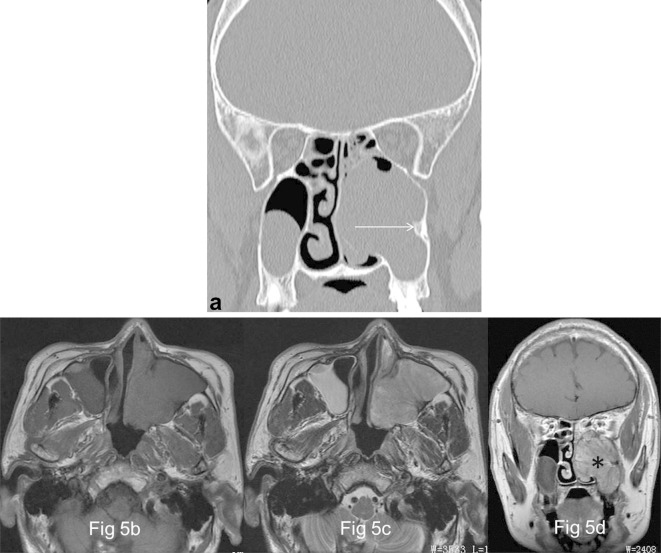
On pre-contrast CT, sinonasal OPs appeared as an isodense mass relative to gray matter. 12 OPs (70.6%) compressed the adjoining bone and gave rise to bony thinning and absorption. Compared with gray matter, OPs exhibited isointense in 5 cases (29.4%) and grape- or patchy-like hyperintense in 12 (70.6%) on T1WI (Figures 1b–4a), and isointense in 13 (76.5%) (Figures 1c–3b) and hyperintense in 4 (23.6%) on T2WI, with moderate enhancement on enhanced T1WI. One case was proved to show focal malignant degeneration, and the corresponding region demonstrated irregular shape and more heterogeneous signal on MR imaging. 10 OPs and 14 IPs had a Type II TIC on DCE-MR imaging (Figure 4c). The CI, Tpeak, and washout ratio of OPs and IPs were 0.88 ± 0.22 vs 0.92 ± 0.25, 51.85 ± 7.65 s vs 52.10 ± 7.85 s, and 14.10 ± 5.85% vs 13.82 ± 6.14%, respectively. There were no statistically significant differences for the 3 parameters between OPs and IPs (p > 0.05). No statistically significant difference was identified for the mean ADC value between OPs (1.82 × 10⁻³ mm2 s–1) and IPs (1.73 × 10⁻³ mm2 s–1) (Figure 4d) (p > 0.05). Pre-contrast T1 signal intensity showed statistically significant difference (p < 0.05), but other CT and MR imaging features did not differ significantly between OPs and IPs (Figure 5b,c) (p > 0.05) from the Table 2.
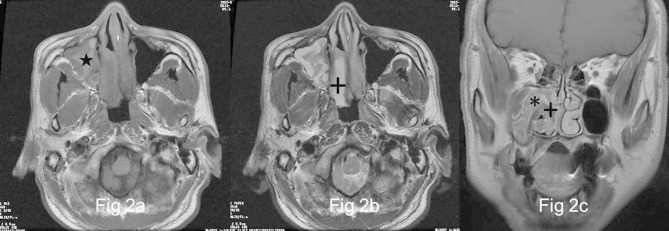
Figure 2.
Images in a 58-year-old male with OP of the right maxillary sinus (a) and (b), Right maxillary sinus has a well-demarcated and lobulated mass extending into right nasal tract, which reveals heterogeneously high signal (★) on axial T1- and isointense signal on T2 weighted MR images interspersing with multiple variable cystic changes of high T2 signal (+). (c) The focus exhibits heterogeneous enhancement with a typical “cerebriform” sign (*) on coronal fat-suppressed contrast-enhanced MR image. No enhancement of the cystic regions is noted (+).
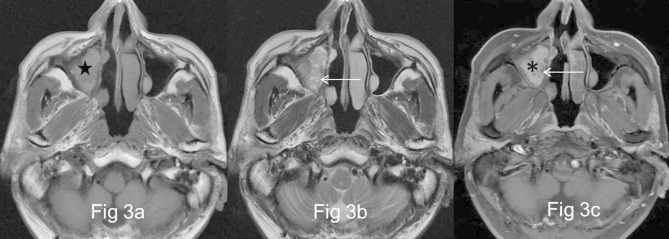
Figure 3.
Images in a 58-year-old male with recurrent OP of the right maxillary sinus (a) and (b), There is a well-demarcated and lobulated mass of the right maxillary sinus, being heterogeneously grape-like high signal (★) on axial T1- and isointense signal on T2 weighted MR images interspersing with multiple small cystic changes of high T2 signal (←). (c) The focus exhibits heterogeneous enhancement with a “cerebriform” sign (*) on axial fat-suppressed contrast-enhanced MR image. No enhancement of the cystic regions is noted (←).
Figure 4.
Images in a 68-year-old male with OP of the right sphenoid sinus (a) Right sphenoid sinus shows a well-demarcated and lobulated mass, being heterogeneously high signal (★) on axial T1 weighted MR image (b) The focus exhibits heterogeneous enhancement with a typical “cerebriform” sign on axial fat-suppressed contrast-enhanced MR image (*). (c) The focus reveals a type II TIC pattern on DCE-MR imaging. (d) The focus shows slightly hypointense signal on axial DWI. (e) Histologically, the focus shows papillary structures covered by columnar cells with eosinophilic cytoplasm admixed with intraepithelial microcysts (HE × 10).
Figure 5.
Images in a 57-year-old male with OP of the left maxillary sinus (a) Coronal CT image shows a well-demarcated and lobulated mass arising from the lateral wall of left maxillary sinus with typical “focal osteitis” of the original site (→). (b) and (c), The focus exhibits isointense signal on both axial T1- and T2 weighted MR images. (d) The focus appears as a typical “cerebriform” sign on coronal contrast-enhanced MR image (*).
Table 2.
Comparison of CT and MR imaging features between OPs and IPs
| Parameter | OP (n = 17) | IP (n = 17) |
| Margin | ||
| Well- demarcated | 17 | 17 |
| Ill- demarcated | 0 | 0 |
| Shape | ||
| Lobulated | 16 | 17 |
| Irregular | 1 | 0 |
| CT attenuation | ||
| Hypodense | 0 | 0 |
| Isodense | 17 | 17 |
| Hyperdense | 0 | 0 |
| T1WI | ||
| Hypointense | 0 | 0 |
| Isointense | 5 | 17 |
| Hyperintense | 12 | 0 |
| T2WI | ||
| Hypointense | 0 | 0 |
| Isointense | 13 | 17 |
| Hyperintense | 4 | 0 |
| Enhancement | ||
| Mild | 0 | 0 |
| Moderate | 17 | 17 |
| Marked | 0 | 0 |
| TIC pattern | ||
| Type I | 0 | 0 |
| Type II | 10 | 14 |
| Type III | 0 | 0 |
| DWI | ||
| Hypointense | 1 | 1 |
| Isointense | 1 | 4 |
| Hyperintense | ||
DCE,dynamic contrast-enhanced; DWI, diffusion weighted imaging; IP, invertedpapilloma; OP, oncocytic papilloma; TIC, time intensity curve; T1WI, T1 weighted image; T2WI, T2 weighted image.
10 OPs and 14 IPs underwent DCE-MR imaging; 2 OPs and 5 IPs underwent DWI.
The typical imaging signs were extracted and compared between sinonasal OPs and IPs. (1) Focal osteitis of the site of origin of OPs was identified in 2 cases (11.8%), which was optimally identified by CT and appeared as triangular bony hyperostosis; (2) Multiple cystic changes within OPs were detected in 16 cases (94.1%), which demonstrated scattered patchy high T1 and T2 signal in 2 cases, and diffuse low T1 and high T2 signal in 14 (Figures 2b and 3b).No enhancement of these cystic regions is noted; (3)The typical “cerebriform” sign was identified in 14 OPs (82.4%) on T2WI and enhanced T1WI (Figures 1d–4b). The Table 3 revealed that the prevalence of “focal osteitis” (Figure 5a) and “cystic change” sign differed significantly between sinonasal OPs and IPs (p < 0.05), but not for cerebriform” sign (Figure 5d) (p > 0.05).
Table 3.
Comparison of the characteristic imaging signs between OPs and IPs
| Key characteristic | OP (n = 17) | IP (n = 17) | Total (n = 34) |
| Focal osteitis | 2 | 16 | 18 |
| Cystic change | 16 | 3 | 19 |
| Cerebriform sign | 14 | 16 | 20 |
IP,inverted papilloma; OP, oncocytic papilloma.
After surgical resection, one patient showed recurrence (5.9%), the other patient developed focal malignant transformation to adenocarcinoma. These two patients underwent a second endoscopic surgery. After 2 to 10 years of follow-up, the other patients exhibited no abnormal change.
Discussion
The pathogenesis of sinonasal OPs is still unclear.11,12 Recent molecular studies have discovered the distinctness of each of the three histological subtypes of sinonasal papillomas. The key molecular changes of OP and its associated squamous cell carcinoma (SCC) were found to be related with activating KRAS mutations. The identification of KRAS mutations may be helpful to understand the pathogenesis of this entity.11
Grossly, sinonasal OP appears as a soft, pink or reddish-brown, papillary or polypoid mass. Microscopically, the epithelium is composed of tall, multilayered, columnar (cylindrical) cells with abundant, granular eosinophilic cytoplasm and small, hyperchromatic nuclei, which typically contains a great number of microcysts filled with mucin (Figure 4e). Its stroma alters from edematous to fibrous, which may have a moderate amount of lymphocytes, plasma cells, neutrophils.1,12,13
Sinonasal OPs have a tendency for local recurrence and malignant transformation as well as IPs. The malignancy rate of OPs is reported to be approximately 4–17%. Squamous cell carcinoma is the most frequent, although other rare tumor types such as adenocarcinoma, undifferentiated carcinoma or small cell carcinoma have also been encountered.3,14The recurrence rate of sinonasal OPs is reported to be 6%.8 On the basis of our study, OPs had a relatively lower recurrence rate (5.9%) and malignancy rate (5.9%).
The clinical features of sinonasal OPs are nonspecific. Almost all patients with OP present with unilateral nasal obstruction and a soft-tissue mass. Rhinorrhea, intermittent epistaxis, facial pain and headache may also occurred in some patients. These symptoms often persist for several months to a few years because of slow growth of OPs. On the grounds of our data and literature reports, OPs have no significant sex predilection, most frequently affecting patients in their fifth or sixth decades of life.3,7,8 All OPs are found to occur in the unilateral sinonasal tract. OPs show a high incidence in the paranasal sinus, especially the maxillary sinus, while IPs most commonly originate from the lateral wall of the nasal cavity.3,8
The following common imaging features of sinonasal OPs and IPs are as follows: (1) both OPs and IPs usually present lobulated-shape; (2) the signal features of two types of papillomas are alike and OPs also have a “cerebriform” appearance on T2WI or enhanced T1WI; (3) both show similar perfusion properties on DCE-MR imaging inferred by the same pattern of TIC (Type II); (4) both have similar DWI findings and their relatively high ADC values suggesting benign lesions. Their similar imaging features can further reflect the common origin (Schneiderian epithelium) of two patterns of papillomas.
In our present study, we found the following imaging characteristics of sinonasal OPs. (1) The prediction location of OPs is the maxillary sinus but IPs typically originate from the lateral nasal wall; (2) Focal osteitis of the site of origin, which is optimally demonstrated by using CT, was by far the more common in IPs than in OPs (94.1% vs 11.8%).The bony reactive hyperostosis caused by IPs may probably be due to the secretion of bone morphogenic peptide tumor cells7; (3) Grape- or patchy-like high signal on T1WI is a characteristic sign of OPs, which may be helpful in discriminating them from IPs. The major pathologic basis of this imaging sign may be due to containing a large amount of mucus within OPs; (4) Multiple intralesional cystic changes within OPs better showed by MR imaging was by far the more common in OPs than in IPs (94.1% vs 17.6%),which may correspond to multiple microcysts or secondary degeneration histologically. These cystic regions showed variable signal intensity on MR imaging but without enhancement. Therefore, the imaging features of high T1 signal, focal osteitis and cystic change can help to distinguish OPs from IPs in routine clinical practice. Furthermore, such findings can provide enough accurate diagnosis for OPs to obviate presurgical biopsy. Additionally, case studies showed that sinonasal OPs had a higher SUV than IPs on FDG-PET/CT imaging, which may serve as a complementary imaging sign.15,16
For sinonasal OPs, the MR imaging has two main roles prior to treatment. First, MR imaging can improve the diagnosis of OP based on its characteristic features, of which may enable rhinologists to make better surgical planning and preoperative counseling. Second, most importantly, it can be valuable in accurately defining the extent of OP, including the extension of OP beyond sinonasal tract. Consequently, MR imaging should act as a routine modality of choice for a suspected OP of the sinonasal tract.
Timely endoscopic surgical removal is the optimal treatment of choice for sinonasal OP once it has been highly suspected. This disease entity may have recurrence or malignant transformation, thus regular postoperative follow-up, including endoscopy and CT or MR imaging, is crucial for the early detection of these changes. A minimum follow-up of at least 5 years is advisable.7
Unfortunately, the number of patients undergoing DWI in our study is too small to make a definite conclusion. Thus, the DWI characteristics of these two types of papillomas should be further investigated with the increase of case numbers in the future.
In conclusion, although sinonasal OPs can have some similar imaging findings as IPs, our study showed that OPs had three distinctive features including T1 high signal, multiple mucous cystic changes, and rare focal osteitis occurrence. Therefore, a combination of CT and MR imaging may help differentiate the two patterns of sinonasal papillomas.
Contributor Information
Bentao Yang, Email: cjr.yangbentao@vip.163.com.
Jing Li, Email: ybt_108@163.com.
Jiyong Dong, Email: ybt_105@163.com.
REFERENCES
- 1.Barnes L, Bedetti C. Oncocytic Schneiderian papilloma: a reappraisal of cylindrical cell papilloma of the sinonasal tract. Hum Pathol 1984; 15: 344–51. doi: 10.1016/S0046-8177(84)80033-7 [DOI] [PubMed] [Google Scholar]
- 2.Maitra A, Baskin LB, Lee EL. Malignancies arising in oncocytic schneiderian papillomas: a report of 2 cases and review of the literature. Arch Pathol Lab Med 2001; 125: 1365–7. doi: [DOI] [PubMed] [Google Scholar]
- 3.Kaufman MR, Brandwein MS, Lawson W. Sinonasal papillomas: clinicopathologic review of 40 patients with inverted and oncocytic schneiderian papillomas. Laryngoscope 2002; 112(8 Pt 1): 1372–7. doi: 10.1097/00005537-200208000-00009 [DOI] [PubMed] [Google Scholar]
- 4.Subha ST, Prepageran N. Nasal cylindrical cell papilloma. Med J Malaysia 2005; 60: 103–5. [PubMed] [Google Scholar]
- 5.Cheng TY, Ueng SH, Chen YL, Chang KP, Chen TM. Oncocytic schneiderian papilloma found in a recurrent chronic paranasal sinusitis. Chang Gung Med J 2006; 29: 336–41. [PubMed] [Google Scholar]
- 6.Bignami M, Pistochini A, Meloni F, Delehaye E, Castelnuovo P. A rare case of oncocytic Schneiderian papilloma with intradural and intraorbital extension with notes of operative techniques. Rhinology 2009; 47: 316–9. [DOI] [PubMed] [Google Scholar]
- 7.Vorasubin N, Vira D, Suh JD, Bhuta S, Wang MB. Schneiderian papillomas: comparative review of exophytic, oncocytic, and inverted types. Am J Rhinol Allergy 2013; 27: 287–92. doi: 10.2500/ajra.2013.27.3904 [DOI] [PMC free article] [PubMed] [Google Scholar]
- 8.Karligkiotis A, Bignami M, Terranova P, Gallo S, Meloni F, Padoan G, et al. . Oncocytic Schneiderian papillomas: clinical behavior and outcomes of the endoscopic endonasal approach in 33 cases. Head Neck 2014; 36: 624–30. doi: 10.1002/hed.23341 [DOI] [PubMed] [Google Scholar]
- 9.Yang B, Wang Y, Wang S, Dong J, Bentao Y, Yongzhe W. Magnetic resonance imaging features of Schwannoma of the sinonasal tract. J Comput Assist Tomogr 2015; 39: 860–5. doi: 10.1097/RCT.0000000000000308 [DOI] [PubMed] [Google Scholar]
- 10.Yang BT, Li SP, Wang YZ, Dong JY, Wang ZC. Routine and dynamic MR imaging study of lobular capillary hemangioma of the nasal cavity with comparison to inverting papilloma. AJNR Am J Neuroradiol 2013; 34: 2202–7. doi: 10.3174/ajnr.A3523 [DOI] [PMC free article] [PubMed] [Google Scholar]
- 11.Udager AM, McHugh JB, Betz BL, Montone KT, Livolsi VA, Seethala RR, et al. . Activating KRAS mutations are characteristic of oncocytic sinonasal papilloma and associated sinonasal squamous cell carcinoma. J Pathol 2016; 239: 394–8. doi: 10.1002/path.4750 [DOI] [PubMed] [Google Scholar]
- 12.Bishop JA. OSPs and ESPs and ISPs, Oh My! an update on sinonasal (Schneiderian) papillomas. Head Neck Pathol 2017; 11: 269–77. doi: 10.1007/s12105-017-0799-9 [DOI] [PMC free article] [PubMed] [Google Scholar]
- 13.Kalfert D, Laco J, Celakovský P, Smatanová K, Ludvíková M. Oncocytic Schneiderian papilloma of frontal sinus. Acta Medica 2013; 56: 170–2. doi: 10.14712/18059694.2014.14 [DOI] [PubMed] [Google Scholar]
- 14.el-Naggar A, Slootweg PJ, Chan JKC. Sinonasal papilloma, oncocytic type : World Health Classification of Tumors: Head and Neck. Lyon: The British Institute of Radiology.; 2017. 19–20. [Google Scholar]
- 15.Lin FY, Genden EM, Lawson WL, Som P, Kostakoglu L. High uptake in schneiderian papillomas of the maxillary sinus on positron-emission tomography using fluorodeoxyglucose. AJNR Am J Neuroradiol 2009; 30: 428–30. doi: 10.3174/ajnr.A1264 [DOI] [PMC free article] [PubMed] [Google Scholar]
- 16.Koyama M, Terauchi T, Koizumi M, Tanaka H, Takeuchi K. Sinonasal oncocytic Schneiderian papilloma accompanied by intravascular lymphoma: A case report on FDG-PET/CT imaging. Medicine 2016; 95: e4646. doi: 10.1097/MD.0000000000004646 [DOI] [PMC free article] [PubMed] [Google Scholar]


