Abstract
Many cell types communicate by means of dendritic extensions via a multi-tiered set of geometric and chemical cues. Until recently, mimicking the compartmentalized in vivo cellular environment of dendrite-expressing cells such as osteocytes and motor neurons in a spatially and temporally controllable manner was limited by the challenges of in vitro device fabrication at submicron scales. Utilizing the improved resolution of current fabrication technology, we have designed a multiscale device, the Macro-micro-nano system, or Mμn, composed of two distinct cell-seeding and interrogation compartments separated by a nanochannel array. The array enables dendrite ingrowth, while providing a mechanism for fluidic sequestration and/or temporally-mediated diffusible signaling between cell populations. Modeling of the Mμn system predicted the ability to isolate diffusible signals, namely ATP. Empirical diffusion studies verified computational modeling. In addition, cell viability, dendrite interaction with the nanoarray, and cellular purinergic response to heat shock were experimentally evaluated within the device for both osteocytes and motor neurons. Our results describe a novel in vitro system in which dendrite-expressing cell types can be studied within nano-environments that mimic in vivo conditions. In particular, the Mμn system enables real-time observation of cell to cell communication between cell populations in distinct, but fluidically coupled regions.
Keywords: Microfluidics, Purinergic sigaling, Osteocytes, Bone, Lacunar canalicular system, Neurons
1. Introduction
Nanoscale interactions among cells and extracellular signaling molecules, i.e. those occurring at scales less than 1 μm, are essential elements of numerous biological processes including cell adhesion (Plotkin et al. 2007), migration (Lauffenburger and Horwitz 1996), proliferation (Vander Heiden et al. 2009), and apoptosis (Orrenius et al. 2003). Examples of cells with such interactions are those that utilize arrays of dendritic cell processes to achieve highly selective pathways of intercellular communication, e.g. cells of the nervous system (Aldskogius and Kozlova 1998; Allen and Barres 2009; Lingenhöhl and Finch 1991; Theodosis et al. 2008), dendritic cells within the immune system (Banchereau and Steinman 1998), and osteocytes in bone (Burra et al. 2010; Thi et al. 2013; You et al. 2004). Modeling such interactions in vitro is complicated. For dendrite expressing cells, the fundamental challenge is to create an environment in vitro that allows identification and study of specific cellular interactions mediated by cell processes or dendritic networks.
Among the dendrite-expressing cells of the body, osteocytes are unique as they reside buried in the mineralized extracellular matrix of bone. Osteocyte cell bodies sit within lacunae, and their numerous cell processes extend within small canals (i.e, canaliculi) of less than 1 μm diameter (You et al. 2004). Between the cell membrane and bony walls there is a narrow extracellular fluid space, the lacunar-canalicular space (LCS). The fluid space around osteocyte cell bodies is on the order of 1 μm in width, while the space surrounding cell processes <200 nm in width (You et al. 2004). Because of this unique fluid microenvironment, osteocyte interactions with their neighbors in bone are limited to solute transport (metabolites, paracrine signals) within this fluid space by diffusion and convection and direct gap junction transport where processes of adjacent cells contact each other (Schalper et al. 2010; Thi et al. 2012; Xu et al. 2015). Gap junction connections between cells can be studied in vitro. However, osteocytes are not matrix-producing cells so they cannot create the appropriate 3-dimensional environment (i.e., LCS) in vitro. Thus, the unique microenvironment that defines so much of how osteocytes experience their world is absent from in vitro modeling. Studies have addressed osteocyte calcium signaling in 2D open plate networks as well as in 3D fluidic systems and explants, however the highly constrained spatial environment and the resulting unique transport limitations within the LCS have yet to be replicated in a reproducible in vitro system (Lu et al. 2012; Takai et al. 2004; Wei et al. 2015; You et al. 2008).
Here we report a novel device called the Macro-micro-nano (Mμn) to model key aspects of the pericellular spaces (ie., LCS) and the unique transport limitations therein. The Mμn system consists of two distinct cell-seeding compartments connected by an array of submicron diameter channels. The current study uses the Mμn device to measure purinergic signaling responses of osteocytes and neurons to heat shock, which induces bolus release of ATP. The Mμn demonstrates precise fluidic separation under flow, diffusion profiles in the nanochannel array under static conditions, long term cell viability and measurable cell to cell communication. Using this approach, we focused our developmental studies on assessing the role(s) of the purine nucleotide ATP in osteocyte paracrine signaling in a constrained spatial environment. ATP is ubiquitous signaling mechanism used for paracrine communication among cells (Kringelbach et al. 2014; Romanello et al. 2001). In osteocytes, ATP signaling appears to play a central role as a proximal signal in the initiation of both bone modeling and remodeling in response to a variety of stimuli (Hoebertz et al. 2002; Orriss et al. 2010). The Mμn demonstrates spatially resolved cell response to interrogation, i.e. changes in purinergic signaling and corresponding ATP receptor abundance post-heat shock.
2. Methods
2.1. Device design
The Mμn was designed for parallel flow in two cell-seeding regions separated by an array of channels, with two inlets and two outlets for the respective flow regions, as shown in Fig. 1. The seeding regions are 1-mm-wide by 10-mm-long to increase cell plating area and surface area for cell interaction along the interface length between the channel array and cell seeding region. The seeding regions are separated by a 100 μm-wide channel array, comprised of submicron diameter channels that are separated by 10 μm. The height of the seeding regions and the channel array were designed to be 50 μm and 5 μm, respectively, but are adjustable during fabrication.
Fig. 1.
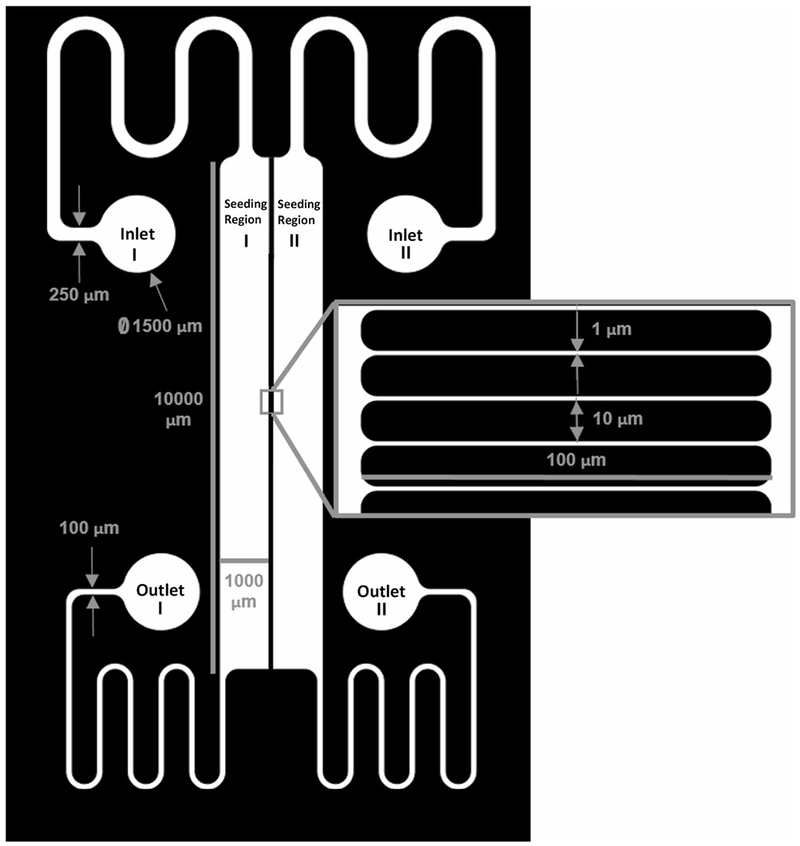
Mμn System Schematic. Mask designed in AutoCAD software showing parallel flow device. The macro element is comprised of two 1-mm-wide by 10-mm-long cell seeding regions and two sets of inlet and outlet ports for parallel flow. The micro element is comprised of a 100-μm-wide channel array separating the two seeding regions for fluidic separation and modulation of diffusible signaling. The nano component is comprised of 900-nm-diameter channels within the array for modulation of diffusible signaling and dendrite in-growth
2.2. Device fabrication
The Mμn system was fabricated as shown in Fig. 2. Two photomasks were designed in 2D using computer aided design software, AutoCAD 2017 (Autodesk Inc.) and produced in chrome on quartz (Advanced Reproductions Corporation, Andover, MA) for submicron resolution. The first mask consisted of the device design with open channels in the center (channel mask), while the second mask contained a 100 μm-wide strip that blocked the channel array from further exposure (seeding region mask).
Fig. 2.
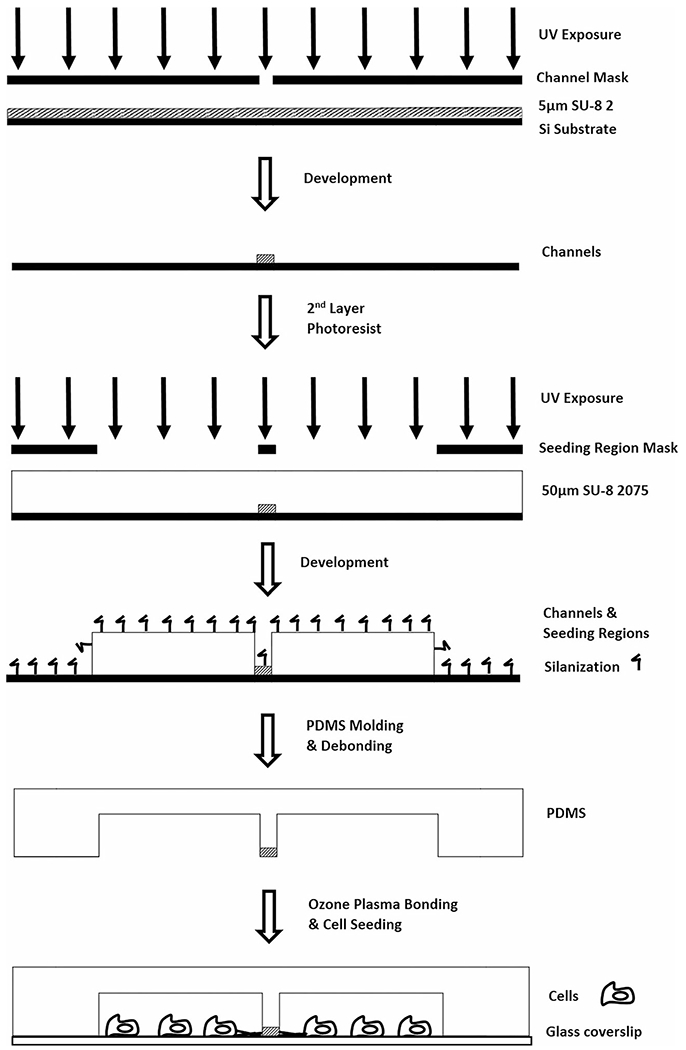
Fabrication Process. Illustration of the two-step photolithography protocol for the creation of a tiered, master mold of the Mμn system, including the use of two distinct photoresists, SU-8 2 and SU-8 2075, modified exposure and development steps, and PDMS molding and bonding
A two-step photolithography protocol was performed to produce a 5 μm-thick channel array connecting two 50 μm-thick cell seeding regions and inlet/outlet ports. First, the open channel mask was used to produce a 5 μm-thick photoresist surface pattern. The negative photoresist SU-8 2 (MicroChem Corp., Westborough, MA) was spin coated onto a silicon (Si) wafer (Nova Electronic Materials, Flower Mound, TX) at 500 rpm for 10 s with a ramp acceleration of 100 rpm/s then 1000 rpm for 30 s with a ramp acceleration of 500 rpm/s. A prebake of 1 min at 65 °C and 3 min at 95 °C was performed. UV exposure was performed with the channel mask via an automated mask aligner (EVG620, EV Group, Austria) with an exposure dosage of 100 mJ/cm2 by broadband UV source filtered to exclude wavelengths greater than 350 nm. A post-exposure bake of 1 min at 65 °C and 1 min at 95 °C was followed by photoresist development for 5–10 min in SU-8 developer (MicroChem) and consecutive rinses with isopropyl alcohol (IPA) (Spectrum Chemical, New Brunswick, NJ) and deionized water (diH2O). Wafers were dried with nitrogen gas and dehydrated for the second photolithography step at 65 °C for 5 min.
The second photolithography step used the negative photoresist SU-8 2075 (MicroChem), spin coated with the same ramp speeds and times as the first step, but with the 30 s spin performed at 4000 rpm for a thickness of 50 μm. A prebake of 2 min at 65 °C and 7 min at 95 °C was also performed. The previously exposed wafer was aligned with the seeding region mask blocking the channel array and exposed to the filtered UV source at a dosage of 210 mJ/cm2. A post-exposure bake of 1 min at 65 °C and 6 min at 95 °C was performed followed by a 10 min development, IPA/diH20 rinses, and nitrogen/hotplate drying, resulting in the final master mold.
Molds composed of photoresist patterns on Si wafers were silanized by liquid deposition. Molds were submerged in a mixture of methanol (Spectrum Chemical), diH2O, and Trichloro(1H,1H,2H,2H–perfluorooctyl)silane (448,931, Sigma Aldrich, St. Louis MO) at a ratio of 20 mL:1 mL:106 μL, respectively, and gently agitated for 1–2 h to complete the silanization reaction. Molds were rinsed consecutively with IPA and diH2O, and dried with nitrogen gas. Elastomeric patterned devices were constructed of polydimethylsiloxane (PDMS) (Sylgard 184, Dow Corning, Midland, MI). PDMS was mixed at a ratio of 9:1, base:curing agent, degassed, poured onto the device molds, and heated for 20 min at 75 °C in an oven (Sheldon Manufacturing Inc., Cornelius, OR). PDMS devices were then removed from the mold manually (i.e. demolding).
After demolding, PDMS devices were manually excised and inlets and outlets were stamped with a 1.5 mm-diameter hole punch (Harris Uni-Core). The final closed devices were assembled by bonding PDMS to glass coverslips (Electron Microscopy Sciences, Hatfield, PA) via ozone plasma treatment. Each bonding surface was exposed to oxygen plasma gun (Electro-technic Products Inc., Chicago, IL) for 30 s and bonded manually as described previously (McCutcheon et al. 2016). Lastly, the fluidic seal was tested by flowing diH2O or phosphate buffered saline (PBS) (10,010,023, Thermo Fisher Scientific, Waltham, MA) at 1 mL/min through both sides of the device via a syringe pump (NE-1600, New Era Pump Systems, Farmingdale, NY) for approximately 5–10 min.
2.3. Computational simulations
A two-dimensional simulation of flow within the Mμn device was performed using COMSOL Multiphysics 4.3 (COMSOL Inc., Burlington, MA). The inlet and outlet volumetric flow rate for each port was set to 10 μL/min, as determined by calculating a parallel flow plate shear rate significantly below the cell excitation threshold of 8 dyne/cm2 (Weinbaum et al. 1994). The calculation was performed with the assumption of 50 μm-high cell-seeding regions of 1 mm width, where τ is shear stress (Pa), Q is volumetric flow rate (m3/s), μ is dynamic viscosity (Pa-s), W is chamber width (m), and H is chamber height (m), as per Poiseuille flow within rectangular channels, defined in Eq. (1) (Nidadavolu 2013):
| (1) |
A coupled two-dimensional simulation of small molecule diffusion and flow was performed using COMSOL software to determine the sequestration of small molecules to one seeding region during operation and to examine the concentration gradient within the nanochannel array. For simulation, a model molecule was used to mimic a commercially-available soluble ATP (AM8110G, Sigma Aldrich), with a molecular weight of 551 Da and a diffusivity of 302 μm2/s in dilute aqueous solution near 37 °C (Kalwarczyk et al. 2012). All internal walls of the Mμn system were modeled with a no-flux condition, and the fluid was assigned properties equal to water at 37 °C.
A coupled two-dimensional simulation of heat transfer across the device was performed using COMSOL software to evaluate the extent to which heat shock is a viable cell interrogation strategy within the Mμn. Material properties were defined as in the fluidics simulations, described previously, and boundary conditions were such that the temperature of the heat source and sink remained constant. Heating one side of the Mμn at 60 °C with a heat sink at room temperature 20 °C on the other side was simulated for a period of 30 s. The simulation was assessed based on the ability of the device to prevent excessive temperature elevation on the unheated side, thus allowing differential heating stimuli in the two seeding regions.
2.4. Diffusion experiments
Diffusion experiments were performed using molecules approaching the size (550 Da) and diffusivity (302 μm2/s) of ATP in aqueous solution. Inner surfaces of the Mμn system were coated at 30 μg/mL with fibronectin (F1141, Thermo Fisher Scientific), a common extracellular matrix protein used in a variety of in vitro systems with dendrite-expressing cells (Tanaka-Kamioka et al. 1998; Tomaselli et al. 1987). Fluorescent molecules 479 Da Rhodamine (83,697, Sigma Aldrich) and 379 Da Fluorescein (F6377, Sigma Aldrich) with theoretical diffusivities of 415 and 425 μm2/s, respectively, (Culbertson et al. 2002), were suspended in solution at 100 μg/mL in PBS. Solution containing the diffusion tracers was pumped through one seeding region of the device, while a solution of PBS, only, was pumped through the other in parallel at 10 μl/min, as per computational modeling.
Stationary diffusion of these molecules was performed to determine their diffusivity across the channel array in cell-seeded and non-seeded devices. Fluorescent molecules were loaded into one side of the device at 100 μg/mL in PBS (source compartment), while pure PBS was loaded into the other side under parallel flow. The flow was stopped after 10 min, allowing free diffusion across the array. The time required for fluorescence in the PBS compartment to reach 25% of the maximum fluorescence in the source compartment was recorded and used to calculate diffusivity by Eq. (2), previously developed to describe diffusion through a porous scaffold in parallel flow bioreactors (Podichetty et al. 2012):
| (2) |
C0 is initial concentration (mol/m3), C is concentration (mol/m3) at 25% of maximum fluorescence, A is area of diffusion (m2), D is diffusivity (m2/s), V is volume (m3) of fluid in each chamber, t is time (s), and δ is the width (m) of the channel array. Relative concentration was measured by fluorescence intensity, normalized by maximal concentration. Maximum intensity was calibrated to.
2.5. Cell culture
MLO-Y4 osteocyte-like cells (gift of Lynda Bonewald, University of Missouri, Kansas City) (Kato et al. 1997) were cultured in alpha-MEM (32571–036, Thermo Fisher Scientific) plus 2.5% fetal bovine serum (FBS) (16,000,036, Thermo Fisher Scientific), 2.5% heat inactivated calf serum (16,140,063, Thermo Fisher Scientific), and 100 U/mL penicillin streptomycin (15,140,122, Thermo Fisher Scientific). B35 motor neurons (CRL-2754, ATCC, Manassas, VA) were cultured in DMEM (30–2002, ATCC) with 10% FBS.
2.6. Seeding and viability within the Mμn system
The cell interface surfaces of the device were coated with fibronectin at 30 μg/mL in PBS at room temperature (20 °C) for 1 h and then flushed with cell medium before plating. Cells were loaded into the device by a syringe pump at 100 μl/min in both seeding regions at 1 × 10⁶ cells/mL. Cells were incubated overnight (>12 h) to allow for sufficient attachment and to ensure viability before staining. MLO-Y4 cells were cultured in the device for an additional 7 days to allow for process growth, with the medium being replaced every 24–48 h. A dimensionless parameter called Dendrite-array interaction efficiency, ηD-A, was defined as the total number of channels in contact with dendrites normalized by the total number of channels in the image frame, that is percentage of channels contacting dendrites. Values of ηD-A were measured after 7 days of incubation using brightfield microscopy.
Fluorescence dyes were used to determine cell viability within the Mμn system after 7 days of incubation in standard cell culture conditions. A solution was prepared with propidium iodide (P3566, Thermo Fisher Scientific) at 10 μg/mL to stain necrotic cells and Calcein AM (C3100MP, Thermo Fisher Scientific) at 1 μg/mL to stain live cells. Cells were incubated for 30 min before visualization. After 7 days, cells were imaged for process ingrowth into the channel array with both brightfield microscopy and confocal microscopy, as observed by Calcein AM staining and a fluorescent gene reporter (MPRM21927-LvPM02, Genecopoeia, Rockville, MD).
2.7. Measurement of purinergic response
Purinergic response was quantified by measurements of extracellular ATP concentration and ATP receptor, P2X7, expression after heat shock. MLO-Y4 and B35 cell lines were plated in the Mμn device and cultured for 7 days. The respective devices were heated on one side using the heat shock setup shown in Fig. 6. A flat, flexible heating element (KHLV-101/10, Omega Engineering, Norwalk, CT) was controlled using a PID feedback controller (CNi3233, Omega Engineering) and thermocouple (SA2C-K, Omega Engineering). The opposite side was controlled at 20 °C using an aluminum block as a heat sink. Heat shock treatment consisted of 30 s heating at 60 °C. Apoptosis was quantified by caspase 3 dye (C10423, Thermo Fisher Scientific) on the heated and unheated side of the device at 1, 6, and 12 h post-heat shock. Extracellular ATP on each side of the Mμn was quantified after 1, 6, and 12 h and compared to an unheated control device at its respective timepoint. Medium was siphoned from each side of the device. ATP in the extracted medium was quantified using a Firefly Bioluminescence assay (A22066, Thermo Fisher Scientific) and measured by plate reader (BioTek Instruments, Winooski, VT).
Fig. 6.
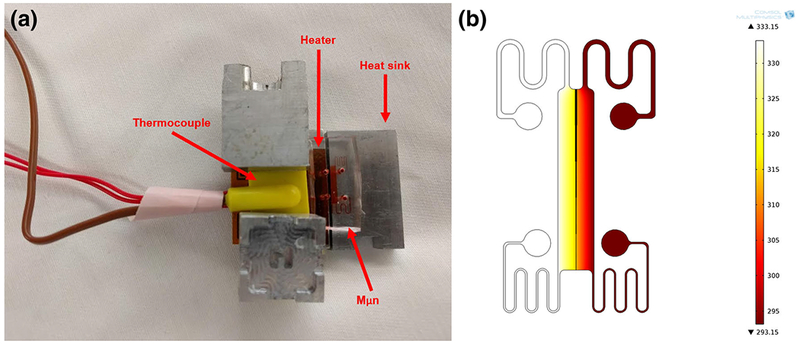
Heat Shock Apparatus and Model. a Heat shock setup for the Mμn system, with heating block, PID controller, flexible polyimide heating element, K-type thermocouple, and heat sink. b Heat profile for heat shock at 60 °C for 30 s, scale in Kelvin
P2X7 ATP receptor levels were assessed by immunocytochemistry in MLO-Y4 cells located within 200 μm of the channel array on both sides of the device at 6 and 12 h post heat shock, as well as in unheated controls. For each condition, cells were rinsed 3 times with PBS, fixed in formalin (HT501128, Sigma Aldrich) for 10 min, rinsed 2 times in PBS, permeablized with 0.1% Triton-X (X100, Sigma Aldrich) and 0.1% bovine serum albumin (BSA) (A7906, Sigma Aldrich) in PBS for 10 min, blocked with 1.0% BSA in PBS for 1 h, rinsed 3 times with blocking buffer, incubated in 10 μg/mL anti-P2X7 rabbit primary antibody (PA5–25581, Thermo Fisher Scientific) diluted in antibody diluent (53,022, Dako, Santa Clara, CA) for 2 h at 20 °C, rinsed 3 times in PBS, incubated in 10 μg/mL anti-rabbit secondary antibody (A11012, Thermo Fisher Scientific) in antibody diluent for 30 min at 20 °C, stained with Hoechst 33,342 nucleus stain (R37606, Thermo Fisher Scientific) for 20 min, rinsed twice with PBS, and preserved in glycerol (G5516, Thermo Fisher Scientific).
2.8. Imaging
The final patterned Si wafer used to cast the functional PDMS device, was imaged by scanning electron microscopy (SEM) with tilt capability (Nova Nano SEM 450, FEI, Hillsboro, Oregon) to view the Mμn system profile and to confirm the height of the channels and seeding regions.
Brightfield microscopy was performed using an inverted microscopy (Nikon TE300, Morell, Melville, NY) by 20× objective (Nikon) to image PDMS devices as well as to determine cell morphology and process growth into the channel array. Images were obtained using a CCD camera (Spot Insight, Diagnostic Instruments Inc., Sterling Heights, MI) and its corresponding software (SPOT 5.0).
Fluorescence microscopy was performed using an inverted fluorescence microscope (Nikon Eclipse TE200-U, Morell, Melville, NY). The diffusion profile across the channel array was measured via fluorescence intensity as a function of molecular position via ImageJ (NIH, Bethesda, MD) image analysis. The fluorescence profile was measured by normalized fluorescence intensity as a function of pixel coordinates across the channel array. Cell viability was calculated as total Calcein AM positive cells normalized by total stained cells. The Calcein AM staining was repeated and cells were imaged at 40× by confocal microscopy (LSM 710, Zeiss) to visualize dendrite extension into the channel array after 7 days of incubation. Additionally, MLO-Y4 cells with a RANKL gene reporter were imaged to visualize process extension into the array using fluorescein at 100 μg/mL as a background contrast agent at 63× via confocal. P2X7 receptor staining was imaged by confocal microscopy at 40×. P2X7 receptor expression was measured using mean fluorescence intensity over the area of each cell body by ImageJ.
2.9. Data analysis
Diffusivity of fluorescent molecules, cell viability, and ηD-A. were calculated as average and standard deviation with n >3 samples. Differences in diffusivity values between fluorescent molecules with and without cells in the device, differences in viability, and differences in ηD-A across osteocytes and motor neurons were measured by student’s t-test. Differences in apoptosis and ATP concentration over time and between sides of the Mμn as well as differences in P2X7 receptor expression were determined by ANOVA and post-hoc tukey test. Significance was defined as a p value less than 0.05.
3. Results and discussion
3.1. Design and fabrication of Mμn system
The device with scaled dimensions is shown in Fig. 1. Each seeding region is 1 mm in width by 10 mm in length. The 10mm2 cell-seeding area of each region allows approximately 103 to 104 cells at confluence depending on cell origin and phenotype. The 10 mm length provides an extensive interface to promote cellular interaction with the array. The array consists of approximately 900 channels that are 1 μm wide with 10 μm separation, as seen on the photomask. Note that the interstitial spaces of fabricated channels are approximately 900 nm in diameter due to the addition of surface coatings needed for cell-based applications (Oberhauser et al. 2002).
The device was fabricated using two-step photolithography process as shown in Fig. 2. A chrome on quartz mask was used for both steps, allowing for resolution of the channel array below 1 μm. The channel region was measured to be 5.1 +/− 1.2 μm thick and the seeding regions were 50.6 +/− 1.4 μm thick. The SEM profile of the Mμn design is shown in Fig. 3.
Fig. 3.
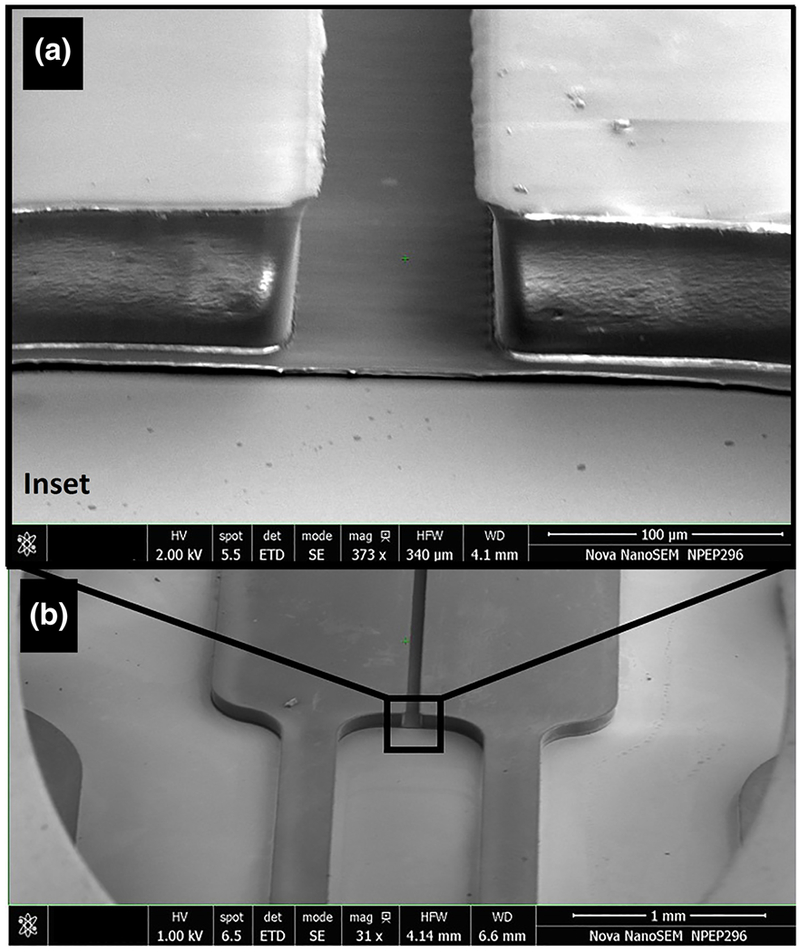
SEM of Mμn System. Profile view of patterned photoresist on the Si master mold after two-step photolithography process, demonstrating the tiered structure of the Mμn and fine channel detail. Cell seeding regions and the paired inlet/outlet ports are 50 μm in height and the channel array is 5 μm in height. Detail inset view (a) with macroscale view (b)
The master mold was created with photoresist on Si, and devices were fabricated via PDMS. We report that without silanization both the PDMS devices and master mold were partially damaged in demolding. After silanization the channel array was reproduced with greater than 90% yield. The average width of the channels in PDMS was measured to be 930 nm +/− 350 nm. The PDMS device was bonded to a glass microscope slide substrate and examined for fluidic seal and channel array integrity. A profile schematic of the assembled device, as well as an image of the bonded device, are shown in Fig. 4.
Fig. 4.
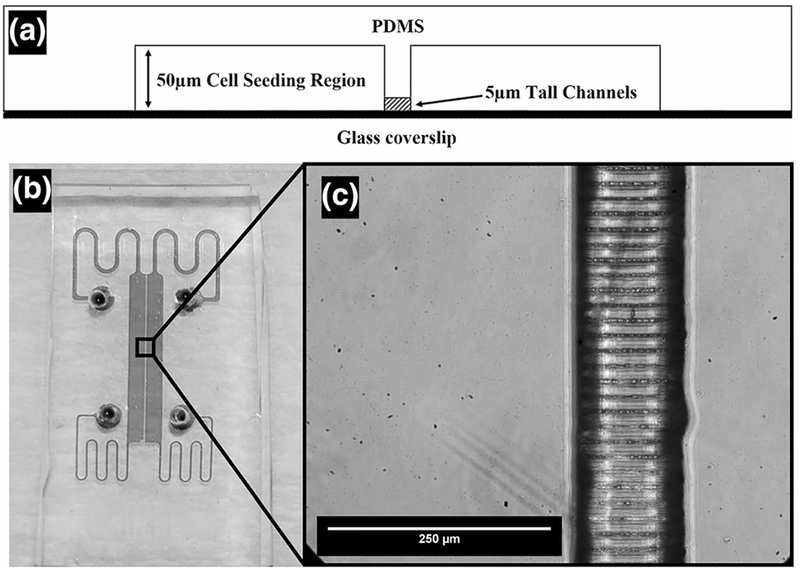
Final PDMS Molded and Bonded Mμn System. Profile schematic of PDMS bonded Mμn (a) with top down view of bonded PDMS device (b) and channel detail (c)
The Mμn was designed to achieve fluidic separation between two cell-seeding regions using the nanochannel array as a series of conduits for cell process in-growth. The channel array width was set at 100 μm to prevent instantaneous diffusion between regions and allow the development of a concentration gradient between regions. Seeding region separation is critical to facilitate different experimental treatments of each cell population. The concentration gradient is crucial for eliciting dendrite ingrowth and promoting cell to cell communication.
Submicron resolution using soft lithography was paramount for the Mμn system to properly mimic the pericellular space of osteocyte processes and neuronal axons. Achieving channel widths of less than 1 μm in tandem with channel lengths on the micron-scale and large device features on the millimeter-scale was difficult. Fabrication involved tight control of resist thickness (+/− 1 μm), utilizing nanometer resolution masks, repeated calibration of exposure dose (+/− 5 mJ), mask alignment, and minimizing diffraction within the resist for approaching the resolution limit of UV light (Levenson et al. 1982). Surface treatment of the master mold by silane chemistry was also beneficial for achieving submicron resolution and preventing device damage, emphasizing the critical nature of demolding efficiency at submicron scales as previously reported (Schaap and Bellouard 2013; Shao et al. 2010).
For the master mold, the low viscosity negative photoresist SU-8 2 facilitated control of the channel height to 4–5 μm, while the higher viscosity SU-8 2075 was used for the second 50 μm height needed in the cell seeding regions. The height profile is critical in multiple respects. The reduction in aspect ratio for the channel array of 5:1, height to channel width, prevents inference between features during exposure and allows for much easier demolding at single micron and submicron scales. Additionally, the reduced height more readily mimics the physical space through which dendritic processes interact in vivo, and therefore may promote increased phenotypic similarity and cell function of dendrite-expressing cells within the Mμn system. Further, a 50 μm-high cell seeding region and inlet/outlet ports increases the volume of medium available to cells, thereby reducing toxic metabolite accumulation. The 50 μm-high segments are also the predominant flow regions within the device, and the increased cross-sectional area reduces the shear stress imposed on adherent cells within these regions.
3.2. Computational and experimental validation of transport with the Mμn system
Diffusion within the Mμn system was computationally modeled to determine the solute profile across the channel array with parallel flow. Figure 5 shows the diffusion profile of an ATP-like molecule across the channel array under parallel flow of equal magnitude, 10 μL/min, within both sides of the device. It is demonstrated that the device facilitates solute sequestration within seeding compartments, and generates a concentration gradient across the channel array. Additionally, modeling of fluid velocity illustrated that the fluid shear within the cell-seeding regions at 10 μl/min is below the threshold known to elicit a mechotransductive cellular response in cells (<8 dyne/cm2) (Weinbaum et al. 1994), and that there is little to no cross flow through the channel array.
Fig. 5.
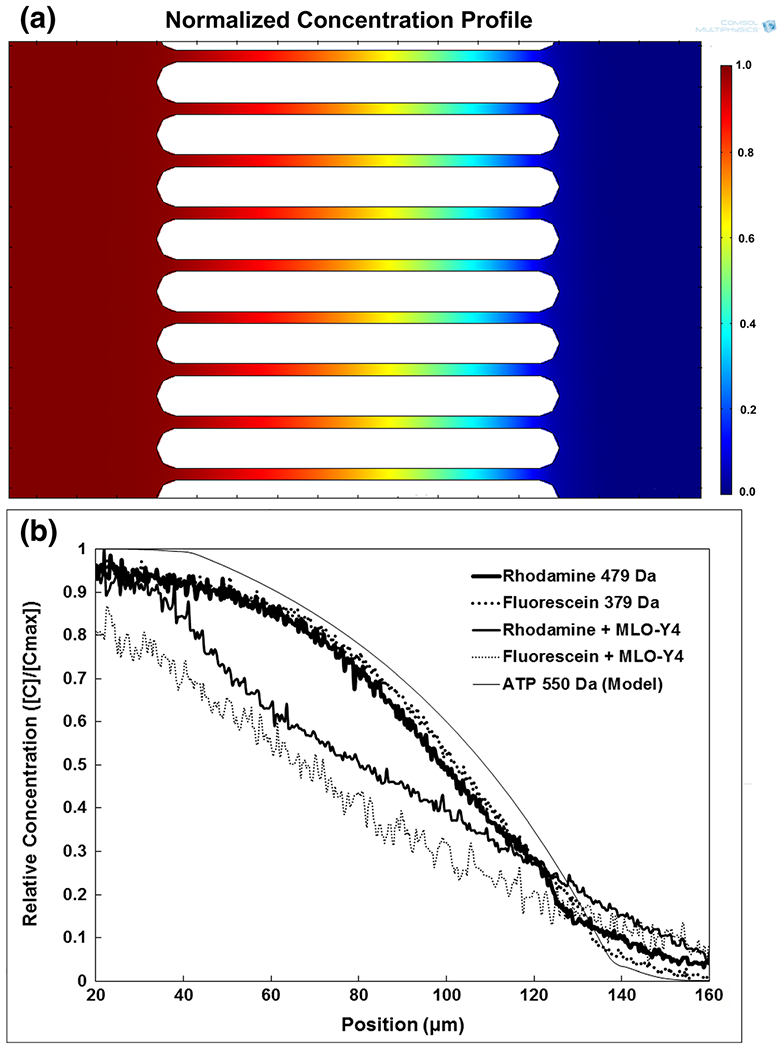
Small Molecule Diffusion. a Modeled normalized concentration profile across nanochannel array for ATP with a constant source concentration of 1 and sink concentration of 0 in opposite seeding compartments at an inlet flow rate of 10 μL/min. ATP modeled to have a diffusivity of 302 μm2/s. b Experimental distribution curve of Fluorescein (379 Da), Rhodamine 6G (Molecular weight 479 Da), Fluorescein with MLO-Y4 osteocytes, Rhodamine with MLO-Y4 osteocytes, and modeled ATP across the nanochannel array within one seeding region at 10 μM with 10 μL/min inlet flow rate and inlet flow in the other seeding region at 0 μM with 10 μL/min flow rate, demonstrating fluidic isolation of seeding regions under fluid flow and stable solute gradient across the channel array
Solubilized fluorescent molecules of size and diffusivity similar to ATP were experimentally flowed on one side of the device in parallel with PBS alone, and the diffusion profile was measured as a function of normalized fluorescence intensity across the channel array. The diffusion profiles for Rhodamine and Fluorescein, under 10 μL/min parallel flow are shown in Fig. 5. The results illustrate the clear sequestration of molecules from one side of the channel array to the other. As seen, the diffusion profiles of the two small molecules are very similar as are their measured diffusivities with significantly decreased diffusivity in cell-seeded devices. A summary of the data for both theoretical and experimental diffusion parameters is shown in Table 1.
Table 1.
One-Dimensional stationary diffusivity of small molecules within the Mμn System
| Molecule | MW (Da) | Theoretical diffusivity (μm2/s) | Experimental diffusivity (μm2/s) |
|---|---|---|---|
| Rhodamine 6G | 479 | 414 | 255.56 +/− 11.6 |
| Fluorescein | 376 | 425 | 290.53 +/− 25.0 |
| Rhodamine 6G + MLO-Y4 | - | - | 191.67 +/− 15.8* |
| Fluorescein + MLO-Y4 | - | - | 182.78 +/− 8.1* |
| ATP | 551 | 302 | - |
p < 0.05 between respective tracer diffusivities of cell-seeded devices and devices with no cells
The heat profile for 30 s heat shock experiments was computationally modeled. It was shown that for a uniform heat source of 60 °C and uniform heat sink at 20 °C, room temperature, the minimum in the heat shock region did not fall below 55 °C, while the maximum in the shielded region did not exceed 37 °C. The heating apparatus and computational heat map are shown in Fig. 6.
The experimental results validate the computational model used for ATP diffusion under parallel flow to within 10%, highlighting the Mμn system’s versatility in using parallel flow for control of extracellular signaling molecules, and evaluating their impact on cells plated within the Mμn. Additionally, the experimental free diffusion measurements indicate that diffusion across the array is consistent with the expected values for each molecule. The measured diffusivities were modestly lower than literature values (Culbertson et al. 2002), which may be due to a narrowing of the channels as a result of the fibronectin coating. The decreased diffusivity upon cell seeding is expected given the decreased cross-sectional area for diffusion (Malik et al. 2010), due to process ingrowth and resultant partial channel obstruction. After 7 days of incubation, it is expected that, in addition to the fibronectin coating, the cells produce their own extracellular matrix (Aarden et al. 1996), which may also affect the diffusion of small molecules across the array. Taken together, the results illustrate the predictable diffusion of small, ATP-like molecules across the array for assessment of nanoscale intercellular communication.
3.3. Cell seeding, viability and interaction
Osteocytes and motor neurons, two notable dendritic cells types, were seeded within the Mμn system and evaluated for viability and interaction with the channel array (Fig. 7, Table 2). Calcein AM staining demonstrated that a significant number of cells extended their dendrites either partially or fully across the 100-μm-array length as shown in Figs. 7 and 8. It was also shown that cells from either side of the array extended their dendrites into the same channel and contacted cells from the opposing region.
Fig. 7.
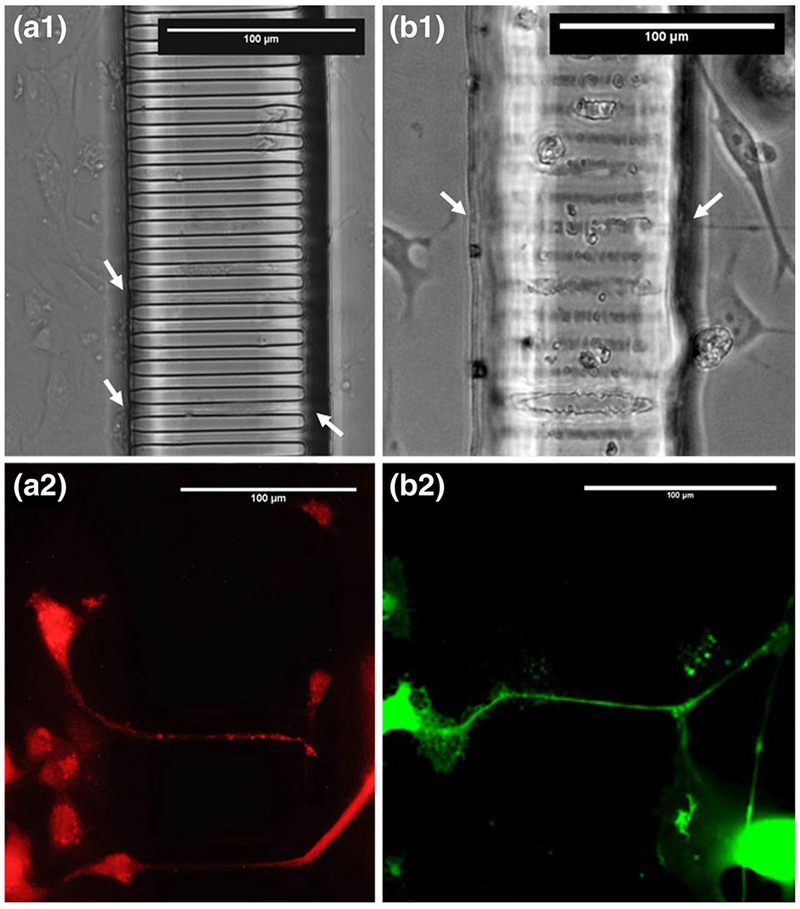
Cells within the Mμn System. MLO-Y4 osteocytes and B35 motor neurons adjacent to the nanochannel array construct. Phase contrast images of MLO-Y4 (a) and B35 (b) demonstrating cell phenotype and contact with channel array. Fluorescence images of Calcein AM stained cell MLO-Y4 (c) and B35 (d) demonstrating process extension across the array. Black arrows indicate process in-growth. Dashed lines indicate channel array boundaries
Table 2.
Cell survival and interaction with Mμn channels at 7 days incubation
| Cell type | Viability (%) | Dendrite-array interaction (%) |
|---|---|---|
| MLO-Y4 Osteocytes | 92.9 +/− 8.4 | 60.8 +/− 7.4 |
| B35 Motor Neurons | 94.2 +/− 2.9 | 25.4 +/− 12.2 |
Fig. 8.
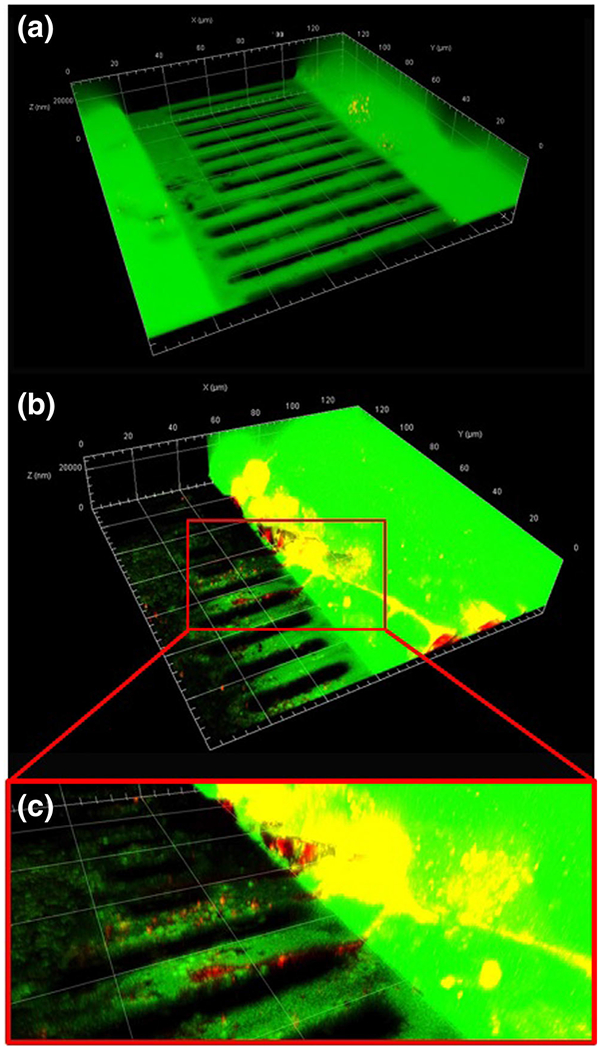
Small Molecule Diffusion in Cell-Seeded Mμn. Fluorescein at 100 μg/mL diffused across the Mμn device, coated with 30 μg/mL fibronectin, but no cells (a) and coated with fibronectin and seeded with MLO-Y4 osteocytes (b) with cell extension inset (c)
Peak ηD-A. remained low for motor neurons at approximately 25%, but osteocytes exhibited 61% interaction efficiency at 7-days incubation. Osteocytes demonstrated a higher interaction efficiency, ηD-A, than neurons, likely due to phenotypic differences between the cell types. Osteocytes exhibit a high degree of contact inhibition, and therefore slow proliferation, however, osteocytes, with increased culture time, demonstrate an increase in dendritic extension in conditioned medium (Tan et al. 2007). By contrast, the B35 motor neurons demonstrated lower interaction with the array, likely due to lack of chemically driven axonal growth induction, which is typically used to elicit neuronal connection (Lykissas et al. 2007). The traversing of the channel array structure by extensions of both cell types indicates the potential for cell to cell interaction between regions, and is readily initiated and interrogated using the Mμn system. The Mμn provides a platform to pursue fundamental biological questions, such as the spatial and temporal dependence of osteocyte purinergic signaling (Genetos et al. 2007), or the combinatorial interactions of glial cells and neurons (Fields and Burnstock 2006; Rochon et al. 2001).
Cell viability after 7 days of incubation of osteocytes was 93%, while cell viability of motor neurons within the Mμn was 94% as determined by Calcein AM and PI staining. Both cell populations showed greater than 90% viability. High levels of viability indicate that the seeding regions are of sufficient height for nutrient diffusion and prevention of toxic metabolite accumulation, given a medium replacement frequency of 24 to 48 h. It also demonstrates that the level of cell death due to the device itself is minimal, eliminating any baseline impacts of necrotic or apoptotic cell signaling for subsequent experiments. Additionally, there was no statistical difference in viability found between osteocytes and neurons within the Mμn system, a positive indicator for device compatibility with different cell types.
Heat shock-induced apoptosis was sequestered to the heated side up to 12 h post-stimulus for both cell types, with significantly more (4 to 5 fold) caspase positive cells on the heated side as shown in Fig. 9. Measurement of post-heat shock extracellular ATP showed elevated ATP levels for osteocytes, but not for motor neurons. On the heated side, extracellular ATP levels increased significantly after heat shock for MLO-Y4 osteocytes, 2.8 times unheated control, and decreased over time. On the unheated side, ATP levels increased over time for osteocytes, peaking at 3.7 times control after 12 h. There was a significant difference between opposing seeding regions at time 1 and 12 h. In contrast, there was no notable modulation of extracellular ATP for B35 motor neurons as a function of heat shock on either side of the device. All extracellular ATP measurements fell within the range of 1 to 15 nM. Results of ATP quantification are shown in Fig. 9.
Fig. 9.
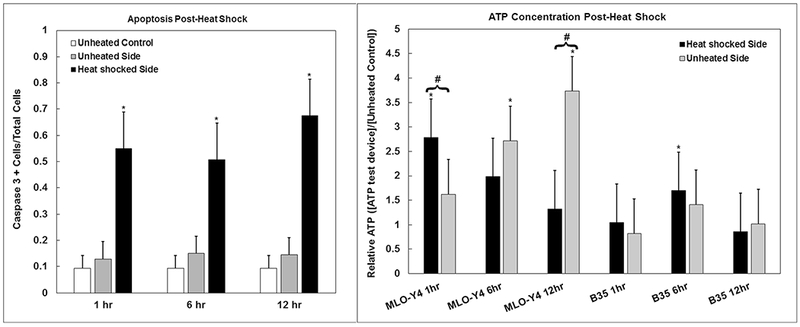
Apoptosis and Extracellular ATP Concentration. Proportion of Caspase 3 positive cells post-heat shock, MLO-Y4 osteocytes and B35 neurons combined (left). Relative concentration of ATP in cell medium from both sides of the device (heated and unheated) after 1,6, and 12 h, normalized by unheated control within the Mμn at respective timepoints for both MLO-Y4 osteocytes and B35 neurons respectively (right). *indicates significant difference from unheated control. # indicates significant difference from opposing side of the Mμn post-heat shock, p < 0.05
With the marked increase in extracellular ATP for osteocytes after heat shock, the expression of a prominent ATP receptor, P2X7, was investigated. Results illustrate that osteocytes on both sides of the device had significantly elevated levels of P2X7 at both 6 and 12 h post-heat shock (approximately twofold above unheated devices (Fig. 10).
Fig. 10.
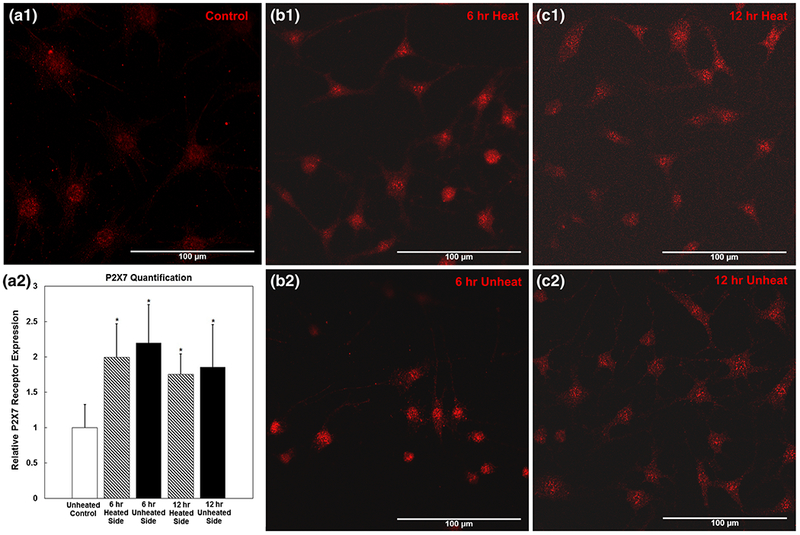
P2X7 Expression. Immunocytochemistry of P2X7 ATP receptor for MLO-Y4 osteocytes for unheated control (a1), at 6 h after heat shock on the unheated side (b1) and heated side (b2), and at 12 h after heat shock on the unheated side (c1) and heated side (c2). Quantification relative to unheated control (a2). *indicates significance relative to unheated control, p <0.05
Of the two cell types tested, heat shock-induced ATP release was only shown in MLO-Y4 osteocytes. There was a notable shift in extracellular ATP over time within the device for osteocytes, indicating a diffusible signaling cascade from heat shocked cells through the nanochannel array to adjacent non-heat shocked cells. There appeared to be maintenance of the response through the 12-h time point. These data are consistent with reported bolus release of ATP during apoptosis in osteocytes (Schaffler et al. 2014). For B35 motor neurons there was no clear response to heat-shock. Despite apoptosis in motor neurons being equivalent to osteocytes in our heat shock tests, previous studies have postulated that the motor neurons possess a mechanism to inhibit or slow apoptosis via protective heat shock proteins (Plumier et al. 1997), which may play a role in the muted bolus release of ATP. Critically, accurate measurements of small molecule concentration within the Mμn were achieved, enabling observation of differential cell responses to the heat shock stimulus.
The consistent upregulation of P2X7 receptor after heat-sock in osteocytes indicates that the cells within the system not only release ATP due to apoptosis, but also respond to elevated extracellular ATP levels. The constant upregulation across timepoints and subpopulations is not, however, proportional to the observed changes in extracellular ATP concentration. This may indicate that the response is saturated, and initial increases in P2XY take longer than 12 h to return to baseline. It was clearly demonstrated that cells can be interrogated and subsequently imaged in real time or as fixed samples in situ within the Mμn system
4. Conclusions
We have designed and fabricated a fluidic device that functions at the macro, micro, and nanoscale to recapitulate the geometric and chemical cues seen by cells with dendrite-mediated communication in vivo. This device enables evaluation of dendrite-mediated cell signaling, over time, in response to controlled transport of ATP-like molecules. Data illustrate that two distinct cell types, osteocytes and motor neurons, remained viable and interactive within the device for up to 7 days. Data also show that release and diffusion of purinergic signals as well as cellular response, can be quantified within our device. These results underline the Mμn system as a versatile platform for the study of dendritic cell signaling in vitro. In addition, the range of geometric scales will further enable insight into immediate and downstream cell behaviors governed by dendrite-based cell to cell communication, such as the role of osteocytes in osteoclastogenesis.
Acknowledgements
Tanya Singh, The City College of New York
National Institutes of Health Grant #5R01AR041210-23
National Science Foundation Grant #CBET0939511
National Institutes of Health Grant #R21EY026752
CUNY Advanced Science Research Center
Wallace H. Coulter Foundation
References
- Aarden E, Wassenaar A-M, Alblas MJ, Nijweide PJ, Immunocytochemical demonstration of extracellular matrix proteins in isolated osteocytes. Histochem. Cell Biol. 106, 495–501 (1996) [DOI] [PubMed] [Google Scholar]
- Aldskogius H, Kozlova EN, Central neuron–glial and glial–glial interactions following axon injury. Prog. Neurobiol 55, 1–26 (1998) [DOI] [PubMed] [Google Scholar]
- Allen NJ, Barres BA, Neuroscience: Glia—More than just brain glue. Nature 457, 675–677 (2009) [DOI] [PubMed] [Google Scholar]
- Banchereau J, Steinman RM, Dendritic cells and the control of immunity. Nature 392, 245–252 (1998) [DOI] [PubMed] [Google Scholar]
- Burra S, Nicolella DP, Francis WL, Freitas CJ, Mueschke NJ, Poole K, Jiang JX, Dendritic processes of osteocytes are mechanotransducers that induce the opening of hemichannels. Proc. Natl. Acad. Sci 107, 13648–13653 (2010) [DOI] [PMC free article] [PubMed] [Google Scholar]
- Culbertson CT, Jacobson SC, Michael Ramsey J, Diffusion coefficient measurements in microfluidic devices. Talanta 56, 365–373 (2002) [DOI] [PubMed] [Google Scholar]
- Fields RD, Burnstock G, Purinergic signalling in neuron–glia interactions. Nat. Rev. Neurosci 7, 423–436 (2006) [DOI] [PMC free article] [PubMed] [Google Scholar]
- Genetos DC, Kephart CJ, Zhang Y, Yellowley CE, Donahue HJ, Oscillating fluid flow activation of gap junction hemichannels induces ATP release from MLO-Y4 osteocytes. J. Cell. Physiol 212, 207–214 (2007) [DOI] [PMC free article] [PubMed] [Google Scholar]
- Hoebertz A, Mahendran S, Burnstock G, Arnett TR, ATP and UTP at low concentrations strongly inhibit bone formation by osteoblasts: A novel role for the P2Y2 receptor in bone remodeling. J. Cell. Biochem 86, 413–419 (2002) [DOI] [PubMed] [Google Scholar]
- Kalwarczyk T, Tabaka M, Holyst R, Biologistics—diffusion coefficients for complete proteome of Escherichia Coli. Bioinformatics 28, 2971–2978 (2012) [DOI] [PMC free article] [PubMed] [Google Scholar]
- Kato Y, Windle JJ, Koop BA, Mundy GR, Bonewald LF, Establishment of an osteocyte-like cell line, MLO-Y4. J. Bone Miner. Res. 12, 2014–2023 (1997) [DOI] [PubMed] [Google Scholar]
- Kringelbach TM, Aslan D, Novak I, Schwarz P, Jørgensen NR, UTP induced ATP release is a fine-tuned signalling pathway in osteocytes. Purinergic Signal 10, 337–347 (2014) [DOI] [PMC free article] [PubMed] [Google Scholar]
- Lauffenburger DA, Horwitz AF, Cell migration: A physically integrated molecular process. Cell 84, 359–369 (1996) [DOI] [PubMed] [Google Scholar]
- Levenson MD, Viswanathan N, Simpson RA, Improving resolution in photolithography with a phase-shifting mask. Electron Devices, IEEE Transactions on 29, 1828–1836 (1982) [Google Scholar]
- Lingenhöhl K, Finch DM, Morphological characterization of rat entorhinal neurons in vivo: Soma-dendritic structure and axonal domains. Exp. Brain Res. 84, 57–74 (1991) [DOI] [PubMed] [Google Scholar]
- Lu XL, Huo B, Park M, Guo XE, Calcium response in osteocytic networks under steady and oscillatory fluid flow. Bone 51, 466–473 (2012) [DOI] [PMC free article] [PubMed] [Google Scholar]
- Lykissas MG, Batistatou AK, Charalabopoulos KA, Beris AE, The role of neurotrophins in axonal growth, guidance, and regeneration. Curr. Neurovasc. Res 4, 143–151 (2007) [DOI] [PubMed] [Google Scholar]
- Malik R, Burch D, Bazant M, Ceder G, Particle size dependence of the ionic diffusivity. Nano Lett. 10, 4123–4127 (2010) [DOI] [PubMed] [Google Scholar]
- McCutcheon S, Unachukwu U, Thakur A, Majeska R, Redenti S, and Vazquez M (2016). In vitro formation of Neuroclusters in microfluidic devices and cell migration as a function of stromal-derived growth factor 1 gradients. Cell adhesion & migration, 0 [DOI] [PMC free article] [PubMed] [Google Scholar]
- Nidadavolu SS (2013). Analysis and comparison of parallel plate flow chambers to determine consistency of fluid forces on cells
- Oberhauser AF, Badilla-Fernandez C, Carrion-Vazquez M, Fernandez JM, The mechanical hierarchies of fibronectin observed with single-molecule AFM. J. Mol. Biol 319, 433–447 (2002) [DOI] [PubMed] [Google Scholar]
- Orrenius S, Zhivotovsky B, Nicotera P, Regulation of cell death: The calcium-apoptosis link. Nat. Rev.Mol. Cell Biol. 4, 552–565 (2003) [DOI] [PubMed] [Google Scholar]
- Orriss IR, Burnstock G, Arnett TR, Purinergic signalling and bone remodelling. Curr. Opin. Pharmacol 10, 322–330 (2010) [DOI] [PubMed] [Google Scholar]
- Plotkin LI, Manolagas SC, Bellido T, Glucocorticoids induce osteocyte apoptosis by blocking focal adhesion kinase-mediated survival evidence for inside-out signaling leading to anoikis. J. Biol. Chem 282, 24120–24130 (2007) [DOI] [PubMed] [Google Scholar]
- Plumier JCL, Hopkins DA, Robertson HA, Currie RW, Constitutive expression of the 27-kDa heat shock protein (Hsp27) in sensory and motor neurons of the rat nervous system. J. Comp. Neurol 384, 409–428 (1997) [PubMed] [Google Scholar]
- Podichetty JT, Dhane DV, Madihally SV, Dynamics of diffusivity and pressure drop in flow-through and parallel-flow bioreactors during tissue regeneration. Biotechnol. Prog 28, 1045–1054 (2012) [DOI] [PubMed] [Google Scholar]
- Rochon D, Rousse I, Robitaille R, Synapse–glia interactions at the mammalian neuromuscular junction. J. Neurosci 21, 3819–3829 (2001) [DOI] [PMC free article] [PubMed] [Google Scholar]
- Romanello M, Pani B, Bicego M, D’Andrea P, Mechanically induced ATP release from human osteoblastic cells. Biochem. Biophys. Res. Commun 289, 1275–1281 (2001) [DOI] [PubMed] [Google Scholar]
- Schaap A, and Bellouard Y (2013). Fabrication of topologically-complex 3D microstructures by femtosecond laser machining and polymer molding. Paper presented at: CLEO: Applications and Technology (Optical Society of America) [Google Scholar]
- Schaffler MB, Cheung W-Y, Majeska R, Kennedy O, Osteocytes: Master orchestrators of bone. Calcif. Tissue Int. 94, 5–24 (2014) [DOI] [PMC free article] [PubMed] [Google Scholar]
- Schalper KA, Sánchez HA, Lee SC, Altenberg GA, Nathanson MH, Sáez JC, Connexin 43 hemichannels mediate the Ca2+ influx induced by extracellular alkalinization. Am. J. Phys. Cell Phys. 299, C1504–C1515 (2010) [DOI] [PMC free article] [PubMed] [Google Scholar]
- Shao PG, van Kan JA, and Watt F (2010). Sub Micron Poly-Dimethyl Siloxane (PDMS) Replication Using Proton Beam Fabricated Nickel Moulds. Paper presented at: Key Engineering Materials (Trans Tech Publ) [Google Scholar]
- Takai E, Mauck RL, Hung CT, Guo XE, Osteocyte viability and regulation of osteoblast function in a 3D trabecular bone explant under dynamic hydrostatic pressure. J. Bone Miner. Res. 19, 1403–1410 (2004) [DOI] [PubMed] [Google Scholar]
- Tan SD, de Vries TJ, Kuijpers-Jagtman AM, Semeins CM, Everts V, Klein-Nulend J, Osteocytes subjected to fluid flow inhibit osteoclast formation and bone resorption. Bone 41, 745–751 (2007) [DOI] [PubMed] [Google Scholar]
- Tanaka-Kamioka K, Kamioka H, Ris H, Lim SS, Osteocyte shape is dependent on actin filaments and osteocyte processes are unique actin-rich projections. J. Bone Miner. Res. 13, 1555–1568 (1998) [DOI] [PubMed] [Google Scholar]
- Theodosis DT, Poulain DA, Oliet SHR, Activity-dependent structural and functional plasticity of astrocyte-neuron interactions. Physiol. Rev 88, 983–1008 (2008) [DOI] [PubMed] [Google Scholar]
- Thi MM, Islam S, Suadicani SO, Spray DC, Connexin43 and pannexin1 channels in osteoblasts: Who is the “hemichannel”? J. Membr. Biol 245, 401–409 (2012) [DOI] [PMC free article] [PubMed] [Google Scholar]
- Thi MM, Suadicani SO, Schaffler MB, Weinbaum S, Spray DC, Mechanosensory responses of osteocytes to physiological forces occur along processes and not cell body and require α(V)β(3) integrin. Proc. Natl. Acad. Sci. U. S. A 110, 21012–21017 (2013) [DOI] [PMC free article] [PubMed] [Google Scholar]
- Tomaselli KJ, Damsky CH, Reichardt LF, Interactions of a neuronal cell line (PC12) with laminin, collagen IV, and fibronectin: Identification of integrin-related glycoproteins involved in attachment and process outgrowth. J. Cell Biol. 105, 2347–2358 (1987) [DOI] [PMC free article] [PubMed] [Google Scholar]
- Vander Heiden MG, Cantley LC, Thompson CB, Understanding the Warburg effect: The metabolic requirements of cell proliferation. Science 324, 1029–1033 (2009) [DOI] [PMC free article] [PubMed] [Google Scholar]
- Wei C, Fan B, Chen D, Liu C, Wei Y, Huo B, You L, Wang J, Chen J, Osteocyte culture in microfluidic devices. Biomicrofluidics 9, 014109 (2015) [DOI] [PMC free article] [PubMed] [Google Scholar]
- Weinbaum S, Cowin SC, Zeng Y, A model for the excitation of osteocytes by mechanical loading-induced bone fluid shear stresses. J. Biomech 27, 339–360 (1994) [DOI] [PubMed] [Google Scholar]
- Xu H, Gu S, Riquelme MA, Burra S, Callaway D, Cheng H, Guda T, Schmitz J, Fajardo RJ, Werner SL, et al. , Connexin 43 channels are essential for normal bone structure and osteocyte viability. J. Bone Miner. Res. Off. J. Am. Soc. Bone Miner. Res 30, 436–448 (2015) [DOI] [PMC free article] [PubMed] [Google Scholar]
- You LD, Weinbaum S, Cowin SC, Schaffler MB, Ultrastructure of the osteocyte process and its pericellular matrix. Anat. Rec. A: Discov. Mol. Cell. Evol. Biol 278, 505–513 (2004) [DOI] [PubMed] [Google Scholar]
- You L, Temiyasathit S, Tao E, Prinz F, Jacobs CR, 3D microfluidic approach to mechanical stimulation of osteocyte processes. Cell. Mol. Bioeng 1, 103–107 (2008) [Google Scholar]


