

Abstract
Background
Bioavailable 25-hydroxy vitamin D (25(OH)D) has been suggested for the accurate determination of vitamin D status. The purpose of this study was to determine the utility of bioavailable 25(OH)D in assessing vitamin D status when vitamin D-binding protein (VDBP) was significantly altered by pregnancy and liver cirrhosis (LC). The role of genotyping of GC, a gene encoding VDBP, in the determination of bioavailable 25(OH)D concentration in a Korean population was also evaluated.
Methods
This prospective study enrolled a total of 136 subjects (53 healthy controls, 45 patients with LC, and 38 pregnant women) from 2017 to 2018. The concentrations of total 25(OH)D and VDBP were measured, and bioavailable 25(OH)D concentrations were calculated. GC genotyping was performed to determine rs4588 and rs7041 polymorphisms. Clinical and laboratory data were compared among the three groups of subjects.
Results
Median VDBP and total 25(OH)D concentrations were 165.2 μg/ml and 18.5 ng/ml in healthy controls, 76.9 μg/ml and 10.5 ng/ml in patients with LC, and 368.9 μg/ml and 17.7 ng/ml in pregnant women, respectively. Compared with controls, patients diagnosed with LC had significantly lower VDBP and total 25(OH)D concentrations (all P < 0.001) while pregnant women had significantly higher VDBP concentrations (P < 0.001). Although total 25(OH)D concentrations in pregnant women were similar to those in controls (P = 0.394), their bioavailable 25(OH)D concentrations were significantly lower (1.2 vs. 3.0 ng/ml; P < 0.001). Among all the three groups combined, the genotype-specific bioavailable 25(OH)D and the genotype-independent bioavailable 25(OH)D concentrations did not differ significantly (P = 0.299).
Conclusions
Our study has demonstrated that bioavailable 25(OH)D concentration reflects vitamin D status more accurately than the total 25(OH)D concentration, especially in pregnant women. In addition, GC genotyping did not significantly affect bioavailable 25(OH)D concentration. Therefore, if VDBP concentration is significantly altered, the measurement of bioavailable 25(OH)D concentration might facilitate the accurate determination of vitamin D status. However, GC genotyping might be unnecessary.
1. Introduction
Humans synthesize vitamin D in skin following exposure to sunlight. Vitamin D can also be obtained from diet. Vitamin D does not exhibit biological activity until a two-step hydroxylation occurs. Following hydroxylation in the liver to 25-hydroxy vitamin D (25(OH)D), the vitamin D metabolite is transported to kidneys where it is converted to 1α, 25-dihydroxyvitamin D (1α, 25(OH)2D) [1, 2]. Active forms of vitamin D exhibit varying function in tissues and organs throughout the body. Most (85%–90%) of the circulating vitamin D is tightly bound to vitamin D-binding protein (VDBP) and only a smaller amount (10%–15%) is loosely bound to albumin. Less than 1% of circulating vitamin D exists in free unbound form [3–5]. The fraction that is not bound to VDBP (free and albumin-bound) is considered bioavailable 25(OH)D [3].
Currently, vitamin D status is assessed via measurement of the total 25(OH)D concentrations. The commonly used criteria for vitamin D status are as follows: vitamin D deficiency (<20 ng/ml) and vitamin D insufficiency (20–30 ng/ml) [2, 6, 7]. However, a few studies have reported a stronger correlation between serum calcium, parathyroid hormone [3], bone mineral density [8], and vascular outcomes [9] with bioavailable 25(OH)D concentration compared with total 25(OH)D concentration, suggesting the clinical significance of bioavailable 25(OH)D concentration. However, other studies have failed to detect stronger associations between bioavailable 25(OH)D concentration and clinical outcomes [10]. Thus, the clinical utility of bioavailable 25(OH)D in the assessment of vitamin D status remains unclear.
The bioavailable 25(OH)D concentration is affected by serum VDBP concentration and GC genotype. The VDBP concentration is altered depending on various conditions. For example, VDBP is increased by up to 50% under elevated estrogen levels (e.g., pregnancy), whereas it is decreased in certain disease states (e.g., severe hepatic disease) [11–14]. The GC gene encoding VDBP exhibits more than 120 polymorphisms. Two single nucleotide polymorphisms (SNPs), rs7041 and rs4588, generate three major polymorphic isoforms of VDBP: Gc1f, Gc1s, and Gc2 [15, 16]. Because the affinity of VDBP for 25(OH)D depends on the polymorphic isoform, the GC genotype may also play a significant role in determining bioavailable 25(OH)D [13, 14, 17]. However, GC genotyping entails DNA extraction and PCR that are expensive, labor-intensive, and time-consuming procedures. To date, no published studies have evaluated the necessity or the impact of GC genotyping on bioavailable 25(OH)D in a Korean population.
Thus, the objectives of this study were (1) to determine whether calculation of bioavailable vitamin D might facilitate the assessment of vitamin D status in individuals with altered VDBP concentrations such as pregnant women and patients with liver cirrhosis (LC) and (2) evaluate whether GC genotyping might be essential for the determination of bioavailable 25(OH)D in Koreans.
2. Materials and Methods
2.1. Study Subjects
This prospective study enrolled a total of 136 subjects from March 2017 to March 2018, including 53 healthy individuals who underwent general medical check-ups without any symptoms, 45 patients with LC, and 38 pregnant women. In case of pregnant women, those with twins or triplets were excluded. Clinical and laboratory data including age, sex, albumin concentration, gestational age, and/or Child-Pugh class [18] were collected from electronic medical records. At the time of study enrollment, blood samples were collected and serum and leukocytes were separated and stored at -80°C. The study protocol was approved by the Institutional Review Board (IRB) of Gyeongsang National University Hospital (approval number: 2017-01-005). Written informed consent was obtained from all participants.
2.2. VDBP and Total 25(OH)D Assays
VDBP concentration was measured using an enzyme-linked immunosorbent assay (ELISA) kit (R&D Systems, Minneapolis, MN, USA) according to the manufacturer's protocol. Coefficients of variation (CVs) for three concentrations (10.9, 31.7, and 63.7 μg/ml) by intra- and interassay were 5.76.2% and 5.17.4%, respectively [19]. Total 25(OH)D concentration was measured using an Elecsys vitamin D total electrochemiluminescence binding assay (Roche Diagnostics, Mannheim, Germany) and a Cobas 8000 e602 analyzer (Roche Diagnostics). CVs for four concentrations (6.8, 15.0, 28.0, and 67.0 ng/ml) of intra- and interassay were 1.7-7.8% and 2.210.7%, respectively [20].
2.3. GC Genotyping
Genomic DNA was isolated from peripheral blood leukocytes using a DNeasy Blood and Tissue Kit (Qiagen, Hilden, Germany) according to the manufacturer's instructions. GC genotyping for rs7041 (NM_000583.3:c.1296T>G; NP_000574.2:p.Asp432Glu) and rs4588 (c.1307C>A; p.Thr436Lys) was performed using TaqMan SNP Genotyping Assay (Thermo Fisher Scientific, Waltham, MA, USA) and an ABI ViiA 7 Real-Time PCR System (Applied Biosystems, Foster City, CA, USA) according to the manufacturer's instructions. Common GC alleles were determined as follows: Gc1f (c.1296T; c.1307C), Gc1s (c.1296G; c.1307C), and Gc2 (c.1296T; c.1307A).
2.4. Calculation of Bioavailable 25(OH)D
Based on total 25(OH)D, VDBP, and albumin concentrations, bioavailable 25(OH)D concentrations were calculated using the following equations [17]:
| (1) |
To calculate genotype-specific bioavailable 25(OH)D concentrations, the variable K VDBP was replaced by genotype-specific VDBP binding affinity (K VDBP1f, 1.12 × 10⁹ M−1; K VDBP1s, 0.6 × 10⁹ M−1; and K VDBP2, 0.36 × 10⁹ M−1) [15]. For heterozygous genotypes, mean affinity for the two homozygotes was used (K VDBP1f/1s, 0.86 × 10⁹ M−1; K VDBP1f/2, 0.74 × 10⁹ M−1; and K VDBP1s/2, 0.48 × 10⁹ M−1) [21]. In this study, “bioavailable 25(OH)D” refers to both genotype-independent and genotype-specific bioavailable 25(OH)D.
2.5. Statistical Analysis
We compared clinical and laboratory data and GC genotypes between groups using the chi-square test for categorical variables and the Kruskal-Wallis test for continuous variables, with the Tukey test based on ranks as post hoc analysis. Patient characteristics (Child-Pugh class or trimester) were compared using the Mann–Whitney test or two-sample t-test. GC genotype and allele frequencies were compared between groups using the chi-square test or Fisher's exact test. Genotype-independent and genotype-specific bioavailable 25(OH)D concentrations were compared using the Wilcoxon signed-rank test. Percent difference between genotype-independent and genotype-specific bioavailable 25(OH)D was calculated as [genotype-specific bioavailable 25(OH)D − genotype-independent bioavailable 25(OH)D]/genotype-independent bioavailable 25(OH)D × 100. The relationship between continuous variables was evaluated by Spearman's correlation. Values were expressed as median and interquartile range (IQR). P < 0.05 was considered significant. All statistical analyses were performed using IBM SPSS Statistics version 21 (IBM Corp., Armonk, NY, USA).
3. Results
3.1. Subject Characteristics
Median age of subjects was 50 years (IQR, 40–60 years) for healthy controls, 52 years (IQR, 46–62 years) for patients with LC, and 33 years (IQR, 32–36 years) for pregnant women. The proportion of women was 35.8% in the control group and 17.8% in the LC group. Albumin concentration was significantly lower in patients with LC (2.9 g/dl) than that in healthy controls (4.5 g/dl) and pregnant women (3.6 g/dl; both P < 0.001). Of the 45 patients with LC, 4 patients were Child-Pugh class A, 26 patients were class B, and 15 patients were class C. Of the 38 pregnant women, 2 were in the first trimester, 4 were in the second trimester, and 32 were in the third trimester (Table 1).
Table 1.
Subject characteristics.
| Healthy controls (N = 53) | Patients with LC (N = 45) | Pregnant women (N = 38) | P value | |
|---|---|---|---|---|
| Age (yr) | 50 (40-60) | 52 (46-62) | 33 (32-36) | <0.001 |
| Female (N) | 19 (35.8%) | 8 (17.8%) | 38 (100%) | <0.001 |
| Albumin (g/dl) | 4.5 (4.4-4.7) | 2.9 (2.2-3.3) | 3.6 (3.5-3.8) | <0.001 |
| Child-Pugh class (N) | ||||
| A | 4 (8.9%) | |||
| B | 26 (57.8%) | |||
| C | 15 (33.3%) | |||
| Trimester (N) | ||||
| First | 2 (5.3%) | |||
| Second | 4 (10.5%) | |||
| Third | 32 (84.2%) |
Values are presented with median (interquartile range) or number (percentage). yr: year; LC: liver cirrhosis.
3.2. VDBP, Total 25(OH)D, and Bioavailable 25(OH)D Concentrations according to Medical Status
Circulating VDBP concentration was the highest in pregnant women (368.9 μg/ml), followed by that in healthy controls (165.2 μg/ml) and patients with LC (76.9 μg/ml; all P < 0.001) (Table 2 and Figure 1(a)). Total 25(OH)D concentrations were similar between healthy controls and pregnant women (18.5 ng/ml (IQR, 14.2–23.9 ng/ml) vs. 17.7 (IQR, 11.4–22.7 ng/ml); P = 0.394). In contrast, total 25(OH)D concentrations were significantly lower in patients with LC (10.5 ng/ml (IQR, 7.1–15.4 ng/ml)) than those in other groups (P < 0.001) (Table 2 and Figure 1(b)). When genotype was not taken into account, bioavailable 25(OH)D concentration was 3.0 ng/ml in healthy controls, 2.4 ng/ml in patients with LC, and 1.2 ng/ml in pregnant women. Its concentrations were significantly lower in patients with LC and pregnant women compared to that in controls (P < 0.05) (Table 2 and Figure 2).
Table 2.
VDBP, total 25(OH)D, and genotype-independent bioavailable 25(OH)D concentrations according to medical status.
| Healthy controls (N = 53) | Patients with LC (N = 45) | Pregnant women (N = 38) | P value | |
|---|---|---|---|---|
| VDBP (μg/ml) | 165.2 (140.5-191.6) | 76.9 (49.8-101.4) | 368.9 (313.8-407.6) | <0.001 |
| Total 25(OH)D (ng/ml) | 18.5 (14.2-23.9) | 10.5 (7.1-15.4) | 17.7 (11.4-22.7) | <0.001 |
| Genotype-independent bioavailable 25(OH)D (ng/ml) | 3.0 (2.6-4.3) | 2.4 (1.4-3.9) | 1.2 (0.8-1.7) | <0.001 |
Values are presented with median (interquartile range). LC: liver cirrhosis; VDBP: vitamin D-binding protein; 25(OH)D: 25-hydroxy vitamin D.
Figure 1.

Box plots comparing (a) VDBP and (b) total 25(OH)D concentrations according to medical status. LC: liver cirrhosis; VDBP: vitamin D-binding protein; 25(OH)D: 25-hydroxy vitamin D.
Figure 2.
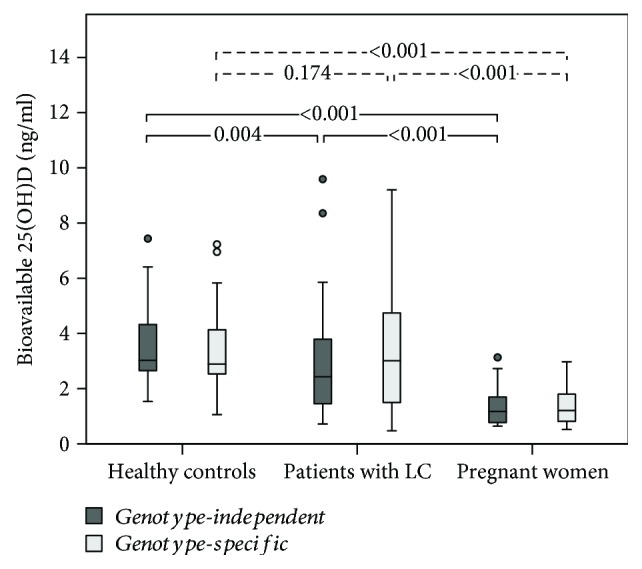
Box plots comparing genotype-independent and genotype-specific bioavailable 25(OH)D concentrations according to medical status. Genotype-independent and genotype-specific bioavailable 25(OH)D concentrations did not differ significantly for healthy controls, patients with LC, or pregnant women (all P > 0.05). LC: liver cirrhosis; VDBP: vitamin D-binding protein; 25(OH)D: 25-hydroxy vitamin D.
3.3. Genotype-Independent and Genotype-Specific Bioavailable 25(OH)D Concentrations
Genotype-independent bioavailable 25(OH)D concentration did not differ significantly from genotype-specific bioavailable 25(OH)D for the three groups combined (2.4 vs. 2.5 ng/ml; P = 0.299) or for healthy controls (3.0 vs. 2.9 ng/ml; P = 0.073), patients with LC (2.4 vs. 3.0 ng/ml; P = 0.077), or pregnant women (1.2 vs. 1.2 ng/ml; P = 0.058) (Table 3 and Figure 2). Mean percent difference between genotype-specific bioavailable 25(OH)D concentration and genotype-independent bioavailable 25(OH)D was -0.9%, 8.4%, and -0.5% in controls, patients with LC, and pregnant women, respectively. Although total 25(OH)D concentration did not correlate with VDBP concentration in any of these groups (all P > 0.05) (Supplementary Table 1), total 25(OH)D concentration was significantly correlated with bioavailable 25(OH)D concentration in all groups. Moreover, the correlation between total 25(OH)D and genotype-independent bioavailable 25(OH)D was stronger than the correlation between total 25(OH)D and genotype-specific bioavailable 25(OH)D for each group (controls, r = 0.841 vs. r = 0.548; patients with LC, r = 0.808 vs. r = 0.703; and pregnant women, r = 0.888 vs. r = 0.643) (Supplementary Table 1).
Table 3.
Comparison of genotype-independent and genotype-specific bioavailable 25(OH)D concentrations according to medical status.
| Genotype-independent bioavailable 25(OH)D (ng/ml) | Genotype-specific bioavailable 25(OH)D (ng/ml) | Mean percent difference between genotype-independent and genotype-specific bioavailable 25(OH)D | P value | |
|---|---|---|---|---|
| Total subjects (N = 136) | 2.4 (1.4-3.6) | 2.5 (1.3-3.8) | 2.3% | 0.299 |
| Healthy controls (N = 53) | 3.0 (2.6-4.3) | 2.9 (2.5-4.2) | -0.9% | 0.073 |
| Patients with LC (N = 45) | 2.4 (1.4-3.9) | 3.0 (1.5-4.8) | 8.4% | 0.077 |
| Pregnant women (N = 38) | 1.2 (0.8-1.7) | 1.2 (0.8-1.8) | -0.5% | 0.058 |
Values are presented with median (interquartile range). LC: liver cirrhosis; 25(OH)D: 25-hydroxy vitamin D.
3.4. VDBP, Total 25(OH)D, and Bioavailable 25(OH)D Concentrations according to Child-Pugh Class (Patients with LC) and Trimester (Pregnant Women)
In patients with LC, VDBP concentrations were significantly lower in patients with Child-Pugh class C than those in patients with Child-Pugh class A and B (45.3 vs. 91.6 μg/ml; P < 0.001). However, total and bioavailable 25(OH)D concentrations did not differ significantly between these subgroups (Table 4(a)). In pregnant women, VDBP, total 25(OH)D, and bioavailable 25(OH)D concentrations in women in the first or second trimester did not differ significantly from those in women in the third trimester (Table 4(b)).
3.5. GC Genotype and Allele Frequencies and Serum Concentrations of VDBP, Total 25(OH)D, and Bioavailable 25(OH)D according to GC Genotype
The most common genotype in the three groups combined was Gc1f/Gc2 (36.0%), followed by Gc1f/Gc1s (18.4%), Gc1s/Gc2 (16.9%), Gc1f/Gc1f (14.7%), Gc2/Gc2 (8.8%), and Gc1s/Gc1s (5.1%) (Table 5). Gc1f/Gc2 was the most common genotype in healthy controls (34.0%) and pregnant women (47.4%), whereas Gc1s/Gc2 was the most common genotype in patients with LC (31.1%). In patients with LC, Gc1f/Gc1s was less common while Gc1s/Gc2 was more common compared to controls. In the three groups combined, frequencies of Gc1f, Gc1s, and Gc2 were 41.9%, 22.8%, and 35.3%, respectively. The allele Gc1f was the most common in controls (46.2%) and pregnant women (44.7%) while Gc2 was the most common in patients with LC (41.1%). However, VDBP, total 25(OH)D, and genotype-independent bioavailable 25(OH)D concentrations did not differ significantly according to GC genotype in healthy controls (Supplementary Table 2).
Table 5.
Major GC genotype and allele frequencies.
| Healthy controls (N = 53) | Patients with LC (N = 45) | P valuea | Pregnant women (N = 38) | P valueb | Total (N = 136) | |
|---|---|---|---|---|---|---|
| Genotype frequencies | ||||||
| Gc1f/Gc1f | 9 (17.0%) | 7 (15.6%) | 0.849 | 4 (10.5%) | 0.386 | 20 (14.7%) |
| Gc1f/Gc1s | 13 (24.5%) | 4 (8.9%) | 0.042 | 8 (21.1%) | 0.698 | 25 (18.4%) |
| Gc1f/Gc2 | 18 (34.0%) | 13 (28.9%) | 0.590 | 18 (47.4%) | 0.197 | 49 (36.0%) |
| Gc1s/Gc1s | 3 (5.7%) | 2 (4.4%) | 1.000 | 2 (5.3%) | 1.000 | 7 (5.1%) |
| Gc1s/Gc2 | 5 (9.4%) | 14 (31.1%) | 0.007 | 4 (10.5%) | 1.000 | 23 (16.9%) |
| Gc2/Gc2 | 5 (9.4%) | 5 (11.1%) | 1.000 | 2 (5.3%) | 0.695 | 12 (8.8%) |
| Allele frequencies | ||||||
| Gc1f | 49 (46.2%) | 31 (34.4%) | 0.094 | 34 (44.7%) | 0.842 | 114 (41.9%) |
| Gc1s | 24 (22.6%) | 22 (24.4%) | 0.767 | 16 (21.1%) | 0.799 | 62 (22.8%) |
| Gc2 | 33 (31.1%) | 37 (41.1%) | 0.146 | 26 (34.2%) | 0.662 | 96 (35.3%) |
In apatients with LC and bpregnant women, genotype and allele frequencies were compared with the healthy controls. LC: liver cirrhosis.
4. Discussion
In our study, the highest levels of serum VDBP concentrations were recorded in pregnant women and the lowest values were found in patients with LC as expected. The total 25(OH)D and genotype-independent bioavailable 25(OH)D concentrations were lower in patients with LC compared with those in healthy controls (P < 0.001 for both). This finding is consistent with previous studies reporting a high prevalence of total 25(OH)D deficiency in patients with chronic liver disease [14, 22–25]. The result could be attributed to hepatic dysfunction (e.g., liver cirrhosis) and lifestyle of chronic patients. In other words, impaired 25-hydroxylation of vitamin D and hepatic VDBP synthesis, decreased outdoor activity, low dietary intake of vitamin D, and poor absorption lead to low total 25(OH)D concentrations [26–28]. Despite the low levels of total 25(OH)D concentrations in patients with chronic liver disease, free 25(OH)D concentrations have been reported to be normal or increased in such patients compared with controls [14, 22, 24, 25]. However, little is known about bioavailable 25(OH)D in patients with liver cirrhosis.
Although the total 25(OH)D concentrations in pregnant women were similar to those in healthy controls in our study, their bioavailable 25(OH)D concentrations were significantly lower than in controls. Previous studies evaluating free or bioavailable 25(OH)D concentrations in pregnant women have yielded discrepant results. For example, Schwartz et al. [14, 25] have found no significant difference in total or free 25(OH)D concentrations between pregnant women and healthy controls. However, Kim et al. [29] have reported that bioavailable 25(OH)D concentrations were significantly lower in pregnant women (1.9 vs. 2.6 ng/ml; P = 0.003), although the total 25(OH)D concentrations were comparable between pregnant women and healthy controls (18.3 vs. 18.3 ng/ml; P = 0.808), similar to our results. Most previous studies assessing bioavailable vitamin D in pregnant women have enrolled Caucasian and African-American participants. The vitamin D status of ethnic minorities has been less studied [30], and few studies have enrolled Korean participants. Thus, differences in ethnicity may account for these discrepant results, which may be attributed to the effect of genetic polymorphisms in vitamin D metabolism and transport [30]. Our results imply that bioavailable 25(OH)D might reflect vitamin D status more accurately than the total 25(OH)D, especially in pregnant women. Thus, measurement of the bioavailable 25(OH)D levels may be essential to accurately assess vitamin D status, at least in pregnant Korean women. Ethnicity and pregnancy-specific vitamin D status need to be further evaluated.
The use of GC genotype-specific VDBP binding affinity values to calculate the bioavailable 25(OH)D was expected to reveal the differences between genotype-independent and genotype-specific values. Arnaud and Constans [15] have reported different VDBP affinities for total 25(OH)D according to the GC genotype. The affinity of Gc1f was fourfold higher than that of Gc2 and twofold higher than that of Gc1s. However, in our study, the genotype-independent and genotype-specific bioavailable 25(OH)D concentrations did not differ significantly. In patients with LC, genotype-independent bioavailable 25(OH)D concentrations appeared to be lower than genotype-specific 25(OH)D concentrations (2.4 vs. 3.0 ng/ml), although the difference was not significant (P = 0.077). Our results indicate that the GC genotype has a limited effect on the calculated value of bioavailable 25(OH)D. In addition, we found that the correlation between total and genotype-independent bioavailable 25(OH)D concentrations was higher than the correlation between total and genotype-specific bioavailable 25(OH)D concentrations.
The minimal impact of GC genotype on the calculated bioavailable 25(OH)D concentration might be explained by the distribution of GC alleles in subjects enrolled in this study. To calculate genotype-independent bioavailable 25(OH)D, we used the binding affinity constant of VDBP (K VDBP), which represents the average affinity constant of three isoforms. In our study, the frequency of GC alleles in all subjects was 41.9% for Gc1f, 35.3% for Gc2, and 22.8% for Gc1s, which showed relatively even distribution, which may explain the lack of significant difference between genotype-independent bioavailable 25(OH)D calculated using the average K VDBP and genotype-specific bioavailable 25(OH)D calculated using genotype-specific K VDBP. In other words, the even distribution of GC allele in the present study might arithmetically compensate the effect of genotype-specific K VDBP on the calculation of bioavailable 25(OH)D. In fact, a previous study [31] of 360 Korean subjects has reported that the allele frequencies of Gc1f, Gc1s, and Gc2 were 44%, 25%, and 31%, respectively, which were similar to our results. Thus, although our study included a relatively small number of subjects, our results suggesting a limited effect of the GC genotype on bioavailable 25(OH)D value may still be meaningful. However, further studies enrolling larger numbers of Korean subjects are needed to corroborate these results.
In our study, patients with severe hepatic dysfunction (Child-Pugh class C) had lower VDBP concentrations than patients with Child-Pugh class A and B (45.3 vs. 91.6 μg/ml; P < 0.001). The total 25(OH)D appeared to be lower in patients with Child-Pugh class C, but not significant (8.6 vs. 11.7 ng/ml; P = 0.057). Bioavailable 25(OH)D concentrations did not differ between groups (all P > 0.05), indicating similar total and bioavailable 25(OH)D concentrations despite differences in hepatic dysfunction. Arteh et al. [23] have shown that severe total 25(OH)D deficiency is more common in patients diagnosed with LC than in patients with noncirrhotic liver disease. Lai et al. [24] have reported that in patients with LC, those with low albumin concentrations also carry lower concentrations of VDBP, total 25(OH)D, and free 25(OH)D than patients with normal albumin concentrations.
The analysis of VDBP, total 25(OH)D, and bioavailable 25(OH)D concentrations in pregnant women showed no significant differences according to the trimester. However, only two women in the first trimester were enrolled in our study. Therefore, we only compared the two groups (first and second trimesters vs. third trimester). Ma et al. demonstrated that VDBP, 1α-hydroxylase, 24-hydroxylase, and vitamin D receptor were expressed on the placenta [32], and Cleal et al. showed that maternal 25(OH)D and VDBP concentrations may mediate the regulation of amino acid transfer to the fetus [33], suggesting that dysregulation of VDBP as well as vitamin D could be a risk factor in the pregnancy outcome (i.e., preeclampsia, preterm birth, and gestational diabetes) [34]. Further studies are needed to analyze the VDBP, total 25(OH)D, and bioavailable 25(OH)D concentrations in pregnant women according to the trimester and pregnancy outcome.
The major GC genotype and allele frequencies are known to vary among ethnicities [16]. For example, Nielson et al. [35] have reported that nearly all African-American subjects and all Gambian subjects carry the Gc1f allele (Gc1f/Gc1f, Gc1f/Gc1s, or Gc1f/Gc2). In contrast, most white subjects did not harbor the Gc1f allele while Gc1s/Gc1s and Gc1s/Gc2 were the most frequent genotypes in this group. Koreans carry different GC allele frequencies than African-Americans or whites. Jung et al. [31] have enrolled 203 patients with chronic obstructive pulmonary disease and 157 control subjects and reported that Gc1f/Gc2 (25%) was the most frequent genotype, followed by Gc1f/Gc1f (22%), Gc1f/Gc1s (20%), and Gc1s/Gc2 (18%), similar to our results. Furthermore, we observed different GC genotype frequencies in patients with LC compared with healthy controls. The Gc1s/Gc2 genotype was more common in patients with LC than in controls (31.1% vs. 9.4%; P = 0.007), whereas Gc1f/Gc1s was less common (8.9% vs. 24.5%; P = 0.042).
Our study has a few limitations. First, we measured VDBP concentrations using monoclonal ELISA. Nielson et al. [35] have reported that VDBP concentrations measured with monoclonal ELISA are strongly correlated with GC genotypes. Therefore, this assay underestimated VDBP concentrations in African-Americans because of the high frequency of Gc1f. A study evaluating VDBP concentrations in Korean subjects by polyclonal ELISA may be necessary. Second, we have not used liquid chromatography-tandem mass spectrometry (LC-MS/MS) to measure the total 25(OH)D concentrations. However, in healthy controls, the measured total 25(OH)D concentration (18.5 ng/ml) was similar to that reported by a previous study (18.3 ng/ml) in Korea using LC-MS/MS [29]. Third, the small sample size limited our ability to determine the effect of GC genotype on VDBP concentrations and compare subgroups according to the Child-Pugh class in patients diagnosed with LC and trimester in pregnant women. Fourth, we have not investigated vitamin D supplementation or sun exposure. We have not considered seasonal variation either. Fifth, we failed to exclude subjects with other conditions (e.g., malnutrition, infection, and nephrotic syndrome) that could affect VDBP concentrations other than LC and pregnancy.
5. Conclusions
In this study, we demonstrated that bioavailable 25(OH)D levels reflect vitamin D status more accurately than the total 25(OH)D concentrations, especially in pregnant women. In addition, we have shown that the GC genotype did not significantly affect bioavailable 25(OH)D concentration in Koreans. Therefore, if the VDBP concentration is significantly altered, calculation of bioavailable 25(OH)D levels might facilitate the accurate determination of vitamin D status obviating the need for GC genotyping.
Table 4.
VDBP, total 25(OH)D, and genotype-independent and genotype-specific bioavailable 25(OH)D concentrations according to the (a) Child-Pugh class in patients with LC and (b) trimester in pregnant women.
(a) Patients with LC
| Child-Pugh class A and B (N = 30) | Child-Pugh class C (N = 15) | P value | |
|---|---|---|---|
| VDBP (μg/ml) | 91.6 (73.0-119.8) | 45.3 (33.4-52.6) | <0.001 |
| Total 25(OH)D (ng/ml) | 11.7 (8.2-17.7) | 8.6 (5.9-12.6) | 0.057 |
| Bioavailable 25(OH)D (ng/ml) | |||
| Genotype-independent | 2.4 (1.4-4.0) | 2.4 (1.2-3.6) | 0.866 |
| Genotype-specific | 2.9 (1.2-4.4) | 3.0 (1.5-4.9) | 0.413 |
(b) Pregnant women
| First and second trimester (N = 6) | Third trimester (N = 32) | P value | |
|---|---|---|---|
| VDBP (μg/ml) | 341.1 (260.8-386.5) | 371.1 (320.2-412.4) | 0.213 |
| Total 25(OH)D (ng/ml) | 18.2 (12.9-23.5) | 16.7 (11.3-23.2) | 0.653 |
| Bioavailable 25(OH)D (ng/ml) | |||
| Genotype-independent | 1.4 (1.1-2.1) | 1.1 (0.8-1.7) | 0.245 |
| Genotype-specific | 1.4 (1.0-2.0) | 1.0 (0.8-1.7) | 0.469 |
Values are presented with median (interquartile range). VDBP: vitamin D-binding protein; 25(OH)D: 25-hydroxy vitamin D; LC: liver cirrhosis.
Acknowledgments
This study was supported by a grant (No. 2018R1C1B5040593) of the National Research Foundation of Korea (NRF) grant funded by the Korea Government (MSIT). It was also supported by the Biomedical Research Institute fund (GNUHBRIF-2017-0006) from Gyeongsang National University Hospital.
Data Availability
The data used to support the findings of this study are available from the corresponding author upon request.
Conflicts of Interest
The authors declare that they have no conflicts of interest relevant to this study.
Supplementary Materials
The supplementary word file contains two supplementary tables described in the text to support our results. Supplementary Table 1: Spearman's correlation coefficient between total 25(OH)D, VDBP, and bioavailable 25(OH)D. Supplementary Table 2: VDBP, total 25(OH)D, and bioavailable 25(OH)D concentrations according to GC genotype in healthy controls.
References
- 1.DeLuca H. F. Overview of general physiologic features and functions of vitamin D. The American Journal of Clinical Nutrition. 2004;80(6):1689S–1696S. doi: 10.1093/ajcn/80.6.1689S. [DOI] [PubMed] [Google Scholar]
- 2.Holick M. F. Vitamin D deficiency. The New England Journal of Medicine. 2007;357(3):266–281. doi: 10.1056/NEJMra070553. [DOI] [PubMed] [Google Scholar]
- 3.Bhan I., Powe C. E., Berg A. H., et al. Bioavailable vitamin D is more tightly linked to mineral metabolism than total vitamin D in incident hemodialysis patients. Kidney International. 2012;82(1):84–89. doi: 10.1038/ki.2012.19. [DOI] [PMC free article] [PubMed] [Google Scholar]
- 4.Bikle D. D., Gee E., Halloran B., Kowalski M. A., Ryzen E., Haddad J. G. Assessment of the free fraction of 25-hydroxyvitamin D in serum and its regulation by albumin and the vitamin D-binding protein. The Journal of Clinical Endocrinology and Metabolism. 1986;63(4):954–959. doi: 10.1210/jcem-63-4-954. [DOI] [PubMed] [Google Scholar]
- 5.Bikle D. D., Siiteri P. K., Ryzen E., Haddad J. G., GEE E. Serum protein binding of 1, 25-dihydroxyvitamin D: a reevaluation by direct measurement of free metabolite levels. The Journal of Clinical Endocrinology and Metabolism. 1985;61(5):969–975. doi: 10.1210/jcem-61-5-969. [DOI] [PubMed] [Google Scholar]
- 6.Holick M. F. High prevalence of vitamin D inadequacy and implications for health. Mayo Clinic Proceedings. 2006;81(3):353–373. doi: 10.4065/81.3.353. [DOI] [PubMed] [Google Scholar]
- 7.Malabanan A., Veronikis I. E., Holick M. F. Redefining vitamin D insufficiency. The Lancet. 1998;351(9105):805–806. doi: 10.1016/S0140-6736(05)78933-9. [DOI] [PubMed] [Google Scholar]
- 8.Powe C. E., Ricciardi C., Berg A. H., et al. Vitamin D-binding protein modifies the vitamin D-bone mineral density relationship. Journal of Bone and Mineral Research. 2011;26(7):1609–1616. doi: 10.1002/jbmr.387. [DOI] [PMC free article] [PubMed] [Google Scholar]
- 9.Ashraf A. P., Alvarez J. A., Dudenbostel T., et al. Associations between vascular health indices and serum total, free and bioavailable 25-hydroxyvitamin D in adolescents. PLoS One. 2014;9(12, article e114689) doi: 10.1371/journal.pone.0114689. [DOI] [PMC free article] [PubMed] [Google Scholar]
- 10.Jemielita T. O., Leonard M. B., Baker J., et al. Association of 25-hydroxyvitamin D with areal and volumetric measures of bone mineral density and parathyroid hormone: impact of vitamin D-binding protein and its assays. Osteoporosis International. 2016;27(2):617–626. doi: 10.1007/s00198-015-3296-6. [DOI] [PMC free article] [PubMed] [Google Scholar]
- 11.Bhan I. Vitamin D binding protein and bone health. International Journal of Endocrinology. 2014;2014:5. doi: 10.1155/2014/561214.561214 [DOI] [PMC free article] [PubMed] [Google Scholar]
- 12.Chun R. F. New perspectives on the vitamin D binding protein. Cell Biochemistry and Function. 2012;30(6):445–456. doi: 10.1002/cbf.2835. [DOI] [PubMed] [Google Scholar]
- 13.Heijboer A. C., Blankenstein M. A., Kema I. P., Buijs M. M. Accuracy of 6 routine 25-hydroxyvitamin D assays: influence of vitamin D binding protein concentration. Clinical Chemistry. 2012;58(3):543–548. doi: 10.1373/clinchem.2011.176545. [DOI] [PubMed] [Google Scholar]
- 14.Schwartz J. B., Lai J., Lizaola B., et al. A comparison of measured and calculated free 25(OH) vitamin D levels in clinical populations. The Journal of Clinical Endocrinology and Metabolism. 2014;99(5):1631–1637. doi: 10.1210/jc.2013-3874. [DOI] [PMC free article] [PubMed] [Google Scholar]
- 15.Arnaud J., Constans J. Affinity differences for vitamin D metabolites associated with the genetic isoforms of the human serum carrier protein (DBP) Human Genetics. 1993;92(2) doi: 10.1007/bf00219689. [DOI] [PubMed] [Google Scholar]
- 16.Kamboh M. I., Ferrell R. E. Ethnic variation in vitamin D-binding protein (GC): a review of isoelectric focusing studies in human populations. Human Genetics. 1986;72(4):281–293. doi: 10.1007/BF00290950. [DOI] [PubMed] [Google Scholar]
- 17.Powe C. E., Evans M. K., Wenger J., et al. Vitamin D-binding protein and vitamin D status of black Americans and white Americans. The New England Journal of Medicine. 2013;369(21):1991–2000. doi: 10.1056/NEJMoa1306357. [DOI] [PMC free article] [PubMed] [Google Scholar]
- 18.Pugh R. N. H., Murray-Lyon I. M., Dawson J. L., Pietroni M. C., Williams R. Transection of the oesophagus for bleeding oesophageal varices. The British Journal of Surgery. 1973;60(8):646–649. doi: 10.1002/bjs.1800600817. [DOI] [PubMed] [Google Scholar]
- 19.R&D Systems, Inc. Human Vitamin D BP Quantikine® ELISA Reagent Insert. Minneapolis, MN, USA: 2017. [Google Scholar]
- 20.Roche Diagnostics. Elecsys Vitamin D Total Electrochemiluminescence Binding Assay Reagent Insert. Mannheim, Germany: 2017. [Google Scholar]
- 21.Song M., Konijeti G. G., Yuan C., et al. Plasma 25-hydroxyvitamin D, vitamin D binding protein, and risk of colorectal cancer in the nurses’ health study. Cancer Prevention Research. 2016;9(8):664–672. doi: 10.1158/1940-6207.CAPR-16-0053. [DOI] [PMC free article] [PubMed] [Google Scholar]
- 22.Bikle D. D., Halloran B. P., Gee E., Ryzen E., Haddad J. G. Free 25-hydroxyvitamin D levels are normal in subjects with liver disease and reduced total 25-hydroxyvitamin D levels. The Journal of Clinical Investigation. 1986;78(3):748–752. doi: 10.1172/JCI112636. [DOI] [PMC free article] [PubMed] [Google Scholar]
- 23.Arteh J., Narra S., Nair S. Prevalence of vitamin D deficiency in chronic liver disease. Digestive Diseases and Sciences. 2010;55(9):2624–2628. doi: 10.1007/s10620-009-1069-9. [DOI] [PubMed] [Google Scholar]
- 24.Lai J. C., Bikle D. D., Lizaola B., Hayssen H., Terrault N. A., Schwartz J. B. Total 25(OH) vitamin D, free 25(OH) vitamin D and markers of bone turnover in cirrhotics with and without synthetic dysfunction. Liver International. 2015;35(10):2294–2300. doi: 10.1111/liv.12819. [DOI] [PMC free article] [PubMed] [Google Scholar]
- 25.Schwartz J. B., Lai J., Lizaola B., et al. Variability in free 25(OH) vitamin D levels in clinical populations. The Journal of Steroid Biochemistry and Molecular Biology. 2014;144:156–158. doi: 10.1016/j.jsbmb.2013.11.006. [DOI] [PMC free article] [PubMed] [Google Scholar]
- 26.Hepner G. W., Roginsky M., Moo H. F. Abnormal vitamin D metabolism in patients with cirrhosis. The American Journal of Digestive Diseases. 1976;21(7):527–532. doi: 10.1007/BF01464758. [DOI] [PubMed] [Google Scholar]
- 27.Lim L. Y., Chalasani N. Vitamin D deficiency in patients with chronic liver disease and cirrhosis. Current Gastroenterology Reports. 2012;14(1):67–73. doi: 10.1007/s11894-011-0231-7. [DOI] [PubMed] [Google Scholar]
- 28.Tsuprykov O., Chen X., Hocher C. F., Skoblo R., Lianghong Yin, Hocher B. Why should we measure free 25(OH) vitamin D? The Journal of Steroid Biochemistry and Molecular Biology. 2018;180:87–104. doi: 10.1016/j.jsbmb.2017.11.014. [DOI] [PubMed] [Google Scholar]
- 29.Kim H. J., Ji M., Song J., Moon H. W., Hur M., Yun Y. M. Clinical utility of measurement of vitamin D-binding protein and calculation of bioavailable vitamin D in assessment of vitamin D status. Annals of Laboratory Medicine. 2017;37(1):34–38. doi: 10.3343/alm.2017.37.1.34. [DOI] [PMC free article] [PubMed] [Google Scholar]
- 30.O'Callaghan K. M., Kiely M. E. Ethnic disparities in the dietary requirement for vitamin D during pregnancy: considerations for nutrition policy and research. The Proceedings of the Nutrition Society. 2018;77(02):164–173. doi: 10.1017/S0029665117004116. [DOI] [PubMed] [Google Scholar]
- 31.Jung J. Y., Choi D. P., Won S., et al. Relationship of vitamin D binding protein polymorphisms and lung function in Korean chronic obstructive pulmonary disease. Yonsei Medical Journal. 2014;55(5):1318–1325. doi: 10.3349/ymj.2014.55.5.1318. [DOI] [PMC free article] [PubMed] [Google Scholar]
- 32.Ma R., Gu Y., Zhao S., Sun J., Groome L. J., Wang Y. Expressions of vitamin D metabolic components VDBP, CYP2R1, CYP27B1, CYP24A1, and VDR in placentas from normal and preeclamptic pregnancies. American Journal of Physiology. Endocrinology and Metabolism. 2012;303(7):E928–E935. doi: 10.1152/ajpendo.00279.2012. [DOI] [PMC free article] [PubMed] [Google Scholar]
- 33.Cleal J. K., Day P. E., Simner C. L., et al. Placental amino acid transport may be regulated by maternal vitamin D and vitamin D-binding protein: results from the Southampton Women’s Survey. The British Journal of Nutrition. 2015;113(12):1903–1910. doi: 10.1017/S0007114515001178. [DOI] [PMC free article] [PubMed] [Google Scholar]
- 34.Karras S. N., Koufakis T., Fakhoury H., Kotsa K. Deconvoluting the biological roles of vitamin D-binding protein during pregnancy: a both clinical and theoretical challenge. Frontiers in Endocrinology. 2018;9:p. 259. doi: 10.3389/fendo.2018.00259. [DOI] [PMC free article] [PubMed] [Google Scholar]
- 35.Nielson C. M., Jones K. S., Chun R. F., et al. Free 25-hydroxyvitamin D: impact of vitamin D binding protein assays on racial-genotypic associations. The Journal of Clinical Endocrinology and Metabolism. 2016;101(5):2226–2234. doi: 10.1210/jc.2016-1104. [DOI] [PMC free article] [PubMed] [Google Scholar]
Associated Data
This section collects any data citations, data availability statements, or supplementary materials included in this article.
Supplementary Materials
The supplementary word file contains two supplementary tables described in the text to support our results. Supplementary Table 1: Spearman's correlation coefficient between total 25(OH)D, VDBP, and bioavailable 25(OH)D. Supplementary Table 2: VDBP, total 25(OH)D, and bioavailable 25(OH)D concentrations according to GC genotype in healthy controls.
Data Availability Statement
The data used to support the findings of this study are available from the corresponding author upon request.