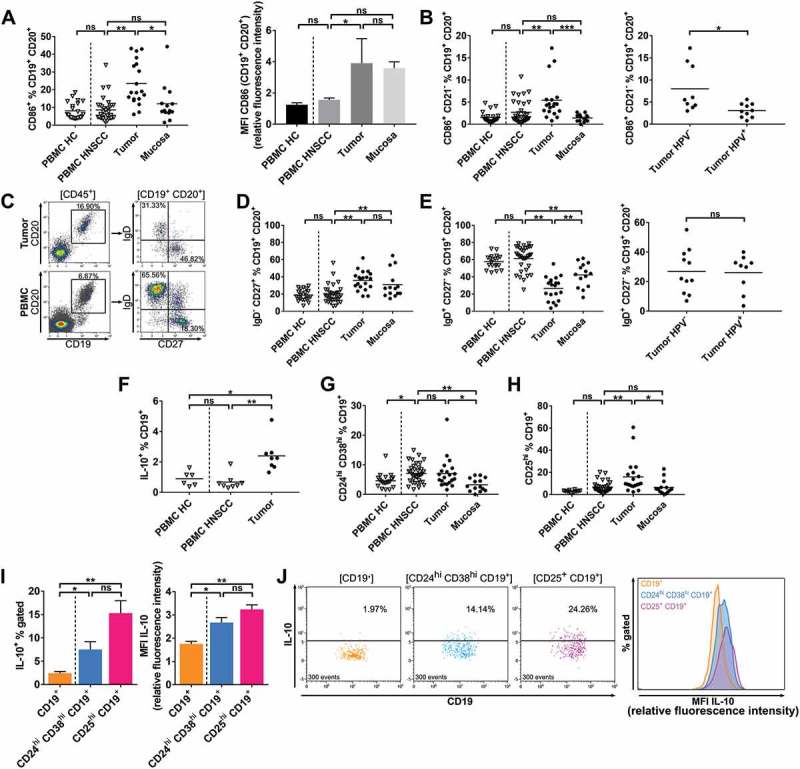
Figure 2.

Phenotypes of B cell subsets in different compartments of HPV± HNSCC patients and healthy controls.
Single cell suspensions from HNSCC tumor tissue (n = 38), non-cancerous mucosa (n = 14), PBMCs from HNSCC patients (PBMC HNSCC, n = 38) and healthy controls (PBMC HC, n = 20) were analyzed by flow cytometry regarding B cell related surface and cytoplasmic antigens. (A) The percentage of CD86+ B cells is shown in scatter plots (left). Bar graphs demonstrate the median fluorescence intensity (MFI) of CD86 on B cells in different compartments (mean ± standard error of the mean). (B) Scatter plots comparing the percentages of CD86+/CD21− antigen-presenting B cells in different compartments (left) and in tumor stratified according to HPV status (right). (C) Exemplary histogram and dot plots from a single HNSCC patient demonstrate frequencies of cell populations defined by IgD and CD27 surface expression in tumor microenvironment and PBMC. (D) Percentages of memory B cell phenotype IgD−/CD27+ within the B cell fraction are shown in scatter plots. (E) Naïve B cell phenotype IgD+/CD27− percentages in different compartments are depicted in a scatter plot (left), fractions in the TME of HNSCC are stratified according to HPV association and displayed in a scatter plot (right). (F) Percentages of regulatory IL-10+ B cells in PBMC HC (n = 6), PBMC HNSCC (n = 8) and TME of HNSCC (n = 8) are shown. (G) Scatter plots demonstrate frequencies of regulatory B cell phenotype CD24hi/CD38hi. (H) Proportions of CD25hi B cells are shown in a scatter plot in different compartments. (I) Percentages of IL-10+ cells within CD19+ B cells and regulatory phenotypes CD24hi/CD38hi/CD19+ and CD25hi/CD19+ in the TME of HNSCC (left) and respective IL-10 median fluorescence intensity of CD19+, CD24hi/CD38hi/CD19+ and CD25hi/CD19+ populations (right) are shown. B cells derived from the TME of HNSCC (n = 8) were analyzed. MFI values are displayed as relative fluorescence intensities and are only comparable with values obtained in the same experiment. (J) Exemplary flow cytometry data of a single HNSCC is shown. Dot plots on the left display percentages of IL-10+ subpopulations of CD19+ B cells and regulatory phenotypes CD24hi/CD38hi/CD19+ and CD25hi/CD19+ corresponding to data in left plot of (I). IL-10 fluorescence intensity of these populations is shown in an overlay histogram (right) corresponding to data displayed in the right graph of (I). 300 events are displayed in every dot plot on the left. For statistical analysis, Kruskal-Wallis test was performed in (A), left plot of (B) and (E), (D), (F) – (I), Mann-Whitney test in right plot of (B) and t test in right plot of (E). Data is presented as mean (± standard error of the mean in right plot of (A) and in (I)). *P < 0.05; **P < 0.005; ns, not significant.
