

ABSTRACT
Gamma delta (γδ) T-cell based immunotherapy is a promising concept for the treatment of hematologic malignancies. Not only in vitro but also in early phase clinical trials, zoledronic acid (Zol) and interleukin-2 (IL-2) have been successfully used to activate human γδ T-cells and to induce clinical anti-tumor effects. Aiming to improve the effectiveness of future γδ T-cell based immunotherapies against leukemia, we analyzed the impact of programmed cell death protein 1 (PD-1) signaling, on the different phases of γδ T-cell activation, of proliferation, production of anti-tumor cytokines and cytotoxic function in vitro.
PD-1 expression was found significantly upregulated between day 2 and day 4 following stimulation with Zol and IL-2. However, proliferation or expression of activation markers of γδ, αβ and NK-cells are not altered by additional PD-1 blockade. Pembrolizumab increases interferon-γ (IFN-γ) production in γδ T-cells upon direct stimulation with Zol and in response to Zol treated primary acute myeloid leukemia (AML) cells by approximately 57% and 30%, respectively. Zol sensitized primary AML cells also induce PD-1 expression in co-cultured γδ T-cells and such PD-1(+) cells contain more IFN-γ. In contrast, PD-1 blockade does not have a significant effect on direct cell dependent lysis of leukemia cells by γδ T-cells.
This study demonstrates that PD-1 blockade impacts cell dependent cytotoxicity and cytokine production in response to leukemia cells differently. While Pembrolizumab did not increase cell lysis of stimulated and expanded γδ T-cells, it induces significant upregulation of the potent pro-inflammatory and anti-tumor cytokine IFN-γ, which might facilitate anti-leukemia effects.
KEYWORDS: PD-1, leukemia, gamma delta, T-cell, AML, zoledronic acid, IL-2, Pembrolizumab
Introduction
Despite considerable progress in treating hematological malignancies, innovative anti-cancer strategies are still warranted for acute myeloid leukemia (AML). The current clinical protocols are toxic and AML retains a high treatment and disease associated mortality, especially in the elderly.1 In this regard, enhancement of the potent anti-cancer mechanisms of γδ T-cells is a promising experimental concept for patients with hematological malignancies. Unconventional target sensing capabilities, strong anti-tumor effector mechanisms and a lack of graft versus-host reactivity, make γδ T-cell based strategies an attractive alternative type of cancer immunotherapy. Specific antigen receptor characteristic enable γδ T-cells to recognize alterations in expression or structural changes of evolutionary conserved self-molecules on a variety of target cells they might encounter. Some of these molecules become altered during cellular stress, infection and malignant transformation and induce activation and effector responses by γδ T-cells. Several studies indicate that γδ T-cells infiltration of different types of cancers inhibits tumor growth, metastasis and positively impacts prognosis. Especially the most abundant subset of γδ T-cells in the human blood, the Vγ9Vδ2 T-cells exhibit broad tumor specific cytotoxic function in vitro, in animal models and had beneficial clinical effects, particular in patients with hematological malignancies. Despite all these promising findings, the therapeutic efficacy of previous clinical protocols was only modest.2
Recently, the therapeutic blockade of immune-checkpoint molecules proved beneficial in several types of cancer, especially in melanoma, non-small cell lung cancer and Hodgkin´s lymphoma. However, it remains uncertain which patient or disease specific factor determine clinical efficacy and neither PD-1, programmed cell death ligand (PD-L) 1, nor cytotoxic T-lymphocyte-associated protein 4 (CTLA-4) blockade demonstrated relevant anti-leukemia activity so far.3 PD-1 as a key inhibitory receptor on immune cells, controls inflammation and induces immunosuppression in cancer.4 Checkpoint inhibitor therapy was found to stimulate T-cell activation and function, but little is known regarding its impact on γδ T-cells anti-leukemia activity. In theory, γδ T-cells effects against cancer might be limited by the PD-1 signaling and therefore combining therapeutic PD-1/PD-L1 blockade with γδ T-cell therapy could prove beneficial and overcome resistance against each individual treatment strategy. It is also interesting that the known PD-Ls are members of the B7 family of proteins and therefore related to butyrophilin-3 (BTN3 or CD277), an essential protein for activation of Vγ9Vδ2 T-cells, via direct and indirect stimulation by phosphoantigens (PAg).2 It has been previously demonstrated that γδ T-cells express PD-1 molecules,5 which may control proliferation6 and the production of anti-tumor cytokines.7 Beside this, the physiological implications of inhibitory receptors, especially PD-1/PD-Ls for γδ T-cells biology are not well defined. Therefore, in this study we investigated the impact of the PD-1/PD-L axis on the different phases of γδ- T cell activation, proliferation, as well as the production of anti-tumor cytokines and cytotoxic function against leukemia.
Results
PD-1 expression by immune cells
First we examined the kinetics of PD-1 and the PD-1 ligands (PD-L1/2) expressed by γδ T-cells, αβ T-cells and NK-cells derived from human peripheral blood. Isolated peripheral blood mononuclear cells (PBMC) were cultured and either left unstimulated or treated with IL-2, Zol or Zol + IL-2. In the analyzed populations, PD-1 on γδ T-cells and αβ T-cells and PD-L1 on γδ T-cells depicted a recognizable time and stimulation dependent alteration in expression pattern (Figure 1). NK cells did not demonstrate any significant change in expression of PD-1 or PD-L1 during culture and PD-L2 was not expressed on any of the examined immune cell subsets (Figure S1). Stimulation with Zol and even more pronounced with Zol + IL-2 induced an increase in PD-1 expression between day 2 and day 4 on γδ T-cells. Sole IL-2 stimulation induced a significant increase in PD-1 expression on αβ T-cells between day 7 and day 9, compared to unstimulated control. This was also implied for γδ T-cells but did not reach a statistical significant level. Both γδ T-cells and αβ T-cells depicted a slow but continuous rise in PD-1 levels during unstimulated culture over time. Treatment with Zol or Zol and IL-2 inhibited this upregulation in αβ T-cells, but not in γδ T-cells. Analyzing the data according to the fraction of PD-1(+) cells instead of ΔMFI resulted in very similar depiction (Figure 1(a)). In contrast, there were no discernible changes according to PD-L1 ΔMFI but a significant increase in the fraction of PD-L1(+) γδ T-cell between day 2 and day 4 in Zol + IL-2 stimulated PBMC and on day 2 in sole Zol stimulated cells (Figure 1(b)).
Figure 1.
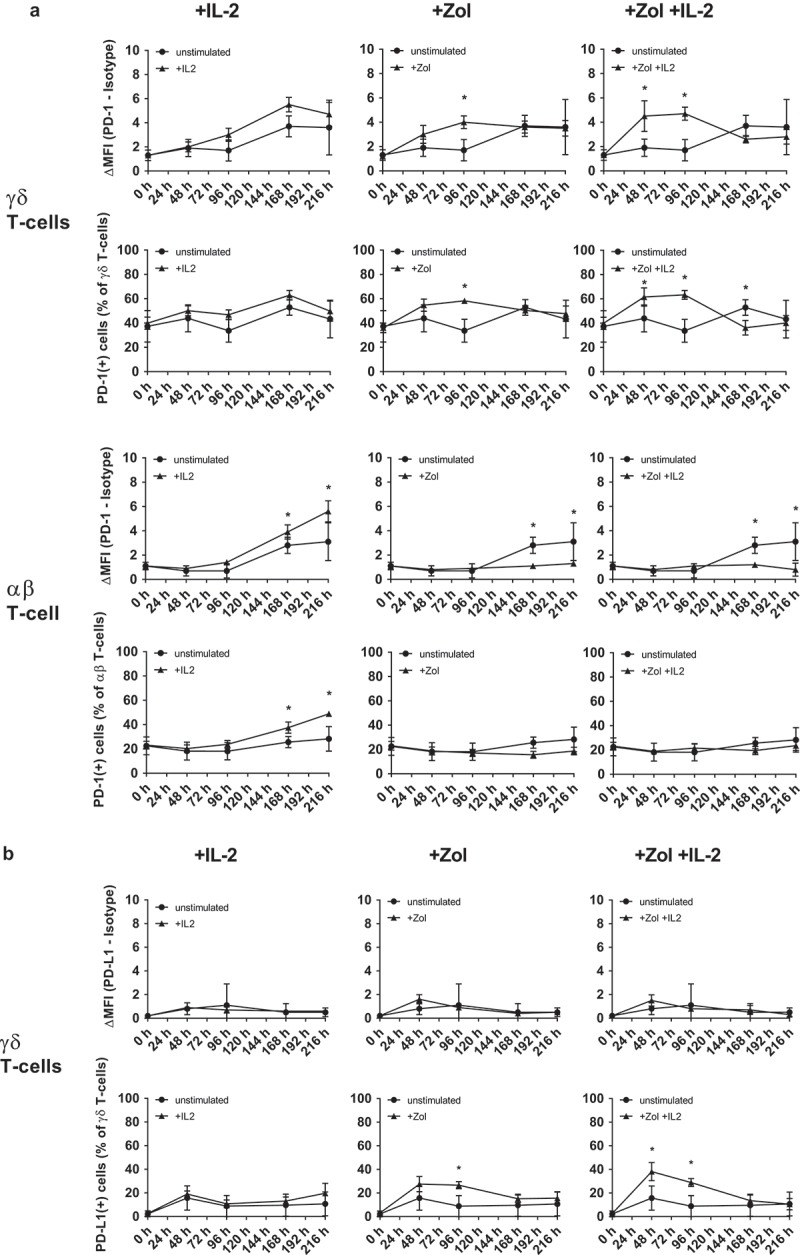
Changes in PD-1 receptor and ligand expression following stimulation. Flow cytometry analysis of (a) PD-1 (CD279) expression on 1) IL-2, 2) Zol and 3) Zol+ IL-2 stimulated PBMC compared to unstimulated PBMC and gated on γδ T-cells or αβ T-cells. (b) PD-L1 (CD274) expression on 1) IL-2, 2) Zol and 3) Zol+ IL-2 stimulated PBMC compared to unstimulated PBMC and gated on γδ T-cells. Data of 5 independent experiments are presented as mean of the Δ-MFI [(MFI(PD-1/-L1) minus MFI(isotype)] ± SEM (upper row) or as fraction of PD-1/-L1 positive cells (lower row) in the respective subset, * = P < .05 compared to unstimulated control.
Cell proliferation and expression of activation markers
Zol strongly and specifically stimulates PAg sensing Vγ9Vδ2 T-cells and IL-2 is an important growth, survival and activation factor for T-cells and NK-cells.2,8 As we found PD-1 upregulated during Zol and IL-2 stimulation by γδ T-cells and αβ T-cells, we measured the effects of additional treatment with Pembrolizumab on immune cell proliferation and the expression of activation markers under different stimulatory conditions. We observed only a trend towards higher proliferation in Zol stimulated PBMC with additional Pembrolizumab compared to isotype control but no statistically significant difference (Figure 2). Analyzing stimulation dependent changes in the expression of the activation markers CD69 and HLA-DR by γδ T-cells, we found that both become upregulated by IL2, Zol and Zol + IL-2 compared to unstimulated control. Pembrolizumab compared to isotype treatment does not alter the expression of activation markers on γδ T-cells (Figure 3), αβ T-cells or NK-cells (Figure S2) under any of the used stimulatory conditions. Viability of PBMC was consistently > 92% and not changed by stimulation or antibody treatment (data not shown).
Figure 2.
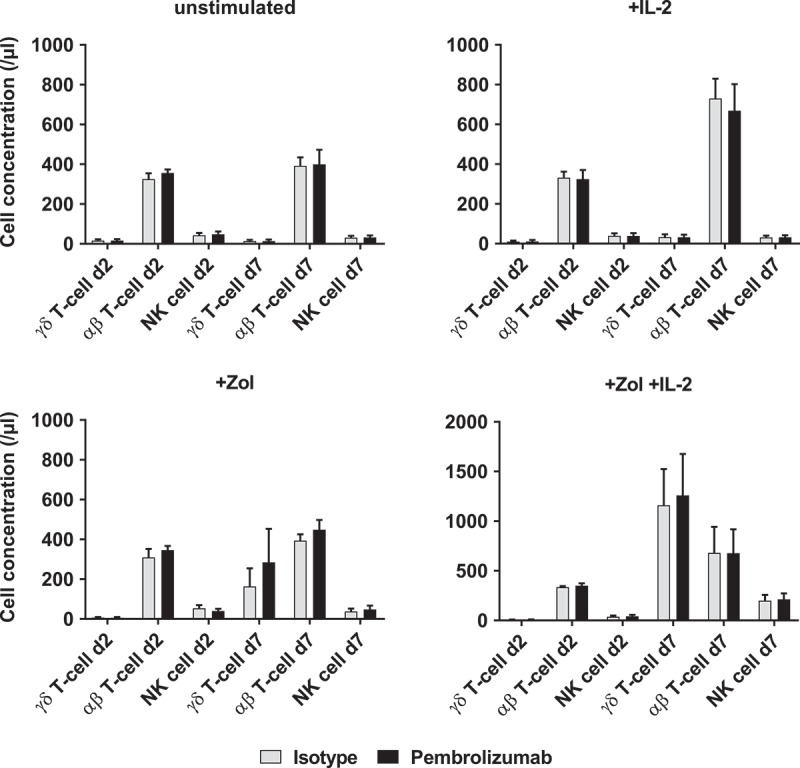
Proliferation of immune cells. Cell concentrations of different immune cell subpopulations (γδ T-cells, αβ T-cells and NK-cells) were determined by flow cytometry analysis. The four graphs depict different types of stimulation and compare additional stimulation without isotype control antibody and Pembrolizumab (both at 10 µg/ml) each on d2 and d7. All data are presented as mean + SEM of 4 independent experiments.
Figure 3.
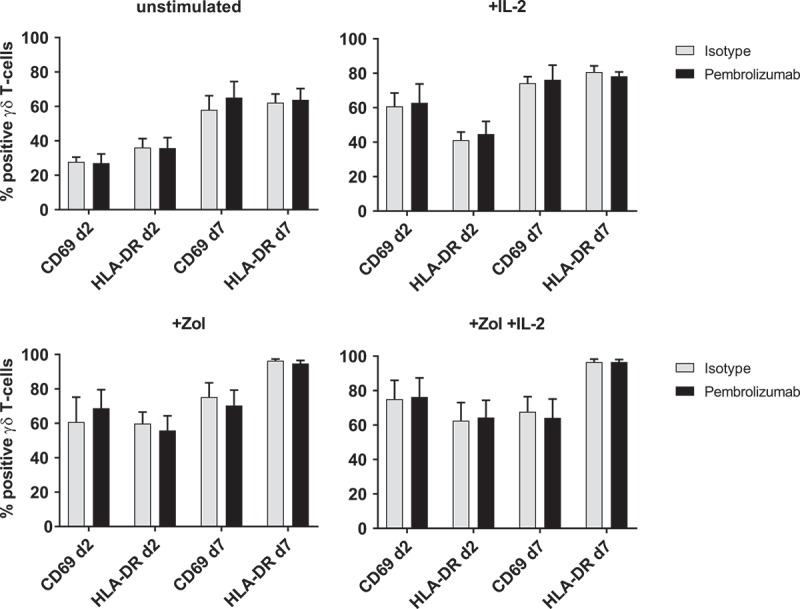
Expression of activation markers. Flow cytometry analysis of activation markers CD69 and HLA-DR on 1) unstimulated, 2) + IL-2, 3) + Zol and 4) + Zol + IL-2 stimulated PBMC with Isotype antibody or Pembrolizumab gated on γδ T-cells. All data are presented as mean + SEM of 4 independent experiments.
Effect of pembrolizumab on release of pro-inflammatory cytokines
The release of three different pro-inflammatory cytokines (IFN-γ, IL-2 and TNF-α) into the cell supernatants of both Zol as well as unstimulated PBMC cultures, with either isotype control antibody or Pembrolizumab, was measured at an early and later time-point. As expected, Zol induced a transient release of large quantities of IFN-γ which accumulates in the supernatant over time. However, owing to a marked inter-donor variability in cytokine production, there was only a tendency towards higher release of IFN-γ. The release of IL-2 and TNF-α were relatively low compared to IFN-γ and did not differ between cultures treated with Pembrolizumab or isotype antibody (Figure S3). As our results indicated a possible amplification of IFN-γ production following treatment with Pembrolizumab, we compared the intracytoplasmic production of IFN-γ specifically in γδ T-cells stimulated with Zol. To compensate for high inter-donor variability, IFN-γ production was normalized in regard to a control stimulus in each donor. Pembrolizumab compared to isotype control antibody boosted the IFN-γ production from 37.3% ± 15.3% to 58.3% ± 8.4% of a simultaneous control experiment with Zol + IL-2 stimulation, but did not affect IFN-γ production by unstimulated γδ T-cells (Figure 4).
Figure 4.
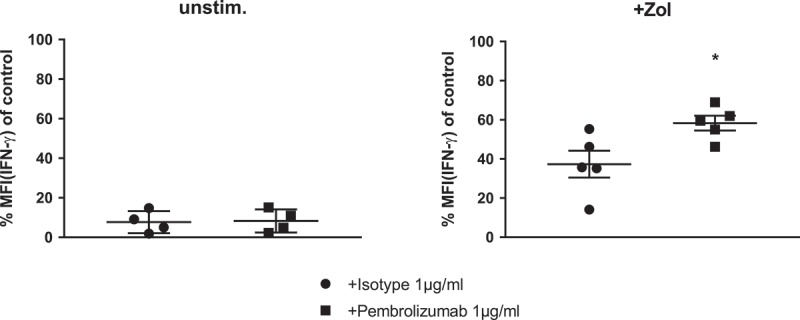
IFN-γ production of γδ T-cells in response to stimulation of PBMC. Normalized cyIFN-γ production of γδ T-cells from flow cytometry analysis of (a) unstimulated and (b) Zol stimulated PBMC after 48h with either isotype control antibody or Pembrolizumab (both 1 µg/ml). For the purpose of normalization, each MFI of the cytoplasmic interferon-γ (IFN-γ) measurement following Zol stimulation was related to the MFI of cyIFN-γ measurement following Zol + IL-2 stimulation obtained from the same donor in the same experiment: 100% cyIFN-γ production: MFI(X)/MFI(control) *100. All data are presented as mean ± SEM of 5 independent experiments. * = P < .05.
Effect of pembrolizumab on the anti-tumor response towards hematological malignancies
PBMC were co-cultured with untreated, as well as Zol pretreated leukemia cell lines for 48 h. γδ T-cells, as part of these PBMC, depicted a significantly increased degranulation and production of IFN-γ when encountering Zol sensitized cells from leukemia cell lines (KG-1, THP1 and HL60) (Figure 5(a)). Additional treatment with Pembrolizumab significantly boosted the IFN-γ production by γδ T-cells in response to one of the four tested Zol sensitized cell lines (THP-1), but not in response to any untreated leukemia cell line (Figure 5(b)). Expression of the degranulation marker CD107a was not significantly affected by Pembrolizumab.
Figure 5.
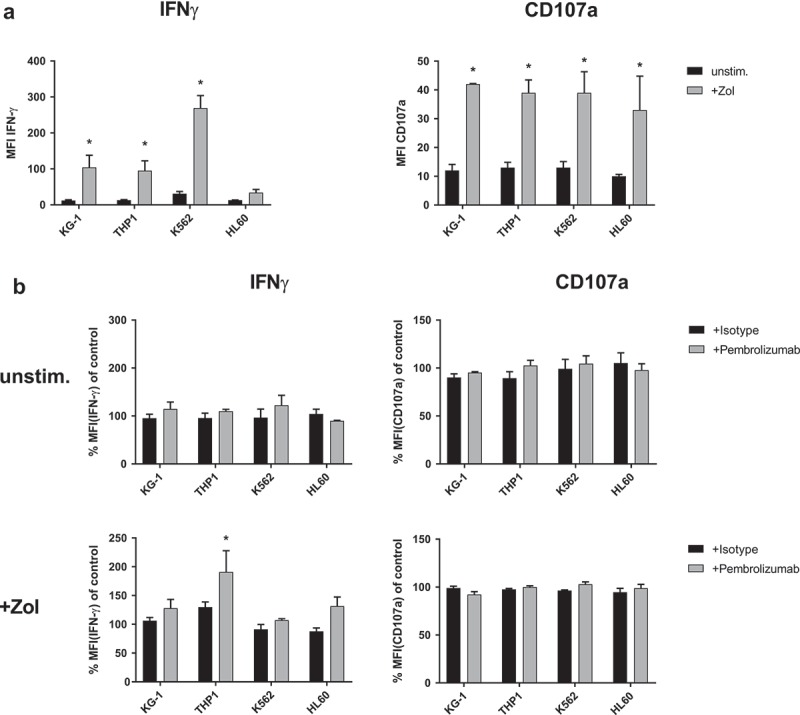
IFN-γ production and degranulation of γδ T-cells in response to leukemia cell lines. Flow cytometry analysis of cytoplasmic interferon-γ (IFN-γ) production and expression of degranulation marker CD107a by γδ T-cells. (a) Comparing co-culture of unstimulated PBMC with different leukemia cell lines (KG-1, THP-1, K562 and HL60) that were either previously kept unstimulated (unstim.) or sensitized with 10 µM Zol (+ Zol) for 48h. (b) Normalized cyIFN-γ production and expression of CD107a following co-culture of unstimulated PBMC with either unstimulated or + Zol treated leukemia cell lines (KG-1, THP-1, K562 and HL60) and treatment with either isotype antibody or Pembrolizumab (both at 10 µg/ml). All used leukemia cell lines were irradiated with 14gy directly before initiation of co-culture to prevent excessive growth and depletion of medium. For the purpose of normalization, each MFI of the cyIFN-γ or CD107a measurements following co-culture with unstimulated and + Zol cell lines with either isotype antibody or Pembrolizumab is related to the MFI of cyIFN-γ or CD107a measurement following co-culture with identically stimulated cell lines without antibody (= control) that were obtained from the same donor in the same experiment. All data are presented as mean + SEM of 3 independent experiments. * = P < .05 comparing (a) response to co-culture with unstimulated and + Zol sensitized leukemia cell lines, (b) Pembrolizumab and isotype antibody treatment.
Similar results could be obtained when PBMC were co-cultured with Zol sensitized primary AML blasts cells instead of leukemia cell lines (Figure 6). Here, Pembrolizumab significantly increased the mean IFN-γ production by γδ T-cells by approximately 30% in response to Zol treated AML cells. No significant changes could be observed with target cells that were not previously sensitized with Zol (Figure 6(b)). Additionally, there was no significant difference in the expression of CD107a. Fitting the observation regarding the direct stimulation of PBMC, the ratio of PD-1(+) γδ T-cells was also higher following co-culture of PBMC with + Zol treated leukemia cells, compared to co-culture with untreated cells [4.7% ± 2.8% to 55.9% ± 16.6%] (Figure 6(c)). When PD-1(+) γδ T-cells were compared to PD-1(-) γδ T-cells they depict increased production of IFN-γ in response to Zol treated AML cells (Figure 6(d)). We did not find any correlation between the expression of PD-L1/2 on unstimulated or Zol stimulated target cells (and the extent of IFN-γ production by γδ T-cells) (Figure S4).
Figure 6.
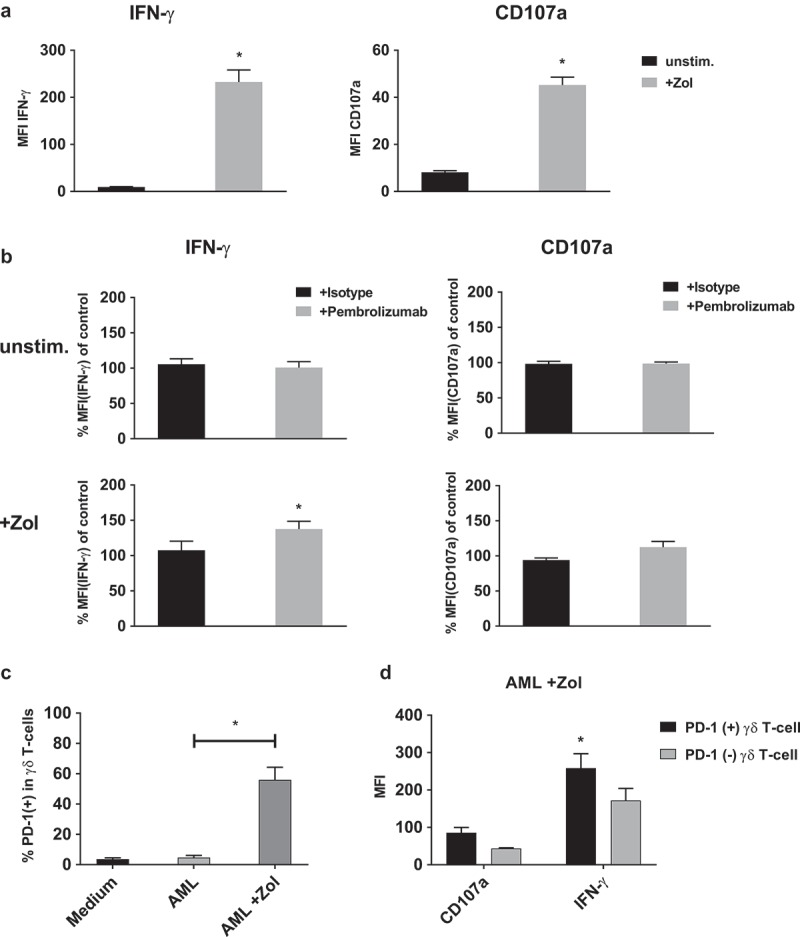
IFN-γ production and degranulation of γδ T-cells in response to primary leukemia cells. Flow cytometry analysis of cytoplasmic interferon-γ (IFN-γ) production and expression of degranulation marker CD107a by γδ T-cells. (a) Comparing co-culture of unstimulated PBMC with primary AML leukemia cells that were either kept unstimulated (unstim.) or sensitized with 10 µM Zol (+ Zol) for 48h. (b) Normalized cyIFN-γ production and expression of CD107a following co-culture with either unstimulated or Zol treated primary AML cells and treatment with either isotype antibody or Pembrolizumab (both at 10 µg/ml). For the purpose of normalization, each MFI of the cyIFN-γ or CD107a measurements following co-culture with unstimulated and + Zol primary AML with either isotype antibody or Pembrolizumab is related to the MFI of cyIFN-γ or CD107a measurement following co-culture with identically stimulated primary AML without antibody (= control) that were obtained from the same donor in the same experiment. (c) Ratio of PD-1 positive γδ T-cells of all PBMC comparing different types of co-culture. (d) Comparing PD-1 positive and negative γδ T-cells production of cyIFN-γ and expression of CD107a following co-incubation with Zol sensitized primary AML. All data are presented as mean + SEM of 4–6 independent experiments and primary AMLs. * = P < .05 comparing (a) response to co-culture with unstimulated and Zol sensitized primary AML, or (b) Pembrolizumab and isotype antibody treatment, (c) co-incubation with either non sensitized or + Zol sensitized primary AML and (d) PD-1(+) and PD-1(-) cells.
Zol treatment has a variable impact on cellular cytotoxicity of γδ T-cells enriched PBMC against leukemia cell lines and primary AML. While some cell lines become strongly sensitized and depict high specific lysis others do not respond well (Figure 7 and S5). Additional treatment with Pembrolizumab compared to isotype antibody does not have any effect on the specific lysis against unstimulated or Zol sensitized leukemia cell lines (Figure 7(a) and S5) or primary AML (Figure 7(b)).
Figure 7.
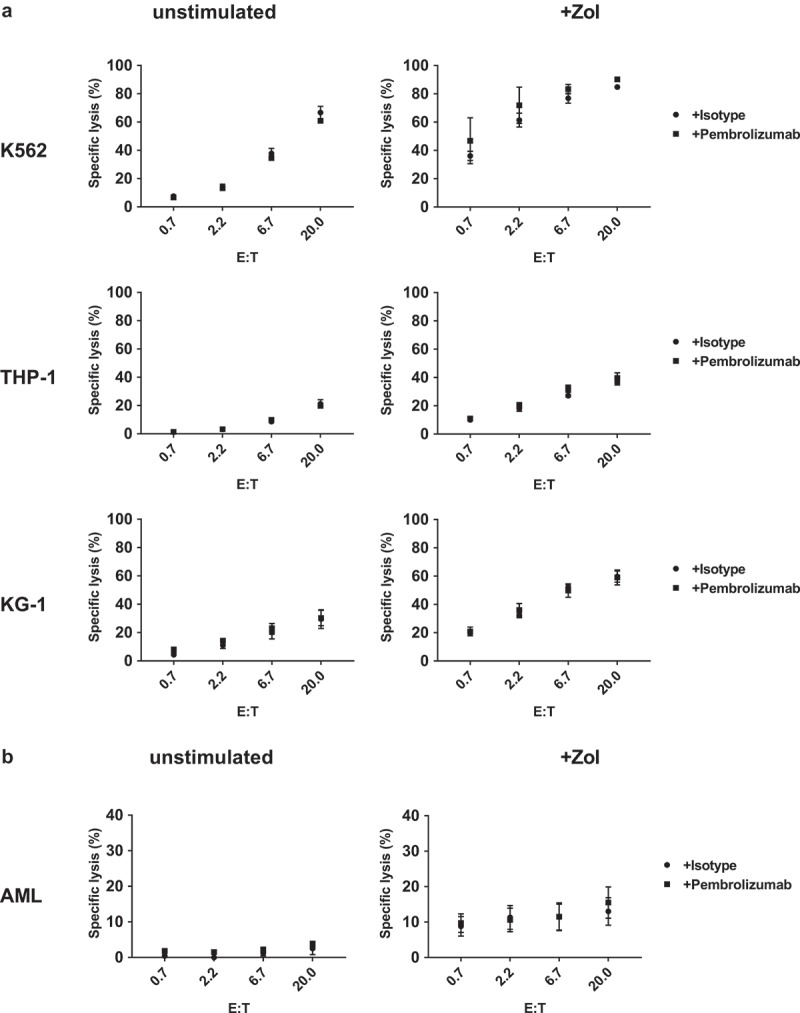
Cellular cytotoxicity against primary AML and leukemia cell lines. Target cells (a) leukemia cell lines (K563, THP-1 and KG-1) and (b) primary AML blasts were incubated in triplicates with stimulated PBMC containing > 80% γδ T-cells in different effector to target ratios (E:T). Target cell specific lysis was measured using a flow cytometry-based cellular cytotoxicity assay based on target cell labeling with PKH stain and nucleic acid-specific To-Pro-3 iodide stain. Specific cytotoxicity was calculated as: (TO-PRO-3(+) target cell co-incubated with effector cells minus TO-PRO-3(+) target cell without effector cells)/(100 minus TO-PRO-3(+) target cells without effector cells). All data are presented as mean ± SEM of 4–7 independent experiments.
Discussion
Expression kinetics of PD-1 and PD-L1/2 in vitro
Despite the growing clinical importance of checkpoint- inhibitors for cancer therapy our understanding of the associated cellular and molecular interaction is still insufficient to predict individual response. Considering the strong correlation between patient prognosis and tumor infiltration by γδ T-cells, as well as the significance of PD-1 expression, only few mechanistic studies have addressed the influence of PD-1 signaling on γδ T-cell biology.2
Initially Iwasaki et al. described the PD-1 expression pattern of human γδ T-cells from peripheral blood following stimulation with the potent direct PAg (E)-4-Hydroxy-3-methyl-but-2-enyl pyrophosphate (HM-BPP) in vitro.5 Comparable observations were made using Bromohydrin pyrophosphate (BrHPP),9 isopentenyl pyrophosphate (IPP),10 Zol + IL-211 and anti-CD3,-CD28 and -CD2 coated activation/expansion beads for stimulation.12 We observed a similar pattern of increasing PD-1 expression on γδ T-cells using Zol stimulation. Additionally, exogenous IL-2 boosted the effect of Zol. Sole IL-2 stimulation elicited a delayed upregulation in αβ T-cells and was also implied for γδ T-cells (Figure 1(a)), thus matching earlier reports on PD-1 upregulation by γδ T-cells following treatment with IL-2 without PAgs.9
Taken together, we find substantial agreement between several studies examining the PD-1 expression kinetics of healthy adults γδ T-cells using different types of stimulation in vitro. It seems that activating γδ T-cells via the T-cell receptor (TCR), results in a uniform transient upregulation of PD-1 peaking between day 2 and day 4 and returning to baseline around day 7. Exogenous IL-2 may promote this reaction in combination with PAgs but also causes a slower or delayed reaction when the primary stimulation via the TCR is missing. Interestingly, treatment with Zol and Zol + IL-2 inhibited the upregulation of PD-1 in αβ T-cells compared to unstimulated culture conditions at later time points.
PD-L1 upregulation can be triggered by the early pro-inflammatory cytokine IFN-γ, for example in monocytes but also in cancer cells.7,13,14 In T-cells upregulating PD-L1 has been implicated to protect γδ T-cells from fratricide.5 We did not detect changes in PD-L1 MFI following stimulation, but the fraction of PD-L1 positive cells increased significantly (Figure 1(b)). Temporary induction of PD-L1 according to MFI on Vδ2 T-cells has been described using different stimuli5,12 but others reported difficulties tracking PD-L1 due to weak staining by individual antibody clones.7 We found that the analyzing PD-1 or PD-L1 expression patterns according to either MFI or percentage of marker positive cells may lead to different results and could explain divergent earlier reports. It needs to be considered that changes in MFI describe the mean of the entire analyzed subset but within a given subset the expression can be distributed heterogeneously. Additionally, if a marker is expressed weakly the definition of a positive/negative cut-off value may be ambiguous. In accordance with earlier reports we did not find significant changes in expression of PD-L2 on any of the examined immune cell subsets (Figure S1B).
Expression of PD-1 by γδ T-cells in health and disease
Studies analyzing the immune cell repertoire in healthy adults found that PD-1 expression is higher in Vδ1+, compared to Vδ2 + T-cells15 but similar within several functionally distinctive subsets of Vδ2 T-cells.16 Others reported differences in PD-1 expression depending on CD27 and CD45RA status with preferential expression in the effector-memory subsets.9 We found a mean of 40% PD-1(+) on γδ T-cells in unstimulated human peripheral blood (Figure 1(a)) while three earlier studies found lower fractions of PD-1(+) cells (< 10%)7,10,15 and others reported higher values.5,9 As PD-1 expression appears as a continuum, these differences might be explained by the use of different cut-off levels for defining PD-1 positivity.
In direct comparison γδ T-cells from cryopreserved neonatal cord blood expressed more PD-1 compared to adult PBMC. Additionally, treatment with Zol + IL-2 induced higher and prolonged expression of PD-1 in neonatal compared to adult γδ T-cells.7 Patients with common variable immunodeficiency (CVID) have less Vδ2 T-cells but the remaining cells express more PD-1.15 In cancer, higher expression of PD-1 was described in γδ T-cells isolated from neuroblastoma14 and colorectal cancer tissues17 as well as multiple myeloma (MM) infiltrated BM.6 Daley et al. examined immune cell infiltration of pancreatic ductal adenocarcinoma tissues in humans and found that γδ T-cells were highly enriched compared to normal pancreas. These tumor infiltrating γδ T-cells were mostly Vγ9 negative and expressed elevated levels of PD-1 and PD-L1.18 In contrast, a decreased expression of PD-1 was found in γδ T-cells derived from peripheral blood of AML patients in remission, compared to healthy individuals.10 Recently, Zumwalde et al. connected in vitro stimulation experiments and in vivo observations in a humanized, immunodeficient mouse model. They found that the relatively high PD-1 status of short-term cultured and the lower PD-1 status of longer cultured γδ T-cells were maintained for at least 5 days after adoptive transfer in vivo. Additional EBV infection caused B cell lymphoma in this mouse model but did not re-induce PD-1 expression of adoptively transferred γδ T-cells.11
Functional aspects
Triggering immune suppressive effects via PD-1 signaling is currently understood as an important tumor escape mechanism.3 PD-1 is an inhibitory receptor and may function to regulate early immune reaction, prevent off-target reactivity and over-activation in γδ T-cells.5
We found that blocking PD-1 signaling with Pembrolizumab during activation with Zol and/or IL-2 did not result in a relevant increase of immune cell proliferation, expression of activation markers or release of IL-2 or TNF-α by PBMC (Figures 2, 3 and S3). However, PD-1 blockade significantly increased the cytoplasmic IFN-γ production of Zol stimulated γδ T-cells (Figure 4). Others have demonstrated that neither anti-PD-1 nor anti-PD-L1 antibodies changed the proliferative response of γδ T-cells co-cultured with CD4+ CD25- αβ T-cells and activated via anti-CD3 and anti-CD28 coated on culture plates.12 Following stimulation with HM-BPP, PD-1(+) compared to PD-1(-) γδ T-cells produced equal amounts of IFN-γ, TNF-α and IL-13 but more IL-2. Blocking PD-1 signaling with PD-L1 antibody did not change IL-2 production neither in PD-1(+) nor in PD-1(-) γδ T-cells.5 TNF- α production and degranulation of Vδ2 T-cells from cord blood, as well as from adult PBMC, could be dose-dependently inhibited by PD-L1.7
Anergy to direct and indirect PAgs stimulation and increased PD-1 expression of γδ T-cells have been described in different types of cancer in vitro and in vivo but the functional link is unclear.6,19,20 No differences in PD-1 expression kinetics were found following HM-BPP stimulation between healthy donors and breast cancer patients.5 Additionally, PD-L1 blocking antibodies could only partially restore in vitro PAg induced proliferation of anergic γδ T-cells from myeloma patients. These γδ T-cells were thought to be good candidates for strong PD-1/-L1 dependent suppression as they reside close to PD-L1 expressing multiple myeloma cells in vivo.6
Significance of γδ T-cell related PD-1 signaling in cancer
In our study we observed that PD-1 signaling significantly modulates IFN-γ production by γδ T-cells in response to co-culturing of PBMC with individual leukemia cell lines and primary AML blasts (Figures 5 and 6). Prior sensitization of target cells or activation of γδ T-cells is essential for IFN-γ production and changes by PD-1 blockade were not found under unstimulated conditions. These observations correspond well to the established PD-1 receptor upregulation following direct or indirect PAg stimulation of γδ T-cell. It is also in line with earlier reports on γδ T-cells from the BM of MM patients, where PD-1 blocking could enhance degranulation only with concomitant Zol sensitization.6 However, some target cells like Daudi cells are effective natural activators of γδ T-cells and do not need exogenous direct or indirect PAgs. PD-L1 overexpression in these cell lines inhibited IFN-γ production by co-cultured PD-1(+) γδ T-cells, but not by PD-1(-) γδ T-cells. Inhibition could then be reversed by treatment with PD-L1 blocking antibodies.5 In contrast, in our study we found that the endogenous expression pattern of PD-1 ligands PD-L1 and PD-L2 on leukemia cells is not influenced by Zol treatment and does not predict γδ T-cell production of IFN-γ (Figure S4).
In our experiments the increased IFN-γ production by γδ T-cells due to PD-1 blockade was not accompanied by an increase in specific cell dependent cytotoxicity against leukemia (Figure 7 and S5). Similarly, Iwasaki et al. found only little to no effect of PD-L1 blocking on the cytotoxic activity of PD-1(+) γδ T-cells against both untreated and Zol treated Daudi cell. This finding was reproduced in several Zol treated solid tumor cell lines with heterogeneous expression of PD-L1.5 It is well established that IFN-γ signaling is of major importance for immunological tumor rejection via direct and indirect mechanisms.21 Therefore, increasing production of this cytokine by immune cells using PD-1 blockade or other strategies may result in significant improvement of anti-tumor and anti-lymphoma activity despite enhancement of cytotoxicity.
Interestingly, beside cytokine production and cell mediated cytotoxicity, other immunological functions might be connected to PD-1 signaling by γδ T-cells. We observed significant inhibition of PD-1 expression by αβ T-cells due to Zol stimulation which was preceded by an increase in PD-L1 positive γδ T-cells. This sequence might indicates the capability of γδ T-cells to regulate αβ T-cells (Figure 1(a)). However, it remains unclear if the observed effects are directly caused by Zol, the cytokine milieu, or by modification of cellular interactions. It would be interesting to investigate this in a future studies as it could represent a useful anti-tumor mechanism targeting anergic αβ T-cells in the tumor microenvironment.
Data from a mouse model indicated that a specific subset of γδ T-cells expresses PD-L1, has a pro-tumor function, and inhibits infiltration by αβ T-cells via PD-1/PD-L1 signaling.18 An immunosuppressive CD39+ γδ T-cells subset has also been described in colorectal cancer patients. Such tissue infiltrating cells were predominantly Vδ1 γδ T-cells and expressed higher levels of PD-1 and PD-L1 compared to CD39+ γδ T-cells in normal tissues. In this case, regulation might not be directly enabled by PD-1/-L1 interaction, as concomitant PD-1 blockade did not change the measured parameters of immunosuppression.17 Finally, Peters et al. described immunosuppressive effects of Vδ2 T-cells on αβ T-cells which could be inhibited by anti-PD-L1 antibodies, but to a lesser extent by anti-PD-1 antibodies.12
Conclusions
Taken together, stimulation with Zol and IL-2 induces immune subset specific and time dependent changes in PD-1 and PD-L1 expression of PBMC in vitro. Targeting the PD-1 – PD-L1 axis modulates IFN-γ production by γδ T-cells in response to indirect PAg stimulation and certain hematological malignancies. The cytotoxic capabilities of stimulated γδ T-cells against several types of leukemia appear to be differently regulated and independent from PD-1 – PD-L1 signaling.
We conclude that the influence of PD-1 signaling on cytokine production and proliferation depends on the concomitant stimulation or earlier priming of γδ T-cells. It is weak in naïve γδ T-cells from peripheral blood of healthy adults receiving strong TCR signals, for example with saturating doses of direct and indirect PAgs. Especially with exogenous IL-2, PD-1 signaling may be overruled and become negligible. However, PD-1 might be important for anti-tumor functions of anergic or differentiated γδ T-cells receiving lower degrees of stimulatory signals. Such conditions may be found under immunosuppressive conditions in the tumor microenvironment. We suggest that PD-1 – PD-L1 signaling may significantly improve anti-tumor functions of γδ T-cells under two conditions 1) the TCR and IL-2 receptor activity is submaximal and 2) the PD-1 receptor is expressed, functional and engaged by its ligand.
Material and methods
Cell isolation and culture
All procedures were conducted in accordance with the declaration of Helsinki from 1975. PBMC from healthy male and female volunteers, between 20 and 60 years of age, were isolated by density gradient centrifugation with Biocoll (Biochrom, Darmstadt, Germany). Primary human leukemia cells were isolated from heparinized peripheral blood or from residual material of bone marrow (BM) biopsies from patients recruited at our clinic. All patients gave prior written informed consent. Primary leukemia cells were characterized by microscopic morphology and flow cytometry. Following isolation, the proportion of leukemic blast was > 90% of nucleated cells in all samples. Cells were frozen in Cellbanker media (AMS Biotechnology, Abingdon, UK) according to the manufacturer instructions and stored in liquid nitrogen. Cryopreserved cells were thawed 24–48 h before their usage in the experiments as described. For measuring effects of immune cell stimulation as well as for the generation of effector cells, 2 × 10⁵ PBMC were cultured in microtiter 96 well plates (Greiner bio-one, Frickenhausen, Germany) using standard medium consisting of RPMI 1640 supplemented with 10% fetal bovine serum, 2 mM L-glutamine, and 1% penicillin+ streptomycin (all from Biochrom). RPMI was “low endotoxin” grade and FCS contained less than 3 EU/ml endotoxin. 100 U/mL IL-2 with or without 1 µM Zol (both Novartis, Nuremberg, Germany) were added on day 0 as indicated (+ IL-2 or Zol + IL-2). Cells were harvested, washed and reseeded at 2 × 10⁵ PBMC per well on day 7 and day 9. Additional IL-2 (100 U/mL) was added on day 7 and day 9 to the previously Zol + IL-2 and IL-2 stimulated cultures. The leukemia and lymphoma cell lines KG-1, THP-1, K562 and HL-60 were obtained from the German collection of microorganisms and cell culture (DSMZ, Braunschweig, Germany) and cultured in standard medium. The identity of the continuously cultured leukemia cell lines was confirmed by flow cytometry and morphology. Leukemia cell lines were also routinely monitored to exclude mycoplasma infections. Cell counts and cell viability were established using a hemocytometer and the trypan blue exclusion method. Cell viability rate was > 92% in all experiments.
Flow cytometry
A FC500 flow cytometer was used for multicolor immunofluorescence, for intracellular staining, cytometric bead array and cytotoxicity analysis. Cells were stained with appropriate combinations of: anti-T-cell receptor αβ- fluorescein isothiocyanate (FITC) [clone BW242/412] (Miltenyi Biotec, Bergisch Gladbach, Germany), anti-T-cell receptor γδ-FITC [clone IMMU510], anti-CD3- r-Phycoerythrin-Texas Red (ECD) [clone UCHT1] (Beckman Coulter, Brea, USA) and anti-CD56- phycoerythrin-cyanine 5 (PC5) [clone N901] (Beckman Coulter) monoclonal antibodies to identify the populations if interest. Specific staining of phycoerythrin (PE)- conjugated anti-PD-1 [clone EH12.2H7] (BioLegend, San Diego, USA), anti-PD-L1 [clone MIH2] (Abcam, Cambridge, UK), anti-PD-L2 [clone MIH14] (Abcam) antibodies, relative to appropriate isotype control antibodies (Abcam), were expressed as the ratio of antigen positive cells or as delta mean fluorescent intensity (MFI) calculated by ΔMFI = MFI(target antigen) minus MFI(control antibody). Staining with PE- conjugated anti-CD69 [clone TP1.55.3] (Beckman Coulter) and anti-HLA-DR [clone AC122] (Miltenyi Biotec) antibodies was used to identify activated immune cells. Gating strategy for the data presented in (Figures 1–3) is shown in the supplement (Figure S6). Low endotoxin and azide free anti-PD-1 “Pembrolizumab” and IgG4 isotype control antibody preparations for functional assays were provided by MSD (Haar, Germany).
Degranulation and intracytoplasmic IFN-γ assay
PBMC were cultured with or without target cells (leukemia cell lines irradiated with 14gy or primary leukemia cells) in 48 well plates for 48h. Depending on the type of experiment 1 µM Zol, or 1 µM Zol + 100 U/ml IL-2 as well as 1–10 µg/ml Pembrolizumab or isotype antibody were added as indicatd. Target cells were previously kept unstimulated or were sensitized with 10 µM Zol for 48h. After culturing, cells were harvested, washed, fixed and permeabilized using the Inside Stain kit and stained with anti-IFN-γ-PE [clone 45–15] and anti-CD107a-FITC [H4A3] (all from Miltenyi Biotec). Cells were additionally stained for markers allowing identification of immune cell populations and discrimination of PD-1(+) and PD-1(-) cells by flow cytometry. Semi quantitative data of IFN-γ or CD107a expression is presented either as unadjusted MFI or as relative values following normalization to the MFIs of a control experiment with the same PBMC donor using the formula MFI(IFN-γ/CD107a)/MFI(control) *100. Gating strategy for the data presented in (Figures 4–6) is shown in the supplement (Figure S7).
Cytotoxicity assay
Cytotoxicity experiments were conducted in 96 well V-bottom plates as co-culture at different ratios of effector to target cells with Pembrolizumab or isotype control antibody. Target cells were previously kept unstimulated or were sensitized with 10 µM Zol for 48h and labeled with carboxyfluorescein succinimidyl ester (CFSE) (BioLegend). Effector cells were generated by Zol + IL-2 stimulation and culture of PBMC from different healthy donors for 9–12 days (as described above) which contained > 80% γδ T-cells. Following co-culture for 5 h, cells were harvested, technical replicates were pooled, treated with TO-PRO-3 stain (Molecular Probes, Eugene, USA) and evaluated by flow cytometry. Specific cell mediated cytotoxicity is expressed as “specific lysis %” and calculated by the formula: specific lysis % = [% TO-PRO-3+ target cells in the respective effector to target ratio – % TO-PRO-3+ target cells in target cell only culture]/[100 – % TO-PRO-3+ target cells in target cell only culture]. Gating strategy for the data presented in Figure 7 is shown in the supplement (Figure S8).
Data and statistical analysis
Data was analyzed with CXP-analysis V2.2 (Beckman Coulter), Excel 2013 (Microsoft, Redmond, USA) and GraphPad Prism 7 (Graphpad Software, La Jolla, USA) software. Data are depicted as mean ± standard error of the mean (SEM). Levels of significance was calculated using one-way or two-way ANOVA and Dunn´s or Bonferroni´s multiple comparison post-hoc tests. P < .05 is considered statistically significant.
Funding Statement
Timm Hoeres was supported by “Verein Hilfe für Krebskranke e.V”. This study was supported in part by a research grant from Investigator-Initiated Studies Program of Merck Sharp & Dohme Corp, which also supplied Pembrolizumab;Merck [52817];
SUPPLEMENTAL DATA
Supplemental data for this article can be accessed here.
Authorship contributions
T.H. designed the experiments, performed research, analyzed and interpreted data and wrote the paper; E.H. analyzed data and performed research; M.S. analyzed data and edited the paper; J.B. interpreted data and edited the paper; M.W. contributed to conception and design, interpreted data and edited the paper.
Disclosure of conflicts of interest
This study was supported in part by a research grant from Investigator-Initiated Studies Program of Merck Sharp & Dohme Corp which also supplied Pembrolizumab. Pembrolizumab is a clinical stage anti-tumor drug licensed by MSD. There was no personal remuneration for any of the authors by MSD and no MSD employee did participate in study planning, execution, data analysis or writing of the manuscript. The opinions expressed in this paper are those of the authors and do not necessarily represent those of Merck Sharp & Dohme Corp.
References
- 1.Tamamyan G, Kadia T, Ravandi F, Borthakur G, Cortes J, Jabbour E, Daver N, Ohanian M, Kantarjian H, Konopleva M.. Frontline treatment of acute myeloid leukemia in adults. Crit Rev Oncol Hematol. 2017;110:20–34. doi: 10.1016/j.critrevonc.2016.12.004. [DOI] [PMC free article] [PubMed] [Google Scholar]
- 2.Hoeres T, Smetak M, Pretscher D, Wilhelm M.. Improving the efficiency of Vγ9Vδ2 T-cell immunotherapy in cancer. Front Immunol. 2018;9. doi: 10.3389/fimmu.2018.00800. [DOI] [PMC free article] [PubMed] [Google Scholar]
- 3.Alsaab HO, Sau S, Alzhrani R, Tatiparti K, Bhise K, Kashaw SK, Iyer AK. PD-1 and PD-L1 checkpoint signaling inhibition for cancer immunotherapy: mechanism, combinations, and clinical outcome. Front Pharmacol. 2017;8:561. doi: 10.3389/fphar.2017.00561. [DOI] [PMC free article] [PubMed] [Google Scholar]
- 4.Boussiotis VA. Molecular and biochemical aspects of the PD-1 checkpoint pathway. N Engl J Med. 2016;375:1767–1778. doi: 10.1056/NEJMra1514296. [DOI] [PMC free article] [PubMed] [Google Scholar]
- 5.Iwasaki M, Tanaka Y, Kobayashi H, Murata-Hirai K, Miyabe H, Sugie T, Toi M, Minato N. Expression and function of PD-1 in human gammadelta T cells that recognize phosphoantigens. Eur J Immunol. 2011;41:345–355. doi: 10.1002/eji.201040959. [DOI] [PubMed] [Google Scholar]
- 6.Castella B, Foglietta M, Sciancalepore P, Rigoni M, Coscia M, Griggio V, Vitale C, Ferracini R, Saraci E, Omede P, et al. Anergic bone marrow V gamma 9V delta 2 T cells as early and long-lasting markers of PD-1-targetable microenvironment-induced immune suppression in human myeloma. Oncoimmunology. 2015;4. doi: 10.1080/2162402X.2015.1008371. [DOI] [PMC free article] [PubMed] [Google Scholar]
- 7.Hsu H, Boudova S, Mvula G, Divala TH, Mungwira RG, Harman C, Laufer MK, Pauza CD, Cairo C. Prolonged PD1 expression on neonatal Vdelta2 lymphocytes dampens proinflammatory responses: role of epigenetic regulation. J Immunol. 2016;197:1884–1892. doi: 10.4049/jimmunol.1600284. [DOI] [PMC free article] [PubMed] [Google Scholar]
- 8.Boyman O, Sprent J. The role of interleukin-2 during homeostasis and activation of the immune system. Nature Rev. 2012;12:180–190. doi: 10.1038/nri3156. [DOI] [PubMed] [Google Scholar]
- 9.Gertner-Dardenne J, Fauriat C, Orlanducci F, Thibult ML, Pastor S, Fitzgibbon J, Bouabdallah R, Xerri L, Olive D. The co-receptor BTLA negatively regulates human Vgamma9Vdelta2 T-cell proliferation: a potential way of immune escape for lymphoma cells. Blood. 2013;122:922–931. doi: 10.1182/blood-2012-11-464685. [DOI] [PubMed] [Google Scholar]
- 10.Van Acker HH, Anguille S, De Reu H, Berneman ZN, Smits EL, Van Tendeloo VF. Interleukin-15-cultured dendritic cells enhance anti-tumor gamma delta T cell functions through IL-15 secretion. Front Immunol. 2018;9:658. doi: 10.3389/fimmu.2018.00658. [DOI] [PMC free article] [PubMed] [Google Scholar]
- 11.Zumwalde NA, Sharma A, Xu X, Ma S, Schneider CL, Romero-Masters JC, Hudson AW, Gendron-Fitzpatrick A, Kenney SC, Gumperz JE. Adoptively transferred Vgamma9Vdelta2 T cells show potent antitumor effects in a preclinical B cell lymphomagenesis model. JCI Insight. 2017;2. doi: 10.1172/jci.insight.88864. [DOI] [PMC free article] [PubMed] [Google Scholar]
- 12.Peters C, Oberg HH, Kabelitz D, Wesch D. Phenotype and regulation of immunosuppressive Vdelta2-expressing gammadelta T cells. Cell Mol Life Sci. 2014;71:1943–1960. doi: 10.1007/s00018-013-1467-1. [DOI] [PMC free article] [PubMed] [Google Scholar]
- 13.Mandai M, Hamanishi J, Abiko K, Matsumura N, Baba T, Konishi I. Dual faces of IFNgamma in cancer progression: a role of PD-L1 induction in the determination of pro- and antitumor immunity. Clin Cancer Res. 2016;22:2329–2334. doi: 10.1158/1078-0432.CCR-16-0224. [DOI] [PubMed] [Google Scholar]
- 14.Dondero A, Pastorino F, Della Chiesa M, Corrias MV, Morandi F, Pistoia V, Olive D, Bellora F, Locatelli F, Castellano A, et al. PD-L1 expression in metastatic neuroblastoma as an additional mechanism for limiting immune surveillance. Oncoimmunology. 2016;5:e1064578. doi: 10.1080/2162402X.2015.1064578. [DOI] [PMC free article] [PubMed] [Google Scholar]
- 15.Paquin-Proulx D, Barsotti NS, Santos BA, Marinho AK, Kokron CM, Carvalho KI, Barros MT, Kalil J, Nixon DF, Kallas EG. Inversion of the Vdelta1 to Vdelta2 gammadelta T cell ratio in CVID is not restored by IVIg and is associated with immune activation and exhaustion. Medicine (Baltimore). 2016;95:e4304. doi: 10.1097/MD.0000000000004864. [DOI] [PMC free article] [PubMed] [Google Scholar]
- 16.Ryan PL, Sumaria N, Holland CJ, Bradford CM, Izotova N, Grandjean CL, Jawad AS, Bergmeier LA, Pennington DJ. Heterogeneous yet stable Vdelta2(+) T-cell profiles define distinct cytotoxic effector potentials in healthy human individuals. Proc Natl Acad Sci USA. 2016;113:14378–14383. doi: 10.1073/pnas.1611098113. [DOI] [PMC free article] [PubMed] [Google Scholar]
- 17.Hu G, Wu P, Cheng P, Zhang Z, Wang Z, Yu X, Shao X, Wu D, Ye J, Zhang T, et al. Tumor-infiltrating CD39(+)gammadeltaTregs are novel immunosuppressive T cells in human colorectal cancer. Oncoimmunology. 2017;6:e1277305. doi: 10.1080/2162402X.2016.1277305. [DOI] [PMC free article] [PubMed] [Google Scholar]
- 18.Daley D, Zambirinis CP, Seifert L, Akkad N, Mohan N, Werba G, Barilla R, Torres-Hernandez A, Hundeyin M, Mani VRK, et al. gammadelta T cells support pancreatic oncogenesis by restraining alphabeta T cell activation. Cell. 2016;166:1485–99 e15. doi: 10.1016/j.cell.2016.07.046. [DOI] [PMC free article] [PubMed] [Google Scholar]
- 19.Wilhelm M, Kunzmann V, Eckstein S, Reimer P, Weissinger F, Ruediger T, Tony HP. Gammadelta T cells for immune therapy of patients with lymphoid malignancies. Blood. 2003;102:200–206. doi: 10.1182/blood-2002-12-3665. [DOI] [PubMed] [Google Scholar]
- 20.Mariani S, Muraro M, Pantaleoni F, Fiore F, Nuschak B, Peola S, Foglietta M, Palumbo A, Coscia M, Castella B, et al. Effector gammadelta T cells and tumor cells as immune targets of zoledronic acid in multiple myeloma. Leukemia. 2005;19:664–670. doi: 10.1038/sj.leu.2403693. [DOI] [PubMed] [Google Scholar]
- 21.Ikeda H, Old LJ, Schreiber RD. The roles of IFN gamma in protection against tumor development and cancer immunoediting. Cytokine Growth Factor Rev. 2002;13:95–109. [DOI] [PubMed] [Google Scholar]
Associated Data
This section collects any data citations, data availability statements, or supplementary materials included in this article.