

Abstract
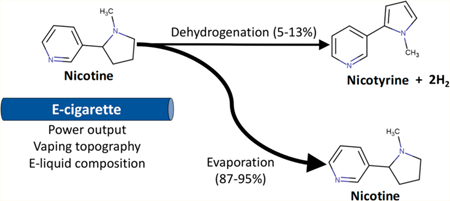
Nicotine is one of the major components of electronic cigarette (e-cigarette) emissions. Nicotyrine is a product of nicotine dehydrogenation in e-vapor and is a known inhibitor of human cytochrome P450 enzyme, which mediates nicotine metabolism. However, the emission of nicotine and especially nicotyrine from e-cigarettes has not been studied under real-world vaping patterns. This study examined the impact of e-liquid composition, e-cigarette device power output, and vaping topography on nicotine and nicotyrine concentrations under real-world vaping patterns. The amount of nicotine emitted from e-cigarettes vaped at high e-liquid nicotine levels, high device power, and large puff volumes ranged from 0.365 μg/puff to 236 μg/puff and was comparable to the amount of nicotine emitted from regular cigarettes. e-cigarette coil temperatures (200–300 °C) favored the formation of nicotyrine: e-cigarette vaping generated 2- to 63-fold more nicotyrine per unit nicotine emission than conventional cigarette smoking. High nicotyrine emission from e-cigarettes indicates that nicotine metabolism could be potentially interrupted, which could lead to reduced e-cigarette usage, and result in lower exposures to toxic chemicals (e.g., formaldehyde and acetaldehyde). However, higher serum nicotine levels might increase cancer risks by stimulating nicotinic acetylcholine receptors (nAchRs).
Graphical Abstract
1. INTRODUCTION
The use of electronic cigarettes (e-cigarettes) has rapidly increased, particularly among established smokers who turn to e-cigarettes as an alternative to and means for quitting cigarette smoking.1–3 Nicotine, a principal tobacco alkaloid, is one of the major constituents of the aerosol produced by e-cigarettes (e-vapor).4 The presence and delivery of nicotine in e-cigarettes are important in making e-cigarette use a satisfactory smoking alternative and cessation aid. However, the amount of nicotine delivered from e-cigarettes to the human airways can be variable. Personal vaping patterns that affect the levels of nicotine emitted from e-cigarettes include the choice of e-liquid, e-cigarette coil type, device power output setting, and vaping topography.5 Furthermore, a user’s plasma nicotine level is affected by the metabolism of nicotine, which can be altered by nicotyrine.6
Nicotyrine is a dehydrogenation product of nicotine that may form through the hydrogen abstraction reaction of nicotine during e-cigarette vaping.7 In addition, oxidation of nicotine during storage can also form nicotyrine.8 Nicotyrine could inhibit nicotine metabolism through binding to the cytochrome P450 isoforms (i.e., CYP2A6 and CYP2A13), resulting in higher plasma nicotine levels.9 e-cigarette vaping is expected to deliver significantly higher amounts of nicotyrine than conventional cigarette products because the coil temperatures of e-cigarettes (200–300 °C) are more favorable to the formation of nicotyrine than the temperatures of burning cigarettes (i.e., ~ 900 °C).7
Although a few studies have reported nicotine and nicotyrine levels in e-vapor, these studies did not reflect the wide range of real-world vaping patterns, that is, the diversity of e-liquid composition, e-cigarette power output, and vaping topography.10,11 Therefore, nicotine and nicotyrine emissions under real-world vaping patterns are still not well understood. This study evaluated nicotine and nicotyrine emissions under a wide range of real-world vaping patterns.
MATERIALS AND METHODS
E-Cigarette Device and E-Liquids Preparation.
A refillable tank type of e-cigarette (The Council of Vapor, Walnut, CA, USA) consisting of adjustable Nichrome heating coils (0.8–2.0 Ω, dual bottom-coil) was used to measure nicotine and nicotyrine. Two types of battery boxes, an Apollo Valiant battery (Apollo e-cigarette, Concord, CA, USA) and a Sigelei-100W battery (Sigelei US, Pomona, CA, USA), were used to provide a wide range of heating power from 3 to 100 W. The e-cigarette devices and battery boxes used in this study were also capable of generating high power outputs at stable wattage for many large volume puffs. All e-liquids were freshly prepared in our lab using propylene glycol (PG, USP grade, Sigma, St. Louis, MO, USA), vegetable glycerin (VG, USP grade, J.T. Baker, Phillipsburg, NJ, USA), and (—)-nicotine (≥99%, Sigma, St. Louis, MO, USA).
E-Vapor Generation and Collection.
e-vapor generation conditions for this study (i.e., power output, vaping topography, and e-liquid composition) were established based on the e-cigarette use patterns obtained from a convenience sample of 23 current e-cigarette users, recruited with the approval of Rutgers IRB (Pro20140000589). Study participants were healthy adults (18–65 years old), who had used e-cigarettes daily for a total of at least 50 days at the time of the study and had not used any other forms of combusted tobacco products in the past 30 days.
The vaping topographies of each study participant were measured using a CReSS pocket device (Borgwaldt KC Incorporated, Hamburg, Germany) during a 30 min ad lib vaping session in an office setting, using his/her own e-cigarettes and e-liquids. Table S1 lists the demographic details of the 23 study participants. The observed e-cigarette vaping patterns (i.e., device power output, vaping topography, and e-liquid composition) of the 23 study participants are presented in Table S2.
To evaluate the impact of the e-liquid composition on nicotine and nicotyrine emissions, a wide range of nicotine concentrations (0—36 mg/mL) in three base materials (100% PG, 100% VG, and PG&VG mixture [v/v = 1:1]) was used.
To evaluate the impact of e-cigarette power settings on nicotine and nicotyrine emissions, three power output levels (6.4, 14.7, and 31.3-W) were used for e-vapor generation. The selected power outputs represented the median, mean, and 95th percentile of the observed power output used by the 23 study participants. These selected power output levels have been characterized as “safe”, “hot”, and “extremely hot” on a popular consumer Web site that provides users with “vaping tutorials”.12
To evaluate the impact of vaping topography on nicotine and nicotyrine emissions, three puff volumes and two puff durations were used. One puff volume (35 mL) was based on the standard regime used for cigarette smoking topography studies,13 and the other two represented the median and the 95th percentile of the puff volumes (90 and 170 mL, respectively) obtained from the 23 study participants. For the two puff durations, one was adopted from cigarette smoking topography regime standards (2 s),13 and the other was based on the median puff duration (3.8 s) from the study subjects. The observed and selected vaping topographies in our study were consistent with the vaping topographies reported in the literature: puff volumes ranged from 51 to 133 mL, with a median of 91 mL; and puff durations ranged from 3.0 s to 4.3 s, with a median of 3.8 s.14−19 Square shape topographies, instead of bell shape topographies commonly observed for cigarette smoking, were observed from our study subjects (Figure S1) and were used to generate e-vapor.13
Under each experimental condition (Table S3), e-vapor was generated using an LX1 smoking machine (Borgwaldt KC Incorporated, Hamburg, Germany). Twenty puffs of e-vapor were collected on a 47 mm Teflon filter (2.0 μm pore size, Pal life sciences, Port Washington, NY, USA). During each sampling, the Teflon filter was placed in a holder submerged into an ice bucket to increase the condensation of the particle phase e-vapor because nicotine was found to be in particle phase, not in gas phase e-vapor.20 Nicotyrine was also expected to be presented as particle phase due to the similar chemical properties. The weight of the collected e-vapor was measured by weighing the Teflon filter while in the filter holder before and after each sampling.
Nicotine and Nicotyrine Measurement.
The collected e-vapor was extracted from the Teflon filter using 5 mL of acidified ethanol, prepared by adding 3.75 mL of concentrated hydrochloric acid (37%, Sigma, St. Louis, MO, USA) to 1 L of ethanol (≥99.8%, Sigma, St. Louis, MO, USA). Acidified ethanol significantly increased UV absorption of nicotine and nicotyrine, and the samples were stable during the analysis.21,22 All samples were analyzed within 1 h to avoid their decomposition. UV absorption of nicotine and nicotyrine was stable during the analysis. Filter extracts were analyzed by UV absorbance (GENESYS 10 UV-vis spectrophotometer, Thermo Scientific, Waltham, MA, USA) at two wavelengths: 260 and 310 nm, for nicotine and nicotyrine, respectively.21 Nicotine did not interfere with nicotyrine measurement, but nicotyrine showed weak absorbance at 260 nm.21 However, the interference of nicotyrine was negligible since nicotyrine was at much lower concentrations than nicotine in the e-vapor. Base materials (VG and PG) might also interfere with the UV absorbance of nicotine and nicotyrine. To deal with the matrix effect, VG, PG&VG, and PG e-vapors without nicotine (20 puffs) were collected. Standards were prepared by adding known amounts of nicotine and nicotyrine (Toronto Research Chemicals, North York, ON, Canada) into the e-vapor extracts containing different base materials (Figure S2). The limit of detection (LOD) of nicotine was 290, 303, and 296 ng/mL for VG, PG&VG mixture, and PG-based e-vapor, respectively; and the LOD for nicotyrine was 64, 59, and 45 ng/mL for VG, PG&VG mixture, and PG-based e-vapor, respectively.
The UV spectroscopy method for nicotine and nicotyrine measurement was validated by a GC/MS/MS method described in the Supporting Information. In brief, 20 puffs of e-vapor were generated using VG based e-liquid containing 12 mg/mL nicotine under two different power output conditions (6.4 and 31.3-W). The generated e-vapor was collected on the Teflon filter, and 2 μL quinolone (98%, Sigma, St. Louis, MO, USA) was spiked on the filter as an internal standard. Quinoline-spiked filters were extracted using 4 mL methanol (HPLC grade, ≥ 99.9%, Sigma, St. Louis, MO, USA) and analyzed by GC/MS/MS. The internal standard extraction efficiency was over 99%. The difference in measured nicotine and nicotyrine concentrations between the two methods was <10% and 6.5%, respectively (Figure S4).
Sampling Artifact.
Nicotyrine can be formed during e-liquid storage and sampling processes due to the oxidation of nicotine.10 Solvent blanks were always checked on the same day of sample collection. The formation of nicotyrine during the sampling process was examined by spiking 50 μL of VG based e-liquid containing 3.0, 12, 24, and 36 mg/mL nicotine on a Teflon filter and introducing 20 or 50 puffs (35, 90, and 170 mL puffs) of clean air through the spiked filter. Nicotine and nicotyrine on the filter were measured before and after introducing air to the filter.
e-Vapor pH Measurement.
The acidity of e-vapor can affect the gas/particle partitioning and the absorption of nicotine in the human respiratory system.23,24 Therefore, 20 puffs of e-vapor collected on a Teflon filter were dissolved in 5 mL of DI water, and the acidity was measured using an OAKTON pH 110 instrument (OAKTON instrument, Vernon Hills, IL, USA).
Statistical Analyses.
Two-tailed Student’s t tests were conducted using R 3.4.3 (R Development Core Team, Vienna, Austria) to compare the means across different e-cigarette vaping conditions.
RESULTS
Sampling Artifact.
Nicotine and nicotyrine concentrations and the nicotyrine/nicotine ratio (mass/mass) of the prepared e-liquids are summarized in Table 1. The high-purity nicotine solution (≥99%) contained 87 ± 23 ng nicotyrine per 10 μg of nicotine. e-liquids with higher nicotine content showed significantly higher nicotyrine concentrations and nicotine/nicotyrine ratios. The nicotyrine/nicotine ratios for e-liquids containing 12, 24, and 36 mg/mL nicotine were 1.6-, 1.9-, and 2.2-fold higher than the ratio for e-liquids containing 3.0 mg/ mL nicotine, respectively.
Table 1.
Nicotine, Nicotyrine Concentration, and Nicotyrine/Nicotine Ratio of Studied E-Liquids
| nicotine level | |||||
|---|---|---|---|---|---|
| component | base material | 3.0 mg/mL | 12 mg/mL | 24 mg/mL | 36 mg/mL |
| nicotine (mg/mL) | VG | 2.95 ± 0.03 | 11.8 ± 0.16 | 23.6 ± 0.27 | 35.5 ± 0.52 |
| PG:VG = 1:1 (v:v) | 3.04 ± 0.05 | 12.1 ± 0.14 | 24.2 ± 0.30 | 36.2 ± 0.39 | |
| PG | 3.05 ± 0.05 | 12.1 ± 0.15 | 24.3 ± 0.38 | 36.3 ± 0.60 | |
| nicotyrine (μg/mL) | VG | 25.4 ± 6.35 | 147. ± 7.91 | 376. ± 27.8 | 642. ± 70.6 |
| PG:VG = 1:1 (v:v) | 22.4 ± 1.69 | 150. ± 16.7 | 409. ± 20.7 | 723. ± 102. | |
| PG | 22.2 ± 2.86 | 198. ± 12.6 | 391.6 ± 18.2 | 704.8 ± 49.8 | |
| nicotyrine/nicotine | VG | 0.009 ± 0.002 | 0.012 ± 0.001 | 0.016 ± 0.001 | 0.018 ± 0.002 |
| PG:VG = 1:1 (v:v) | 0.007 ± 0.000 | 0.012 ± 0.001 | 0.017 ± 0.001 | 0.020 ± 0.003 | |
| PG | 0.007 ± 0.001 | 0.016 ± 0.001 | 0.016 ± 0.001 | 0.019 ± 0.002 | |
Nicotyrine artifacts during the sampling process were assessed by comparing the amount of nicotryine formed with different amounts of air pulled through the filter containing the known amounts of nicotine and nicotyrine to determine if additional oxidation of nicotine occurred during collection. Exposure to air during sampling facilitated the conversion of nicotine to nicotyrine on the filter (Figure 1a). Nicotyrine levels increased by 60.6% after introducing 20 puffs of 170 mL air (p < 0.001), while 20 puffs of 35 or 90 mL air did not significantly increase nicotyrine levels (p > 0.451). The percentage of nicotine converted to nicotyrine was inversely related to its concentration in the e-liquid with the introduction of the same amount of clean air, though the actual amount of nicotyrine increased with increasing e-liquid nicotine levels (Figure 1b). The average nicotyrine levels after introducing 50 puffs of 90 mL air were 230%, 50%, 38%, and 15% higher than originally present in fresh e-liquids containing 3.0, 12, 24, and 36 mg/mL nicotine, respectively (p < 0.007). In this study, the reported nicotyrine concentrations are corrected for the artifacts identified during the sampling process. The correction method is detailed in the Supporting Information.
Figure 1.
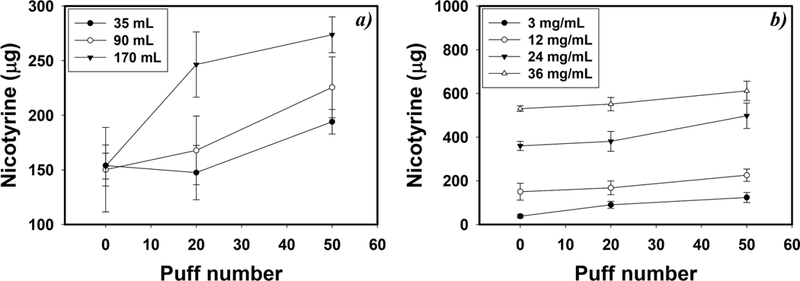
Nicotyrine concentrations after introducing 20 and 50 puffs of clean air under different conditions: (a) clean air flowing through a filter spiked with 50μL VG-based e-liquids containing 12 mg/mL nicotine, under different puff volumes and 3.8 s duration, and (b) clean air flowing through a filter spiked with 50 μL VG-based e-liquids containing various amounts of nicotine, under 90 mL puff volumes and 3.8 s duration (n = 5, and error bars are standard deviations of 5 independent measurements).
Factors Affecting E-Vapor Nicotine and Nicotyrine Levels.
VG-based e-liquids emitted 8.0- and 10-fold more nicotine and nicotyrine, respectively, than PG based e-liquids (p < 0.001) (Figure 2). In general, the amount of nicotine in e-vapor was proportional to the e-liquid nicotine concentration. e-liquids containing 12 mg/mL nicotine generated a significantly higher amount of nicotyrine than e-liquids containing 3.0 mg/mL nicotine (p < 0.001), while e-liquids with 12, 24, and 36 mg/mL nicotine showed similar nicotyrine production. On average, the nicotyrine/nicotine ratio for e-vapor was 5.7-fold higher than that for the corresponding e-liquid.
Figure 2.
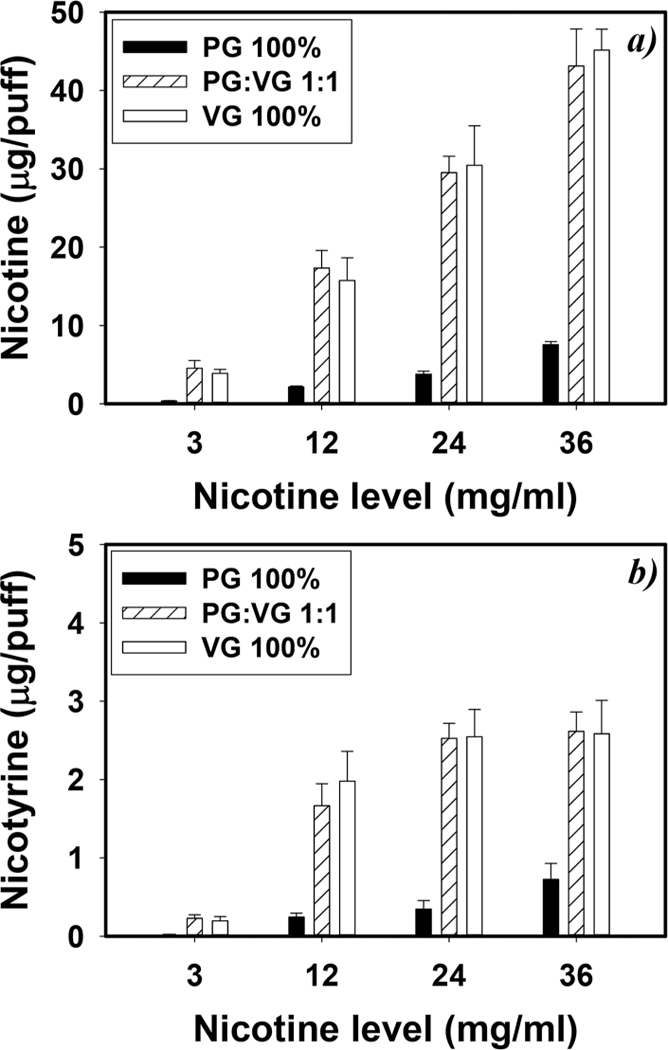
Impact of e-liquid compositions on (a) nicotine and (b) nicotyrine concentrations. E-vapors were generated as 90 mL and 3.8 s puffs with a 24 s puff interval, under 6.4 W power output (n = 5, and error bars are standard deviations of 5 independent measurements).
Compared with the 6.4 W condition, high e-cigarette device powers (14.7 or 31.3 W) significantly increased e-vapor nicotine and nicotyrine concentrations (p < 0.001) (Table 2). The 31.3 W power output generated 15 and 1.7-fold higher amounts of nicotine in e-vapor than the 6.4 and 14.7 W conditions, respectively (p < 0.001). The 14.7 and 31.3 W power outputs generated 6.0 and 5.5 times more nicotyrine than the 6.4 W power output (p < 0.001). The nicotyrine/ nicotine ratio in e-vapor was 0.049 under 31.3 W, and significantly increased under 6.4 W (ratio = 0.129) and 14.7 W (ratio = 0.092) (p < 0.001).
Table 2.
Nicotine, Nicotyrine, Nicotyrine/Nicotine Ratio, and E-Vapor Mass of e-Cigarette Vapor Generated under Different E-Cigarette Device Power Outputs (n = 5, Mean ± Standard Deviation)
| device powera | |||
|---|---|---|---|
| component | 6.4 W | 14.7 W | 31.3 W |
| nicotine (μg/puff) | 16.3 ± 1.44 | 137. ± 6.72 | 236. ± 14.0 |
| nicotyrine (μg/puff) | 2.11 ± 0.51 | 12.7 ± 0.34 | 11.6 ± 0.35 |
| nicotyrine/nicotine | 0.129 ± 0.043 | 0.092 ± 0.030 | 0.049 ± 0.005 |
Other conditions were 90 mL puff volume, 3.8 s puff duration, and 24 s puff interval with VG-based e-liquid with 12 mg/mL nicotine.
A longer puff duration increased e-vapor nicotine and nicotyrine levels (Figure 3). A 3.8 s puff generated 3.3 to 6.9-fold higher nicotine and 9.6 to 12-fold higher nicotyrine concentrations than a 2 s puff (p < 0.001). A higher puff volume also increased e-vapor nicotine and nicotyrine concentrations. Compared with a 35 mL puff, a 170 mL puff (3.8 s) increased nicotine and nicotyrine concentrations by 126% and 21.0% (p < 0.020).
Figure 3.
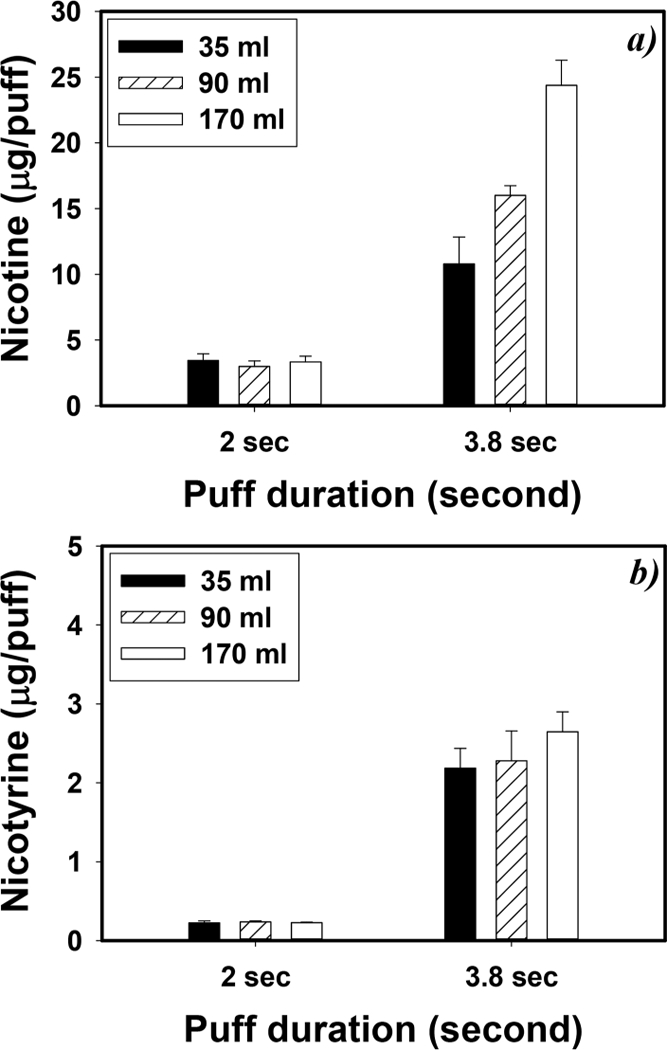
Impact of vaping topographies on (a) nicotine and (b) nicotyrine concentrations. E-vapors were generated under 6.4 W power output and 24 s puff interval with VG-based e-liquid with 12 mg/mL nicotine (n = 5, and error bars are standard deviations of 5 independent measurements)
pH Measurements.
The pH value of e-vapor ranged from 8.09 to 9.52. For e-liquids containing 3.0, 12, 24, and 36 mg/ mL nicotine, the e-vapor pH values were 8.67 ± 0.02, 9.11 ± 0.01, 9.26 ± 0.02, and 9.51 ± 0.01, respectively, for PG and VG-based e-liquids; 8.65 ± 0.02, 9.11 ± 0.02, 9.28 ± 0.02, and 9.52 ± 0.02, respectively, for VG-based e-liquids; and 8.09 ± 0.02, 8.47 ± 0.01, 8.56 ± 0.01, and 8.98 ± 0.01, respectively, for PG-based e-liqiuds. Higher nicotine levels led to higher pH values. Under the same nicotine content, PG and VG mixture and VG-based e-liquids showed higher pH values than PG-based e-liquids (p < 0.001).
DISCUSSION
This study evaluated the impact of e-liquid composition, e-cigarette device settings, and vaping topography on nicotine and nicotyrine concentrations in e-vapor. Nicotyrine is a major thermal reaction product of nicotine which could inhibit nicotine metabolism, increase serum nicotine level, and, as a result, potentially decrease e-cigarette craving. The inhibited nicotine metabolism might also reduce craving for regular cigarettes, resulting in lower risks for relapse among those using e-cigarettes to quit smoking (or maintain smoking cessation). This study contributes to the literature on this limited topic by examining nicotine and nicotyrine formation under a variety of real-world e-cigarette use patterns.
Impacts of Sampling Artifacts.
First of all, it should be noted that future research studies quantifying nicotyrine concentrations in e-vapor should consider sampling artifacts. Nicotyrine can be formed during e-liquid preparation through the reaction between nicotine and air. In our study, we found that the nicotyrine/nicotine ratio of high-purity nicotine solution was <0.01, and the nicotyrine/nicotine ratio was 0.01–0.02 for freshly made e-liquids in our lab. Another study indicated that exposing e-liquids (PG:VG mixture with 18 mg/ mL nicotine with tobacco flavor) to air increased nicotyrine/ nicotine ratio from 0.03 to 0.04 to 0.08–0.09 after 65 days.10 The air flowing through the sample filters facilitated nicotyrine formation, and we observed a linear relationship (r2 = 0.802) between the nicotyrine formation and the volume of air introduced (Figure S5). Sampling artifacts contributed from 6.6 to 37% of the measured nicotyrine. Therefore, investigators should carefully consider the levels of the nicotyrine present in the e-liquids being used and formed during sample collection.
Impacts of Vaping Patterns on E-Vapor Nicotine and Nicotyrine.
We found that the nicotine and nicotyrine concentrations in the e-vapor were determined by e-liquid base materials and nicotine levels in e-liquid. E-liquids with higher nicotine contents resulted in higher nicotine and nicotyrine concentrations in e-vapor. VG and PG and VG-based e-liquids generated significantly higher amounts of nicotine and nicotyrine than PG-based e-liquid. VG and nicotine have similar evaporation rates due to their similar boiling points: 247 °C for nicotine and 290 °C for VG. However, PG has a much lower boiling point (188.2 °C) than nicotine and can be quickly evaporated, which can decrease the vaporization of nicotine. Kosmider et al.25 reported that PG-based e-liquids delivered more nicotine than VG e-liquids under low power outputs (4.3–6.7 W), while there was no difference at higher power output conditions using the single top-coil device. The different impact of PG and VG-based e-liquid on nicotine delivery reported here and in the previous study might be due to the e-cigarette construction and vaping topography. This study used a dual bottom-coil device which has higher coil temperatures and better e-liquid supply to the coil than the top-coil device.26 A higher coil temperature could help to facilitate VG evaporation. Vaping topography was also shown to have a significant impact on nicotine delivery.5 The vaping volume (50 mL) and puff duration (2 s) used in the previous report25 was much lower than those actually used by e-cigarette users14–19 and the vaping topography used in this study (90 mL and 3.8 s puff duration). It is likely that the shorter puff duration (2 s) was not sufficient to increase coil temperature27 to effectively evaporate the VG-based e-liquid. Future studies are needed to further assess nicotine delivery under real-world relevant vaping conditions with different e-cigarette coil settings.
Nicotine delivery ratios were calculated using the ratios between the nicotine concentrations of e-vapors (mg/mL) and the e-liquid nicotine concentrations (mg/mL). E-vapor nicotine concentrations in mg/mL were calculated using the measured nicotine concentration and the collected e-vapor mass and density (Table S6). The average nicotine delivery ratio of PG (0.92) was much higher than that of VG (0.72) and PG:VG (0.86) e-liquids. More particle phase VG might be expected than nicotine because the vapor pressure of VG (0.01 Pa) is much lower than nicotine (5 Pa). In contrast, PG tends to be present in the gas phase due to its higher vapor pressure (20 Pa). Geiss et al.28 also reported lower nicotine delivery ratio for VG-based e-liquid collected on a filter paper than PG and VG mixed e-liquid. Despite the higher nicotine delivery of PG-based e-liquid, our findings suggest that users may perceive greater nicotine delivery and satisfaction from VG-based e-liquid, which may, therefore, better aid in smoking cessation attempts. In addition, VG-based e-liquid may help to promote public health since VG-based e-liquids generate much less toxic chemicals (e.g., formaldehyde and acetaldehyde) than PG e-liquids.26
Larger puff volumes increased e-vapor nicotine and nicotyrine concentrations. More air flowing through e-cigarette coils facilitates the evaporation of e-liquids.5 In contrast, we observed that lower puff volumes facilitated nicotyrine formation by changing the retention time within the cartomizer. Increasing retention time provides a longer reaction time between nicotine and the air around the cartomizer, leading to higher levels of nicotyrine formation.
Higher device power outputs also increased nicotine levels in e-vapor. Higher device power increases the coil temperature which promotes e-liquid and nicotine evaporation.5 Our study also showed that higher power output resulted in more nicotyrine formation. The thermal decomposition of nicotine to nicotyrine is temperature dependent.7 Between 200 and 400 °C, the nicotine to nicotyrine conversion efficiency is proportional to temperature increase. However, above 400 °C, the nicotyrine yield is significantly decreased with increasing temperature.7 The coil temperature in our study was measured using a K-type thermocouple (130.6 °C, 199.1 °C, and 223.9 °C at 6.4, 14.7, and 31.3 W, respectively), and the measured temperature was lower than the optimal nicotine to nicotyrine reaction temperature of 400 °C. In addition, the 14.7 W condition showed slightly higher nicotyrine formation than the 31.3 W condition. Higher nicotyrine concentration at the 14.7 W condition indicates that the presence of oxygen with heat catalyzed nicotine to nicotyrine conversion at a lower temperature than 400 °C. However, the coil temperature measurements in our study might underestimate the actual temperature due to the inherent systemic bias of thermocouples, which have been reported to be biased toward low up to 300 °C.29 Further research with more precise temperature control and measurement devices should be conducted to study the nicotyrine formation during e-cigarette vaping.
E-Vapor pH Levels.
The pH value is a critical factor that changes gas/particle partitioning of nicotine and its absorption. The measured e-vapor pH values were between 8.09 and 9.52. This coincides with reported pH values that ranged from 7.3 to 9.3 for e-liquids containing 6.0–24 mg/mL nicotine and other flavors, while e-liquids without nicotine showed much lower pH values (5.1–6.4).30 At basic conditions (pH ≥ 8), nicotine (pKa = 8.02) is predominantly present in its unprotonated form (Nic), which facilitates the absorption of nicotine through biological membranes.23 In addition, only unprotonated nicotine can be vaporized into the gas phase, which increases deep lung deposition.24 In contrast, the pH of cigarette smoke extract is slightly lower than that of e-vapor. The reported cigarette smoke pH values ranged between 5.8 and 7.8 for 11 brands of commercial cigarettes and the 1R4F “Kentucky reference cigarette”.24 Monoprotonated nicotines (NicH+) dominate under this pH range and are mainly present in the particle phase.23 Most of the particle phase nicotine is deposited in the upper respiratory track due to the cloud effect, which significantly increases submicron particle deposition in the proximal airways.31 However, the absorption of NicH+ through the lung epithelium was less efficient than Nic.23
Health Implications.
e-cigarettes and combustion-based tobacco products could deliver comparable amounts of nicotine per puff. We observed nicotine concentrations in e-vapor ranging from 0.365 μg/puff to 236 μg/puff depending on e-liquid compositions, device power settings, and vaping topographies. The reported nicotine concentrations in e-vapor ranged from 0.107 μg/puff to 530 μg/puff,4,5,10,11,32 which is in the same order of magnitude as our measurements. For comparison, nicotine concentrations in cigarette smoke has been reported to be up to 232 μg/puff.33,34
It is likely that e-cigarette vaping could deliver a significantly higher amount of nicotyrine than conventional cigarette smoking. Previous studies reported that experienced e-cigarette users change their vaping patterns (e.g., number of puffs, e-liquid nicotine concentration, device power output, and vaping topography) to achieve similar levels of plasma nicotine as conventional cigarette smokers.35 Given the same nicotine intake, e-cigarette users can be exposed to 2–63 times more nicotyrine than conventional cigarette smokers because the nicotyrine/nicotine ratio for e-vapor and the combustion tobacco smoke ranged from 0.025 to 0.202 and from 0.003 to 0.013, respectively.10,11,33,36
Nicotyrine in e-vapor might indirectly help e-cigarette users to take fewer puffs to satisfy their nicotine craving, leading them to inhale fewer potentially harmful chemicals emitted from e-cigarettes. Nicotyrine inhibits human cytochrome P450 isoforms (i.e., CYP2A13 and CYP2A6) slowing serum nicotine metabolism, thus increasing nicotine’s biological half-life.37,38
Consequently, e-cigarette users might feel satisfied with a fewer number of vaping sessions, resulting in lower harmful chemical exposures such as formaldehyde and acetaldehyde.6 The nicotyrine dose delivered in e-vapor could result in higher serum nicotine levels potentially helping make e-cigarettes an effective alternative to regular cigarettes to satisfy nicotine cravings. As a result, nicotyrine might decrease lung cancer risks associated with the tobacco-specific nitrosamines (TSNAs) by inhibiting the bioactivation of TSNAs.39,40
On the other hand, delayed nicotine metabolism could potentially facilitate exposure to some level of cancer risk through the stimulation of nicotinic acetylcholine receptors (nAchRs).41 nAchRs have been shown to bind with nicotine, N−nitrosonornicotine (NNN), or 4−(methylnitrosamino)−1−(3- pyridyl)−1-butanone (NNK).42 Bindings of the nAchRs with these ligands can increase cell growth, inhibit apoptosis, and thus promote malignant cell growth.43 Therefore, nicotine and/or TSNAs can act as tumor promoters with nAchRs facilitating an outgrowth of cells.41
To better understand the health impacts of nicotyrine, the pharmacokinetics of nicotine and nicotyrine need to be further evaluated. Measured nicotyrine concentrations in our study were shown to be 5–40 times lower than that of nicotine. However, the low concentrations of nicotyrine could out-compete those of nicotine due to their much higher binding affinity to CYP2A6 (Ki = 0.37 μM) compared to nicotine (Ki = 4.4 μM).37 Indeed, nicotyrine showed the highest CYP2A6 inhibition capacity among the nicotine-related alkaloids.37
Unfortunately, it is not currently possible to determine whether the measured nicotyrine concentrations in e-vapor are sufficient to inhibit nicotine metabolism because, to the best of our knowledge, there are no studies on nicotyrine absorption and distribution through the human airway. Studies of nicotine and nicotyrine concentrations in plasma and liver would help elucidate the effectiveness of smoking cessation approaches using e-cigarettes.
It is worth mentioning that several flavoring chemicals have been shown to inhibit nicotine metabolism in vitro.44 Menthol, one of the most popular flavors of both e-cigarettes and combusted tobacco products can inhibit CYP2A6 and CYP2A13-mediated nicotine metabolism.38 Other flavoring chemicals including nootkatone, coumarin, and tryptamine from grapefruit, cinnamon, and acacia, respectively, could also reduce CYP2A6 enzyme activity.44 The impact of flavoring ingredients on nicotine metabolism remains to be evaluated. Although flavoring chemicals are not a major component of regular tobacco cigarettes, they are prominently used in e-cigarette products/e-liquids.
In conclusion, this study measured nicotine and nicotyrine concentrations in e-vapor under real-world vaping patterns. Higher e-liquid nicotine levels, higher device power settings, and larger puff volumes contributed to higher amounts of nicotine and nicotyrine emissions. Nicotine levels in e-vapor observed in our study were lower than or comparable to nicotine levels in cigarette smoke, while the observed nicotyrine concentrations per unit amount of nicotine emission were significantly greater than that of cigarette smoke. Given that nicotyrine is a known inhibitor of nicotine metabolism, the results of this study suggest that the presence of higher nicotyrine in e-vapor may facilitate e-cigarette becoming an effective alternative to regular cigarettes for cigarette smokers to satisfy nicotine cravings. The production of nicotyrine during e-cigarette vaping and its impact on nicotine metabolism need to be further assessed to explore its potential effect on behavior and health outcomes.
Supplementary Material
Acknowledgments
Funding
This study was supported by the Cancer Institute of New Jersey, the New Jersey Health Foundation, and the National Institute of Environmental Health Sciences (P30ES005022). Contributions by O.W. were supported in part by K01CA189301 from the National Cancer Institute and the FDA Center for Tobacco products. S.S. was supported by National Institute of Environmental Health Sciences (5R01ES020382). The content is solely the responsibility of the authors and does not necessarily represent the official views of the funding organizations.
ABBREVIATIONS
- CYP2A13
cytochrome P450 2A13 protein
- CYP2A6
cytochrome P450 2A6 protein
- nAchRs
nicotinic acetylcholine receptors
- Nic
unprotonated nicotine
- NicH+
monoprotonated nicotine
- NNN
N-nitrosonornicotine
- NNK
4−(meth-ylnitrosamino)−1−(3-pyridyl)-1-butanone
- TSNAs
tobacco-specific nitrosamines
- PG
propylene glycol
- VG
vegetable glycerin
Footnotes
ASSOCIATED CONTENT
Supporting Information
The Supporting Information is available free of charge on the ACS Publications website at DOI: 10.1021/acs.chemrestox.8b00063.
Vaping topography measurements, detailed experimental conditions and method, calibration factors for the sampling artifacts, and results under different experimental conditions (PDF)
Notes
The authors declare no competing financial interest.
REFERENCES
- (1).Schoenborn CA, and Gindi RM (2016) QuickStats:Cigarette Smoking Status Among Current Adult E-cigarette Users by Age Group —National Health Interview Survey, MMWR Morbidity Mortality Weekly Report, Centers for Disease Control and Prevention, Atlanta, GA. [Google Scholar]
- (2).Glasser AM, Collins L, Pearson JL, Abudayyeh H, Niaura RS, Abrams DB, and Villanti AC (2017) Overview of electronic nicotine delivery systems: a systematic review. Am. J. Prev. Med. 52, e33–e66. [DOI] [PMC free article] [PubMed] [Google Scholar]
- (3).Wackowski OA, Bover Manderski MT, Delnevo CD, Giovenco DP, and Lewis MJ (2016) Smokers’ Early E-cigarette Experiences, Reasons for Use, and Use Intentions. Tobacco Regul Sci. 2, 133–145. [DOI] [PMC free article] [PubMed] [Google Scholar]
- (4).Goniewicz ML, Kuma T, Gawron M, Knysak J, and Kosmider L (2013) Nicotine levels in electronic cigarettes. Nicotine Tob. Res. 15, 158. [DOI] [PubMed] [Google Scholar]
- (5).Talih S, Balhas Z, Eissenberg T, Salman R, Karaoghlanian N, El Hellani A, Baalbaki R, Saliba N, and Shihadeh A (2015) Effects of user puff topography, device voltage, and liquid nicotine concentration on electronic cigarette nicotine yield: measurements and model predictions. Nicotine Tob. Res. 17, 150–157. [DOI] [PMC free article] [PubMed] [Google Scholar]
- (6).Abramovitz A, McQueen A, Martinez RE, Williams BJ, and Sumner W (2015) Electronic cigarettes: The nicotyrine hypothesis. Med. Hypotheses 85, 305–310. [DOI] [PubMed] [Google Scholar]
- (7).Clayton P, Lu A, and Bishop L (2010) The pyrolysis of (−)-(S)-nicotine: Racemization and decomposition. Chirality 22, 442–446. [DOI] [PMC free article] [PubMed] [Google Scholar]
- (8).Wada E, Kisaki T, and Saito K (1959) Autoxidation of nicotine. Arch. Biochem. Biophys. 79, 124–130. [Google Scholar]
- (9).Stalhandske T, and Slanina P (1982) Nicotyrine inhibits in vivo metabolism of nicotine without increasing its toxicity. Toxicol. Appl. Pharmacol. 65, 366–372. [DOI] [PubMed] [Google Scholar]
- (10).Martinez RE, Dhawan S, Sumner W, and Williams BJ(2015) On-line chemical composition analysis of refillable electronic cigarette aerosol—measurement of nicotine and nicotyrine. Nicotine Tob. Res. 17, 1263–1269. [DOI] [PubMed] [Google Scholar]
- (11).Sleiman M, Logue JM, Montesinos VN, Russell ML, Litter MI, Gundel LA, and Destaillats H (2016) Emissions from electronic cigarettes: key parameters affecting the release of harmful chemicals. Environ. Sci. Technol 50, 9644–9651. [DOI] [PubMed] [Google Scholar]
- (12).(2013) Tutorial: Variable Voltage and Vaping Power Chart, Misthub, Buffalo Grove, IL (accessed July 11, 2018).
- (13).(2012) Routine analytical cigarette smoking machine - Definitions and standard conditions, International Organization for Standardization, Geneva, Switzerland (accessed July 11, 2018).
- (14).Dautzenberg B, and Bricard D (2015) Real-Time Characterization of E-Cigarettes Use: The 1 Million Puffs Study. J. Addict. Res. Ther. 06, 229. [Google Scholar]
- (15).Hua M, and Talbot P (2016) Potential health effects of electronic cigarettes: a systematic review of case reports. Preventive medicine reports 4, 169–178. [DOI] [PMC free article] [PubMed] [Google Scholar]
- (16).Meng Q, Schwander S, Son Y, Rivas C, Delnevo C, Graber J, Giovenco D, Bruen U, Mathew R, and Robson M (2016) Has the mist been peered through? Revisiting the building blocks of human health risk assessment for electronic cigarette use. Hum. Ecol. Risk Assess. 22, 558–579. [DOI] [PMC free article] [PubMed] [Google Scholar]
- (17).Norton KJ, June KM, and O’Connor RJ (2014) Initial puffing behaviors and subjective responses differ between an electronic nicotine delivery system and traditional cigarettes. Tob. Induced Dis. 12, 17. [DOI] [PMC free article] [PubMed] [Google Scholar]
- (18).Robinson R, Hensel E, Morabito P, and Roundtree K (2015) Electronic cigarette topography in the natural environment. PLoS One 10, e0129296. [DOI] [PMC free article] [PubMed] [Google Scholar]
- (19).Spindle TR, Breland AB, Karaoghlanian NV, Shihadeh AL, and Eissenberg T (2015) Preliminary results of an examination of electronic cigarette user puff topography: The effect of a mouthpiece-based topography measurement device on plasma nicotine and subjective effects. Nicotine Tob. Res. 17, 142. [DOI] [PMC free article] [PubMed] [Google Scholar]
- (20).Uchiyama S, Senoo Y, Hayashida H, Inaba Y, Nakagome H, and Kunugita N (2016) Determination of Chemical compounds generated from Second-generation E-cigarettes using a Sorbent Cartridge followed by a Two-step Elution Method. Anal. Sci. 32, 549–555. [DOI] [PubMed] [Google Scholar]
- (21).Swain ML, Eisner A, Woodward C, and Brice B (1949) Ultraviolet absorption spectra of nicotine, nornicotine and some of their derivatives. J. Am. Chem. Soc. 71, 1341–1345. [DOI] [PubMed] [Google Scholar]
- (22).Willits C, Swain ML, Connelly J, and Brice B (1950) Spectrophotometric determination of nicotine. Anal. Chem. 22, 430–433. [Google Scholar]
- (23).Benowitz NL, Hukkanen J, and Jacob P III (2009) Nicotine chemistry, metabolism, kinetics and biomarkers, In Nicotine Psychopharmacology, pp 29–60, Springer-Verlag, Berlin. [DOI] [PMC free article] [PubMed] [Google Scholar]
- (24).Pankow JF, Tavakoli AD, Luo W, and Isabelle LM (2003) Percent free base nicotine in the tobacco smoke particulate matter of selected commercial and reference cigarettes. Chem. Res. Toxicol. 16, 1014–1018. [DOI] [PubMed] [Google Scholar]
- (25).Kosmider L, Spindle TR, Gawron M, Sobczak A, and Goniewicz ML (2018) Nicotine emissions from electronic cigarettes: Individual and interactive effects of propylene glycol to vegetable glycerin composition and device power output. Food Chem. Toxicol. 115, 302–305. [DOI] [PMC free article] [PubMed] [Google Scholar]
- (26).Kosmider L, Sobczak A, Fik M, Knysak J, Zaciera M, Kurek J, and Goniewicz ML (2014) Carbonyl compounds in electronic cigarette vapors—effects of nicotine solvent and battery output voltage. Nicotine Tob. Res. 16, 1319–1326. [DOI] [PMC free article] [PubMed] [Google Scholar]
- (27).Zhao T, Shu S, Guo Q, and Zhu Y (2016) Effects of design parameters and puff topography on heating coil temperature and mainstream aerosols in electronic cigarettes. Atmos. Environ. 134, 61–69. [Google Scholar]
- (28).Geiss O, Bianchi I, Barahona F, and Barrero-Moreno J (2015) Characterisation of mainstream and passive vapours emitted by selected electronic cigarettes. Int. J. Hyg. Environ. Health 218, 169–180. [DOI] [PubMed] [Google Scholar]
- (29).Baker R (1974) Temperature distribution inside a burning cigarette. Nature 247, 405. [Google Scholar]
- (30).Lisko JG, Tran H, Stanfill SB, Blount BC, and Watson CH (2015) Chemical Composition and Evaluation of Nicotine, Tobacco Alkaloids, pH, and Selected Flavors in E-Cigarette Cartridges and Refill Solutions. Nicotine Tob. Res. 17, 1270. [DOI] [PMC free article] [PubMed] [Google Scholar]
- (31).Broday DM, and Robinson R (2003) Application of cloud dynamics to dosimetry of cigarette smoke particles in the lungs. Aerosol Sci. Technol. 37, 510–527. [Google Scholar]
- (32).Farsalinos KE, Yannovits N, Sarri T, Voudris V, and Poulas K (2016) Protocol proposal for, and evaluation of, consistency in nicotine delivery from the liquid to the aerosol of electronic cigarettes atomizers: regulatory implications. Addiction 111, 1069. [DOI] [PubMed] [Google Scholar]
- (33).Sakuma H, Kusama M, Yamaguchi K, and Sugawara S (1984) The distribution of cigarette smoke components between mainstream and sidestream smoke: III. Middle and higher boiling components. Beiträge zur Tabakforschung/Contributions to Tobacco Research 12, 251–258. [Google Scholar]
- (34).Tayyarah R, and Long GA (2014) Comparison of select analytes in aerosol from e-cigarettes with smoke from conventional cigarettes and with ambient air. Regul. Toxicol. Pharmacol. 70, 704–710. [DOI] [PubMed] [Google Scholar]
- (35).Dawkins LE, Kimber CF, Doig M, Feyerabend C, and Corcoran O (2016) Self-titration by experienced e-cigarette users: blood nicotine delivery and subjective effects. Psychopharmacology 233, 2933. [DOI] [PubMed] [Google Scholar]
- (36).Cai J, Liu B, Lin P, and Su Q (2003) Fast analysis of nicotine related alkaloids in tobacco and cigarette smoke by megabore capillary gas chromatography. Journal of Chromatography A 1017, 187–193. [DOI] [PubMed] [Google Scholar]
- (37).Denton TT, Zhang X, and Cashman JR (2004) Nicotine- related alkaloids and metabolites as inhibitors of human cytochrome P-450 2A6. Biochem. Pharmacol. 67, 751–756. [DOI] [PubMed] [Google Scholar]
- (38).Kramlinger VM, von Weymarn LB, and Murphy SE (2012) Inhibition and inactivation of cytochrome P450 2A6 and cytochrome P450 2A13 by menthofuran, β-nicotyrine and menthol. Chem.-Biol. Interact. 197, 87–92. [DOI] [PMC free article] [PubMed] [Google Scholar]
- (39).Kamataki T, Fujita K. i., Nakayama K, Yamazaki Y, Miyamoto M, and Ariyoshi N (2002) Role of human cytochrome P450 (CYP) in the metabolic activation of nitrosamine derivatives: application of genetically engineered Salmonella expressing human CYP. Drug Metab. Rev. 34, 667–676. [DOI] [PubMed] [Google Scholar]
- (40).Su T, Bao Z, Zhang Q-Y, Smith TJ, Hong J-Y, and Ding X (2000) Human cytochrome P450 CYP2A13: predominant expression in the respiratory tract and its high efficiency metabolic activation of a tobacco-specific carcinogen, 4-(methylnitrosamino)-1-(3-pyridyl)-1-butanone. Cancer Res. 60, 5074–5079. [PubMed] [Google Scholar]
- (41).Minna JD (2003) Nicotine exposure and bronchial epithelial cell nicotinic acetylcholine receptor expression in the pathogenesis of lung cancer. J. Clin. Invest. 111, 31. [DOI] [PMC free article] [PubMed] [Google Scholar]
- (42).Schuller HM, Jull BA, Sheppard BJ, and Plummer HK (2000) Interaction of tobacco-specific toxicants with the neuronal α 7 nicotinic acetylcholine receptor and its associated mitogenic signal transduction pathway: potential role in lung carcinogenesis and pediatric lung disorders. Eur. J. Pharmacol. 393, 265–277. [DOI] [PubMed] [Google Scholar]
- (43).West KA, Brognard J, Clark AS, Linnoila IR, Yang X, Swain SM, Harris C, Belinsky S, and Dennis PA (2003) Rapid Akt activation by nicotine and a tobacco carcinogen modulates the phenotype of normal human airway epithelial cells. J. Clin. Invest. 111, 81–90. [DOI] [PMC free article] [PubMed] [Google Scholar]
- (44).Hukkanen J, Jacob P, and Benowitz NL (2005) Metabolism and disposition kinetics of nicotine. Pharmacol. Rev. 57, 79–115. [DOI] [PubMed] [Google Scholar]
Associated Data
This section collects any data citations, data availability statements, or supplementary materials included in this article.