Sleep and wake globally impact brain physiology, from molecular changes1–4, neuronal activities to synaptic plasticity3–7. The sleep-wake homeostasis is maintained by generation of a sleep need that accumulates during waking and dissipates through sleep8–11. Homeostatic sleep regulation is a global, intrinsic and cumulative process ultimately involving most of brain cells/regions3,5,7, which is distinct from executive switching between sleep and wake states controlled by specific neural circuits12,13. We hypothesize that the molecular substrates of sleep need should satisfy four criteria: 1) globally and similarly regulated in most brain cells/regions; 2) accumulate gradually during waking and dissipate through sleep; 3) change in parallel with sleep need in different contexts; 4) gain/loss of functions of itself causes bidirectional changes of sleep need. Here we investigate the molecular basis of sleep need by quantitative phosphoproteomic analysis of whole mouse brain from two opposite models of increased sleep need. Sleep deprivation induces cumulative phosphorylation of brain proteome, which dissipates during recovery sleep. Strikingly, Sleepy (Sik3Slp/+) mutant brains, with constitutively high sleep need despite increased sleep amount, exhibit a hyper-phosphoproteome mimicking sleep-deprived brains, owing to a gain-of-function mutation of protein kinase SIK314. Comparison of two models identifies 80 mostly synaptic Sleep-Need-Index-PhosphoProteins (SNIPPs), whose phosphorylation states closely parallel changes of sleep need. Mutant SLEEPY/SIK3 kinase preferentially associates with and phosphorylates SNIPPs. Inhibition of SIK3 activity reduces phosphorylation state of SNIPPs and slow wave activity (SWA) during non-rapid-eye-movement sleep (NREMS), the best known measurable index of sleep need, in both Sleepy and sleep-deprived wild-type mice. Our results suggest that SNIPPs accumulate/dissipate phosphorylation as the molecular substrate of sleep need. While waking encodes memories by potentiating synapses, sleep consolidates memories and restores synaptic homeostasis by globally downscaling excitatory synapses4–6. Thus, phosphorylation/dephosphorylation cycle of SNIPPs may represent a major regulatory mechanism that underlies both synaptic homeostasis and sleep-wake homeostasis.
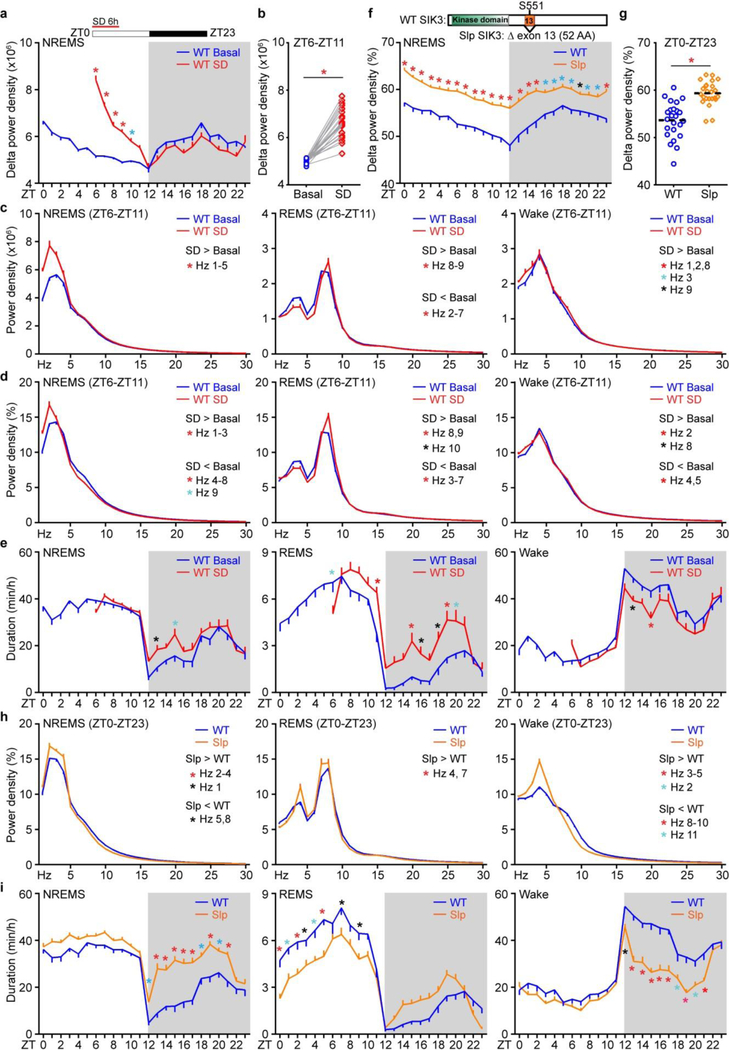
Sleep deprivation increases sleep need in mice, as shown by enhanced SWA or delta power (1–4 Hz) of electroencephalography (EEG) during NREMS, which declines rapidly to the baseline followed by rebound sleep in early dark phase8,10,14 (Fig. 1a, Extended data Fig. 1a–e). We recently identified a dominant Sleepy (Sik3Slp/+) mutant14, in which a single nucleotide mutation in Salt-inducible kinase 3 (Sik3), a member of the AMP-activated protein kinase family15, causes constitutively high sleep need, manifested by elevated SWA and duration of NREMS (Extended Data Fig. 1f–i). We hypothesized that cross-comparison of these two opposite models of increased sleep need would reveal specific molecular changes associated with sleep need by filtering out non-specific effects of prolonged sleep, wake and stress.
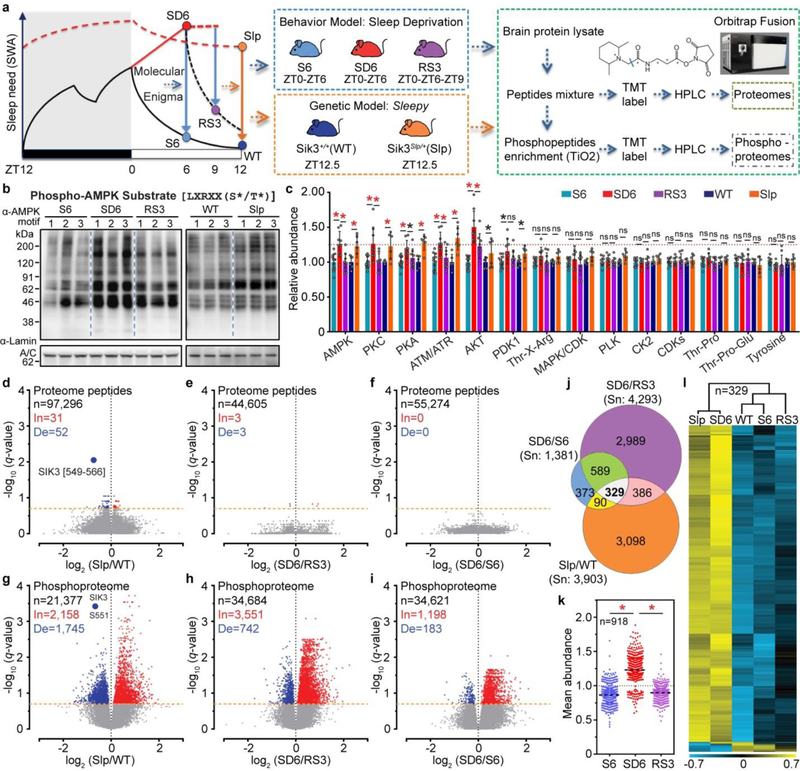
Figure 1 |. Sleepy brains exhibit hyper-phosphoproteome mimicking sleep-deprived brains.
a, Experimental design for proteomic/phosphoproteomic analysis of two models (Reprinted with permission of Thermo Fisher Scientific © 2018.) b, Representative phospho-AMPK motif antibody immunoblots [three (sleep-deprived) or two (Sleepy) independent experiments]. c, Quantitative analysis of 14 phospho-motif antibody immunoblots [n=12 (S6), 9 (SD6, RS3), 6 (WT, Slp)]. Mean ± s.d., two-way ANOVA, Fisher’s LSD. d-i, Volcano plots showing changes of peptides (d-f) and phosphopeptides (g-i) in Slp/WT, SD6/RS3, SD6/S6 groups. Multiple unpaired t-test (p-value) following FDR (q-value) analysis. j, Venn diagram of significantly changed phosphopeptides among three groups. k, Analysis of mean abundance of 918 phosphopeptides changed in both SD6/RS3 and SD6/S6 groups. Mean, one-way ANOVA, Dunnett’s. l, Hierarchical cluster analysis of 329 phosphopeptides changed in all three groups. *(black) P < 0.05; *(red) P < 0.001; ns, P > 0.05.
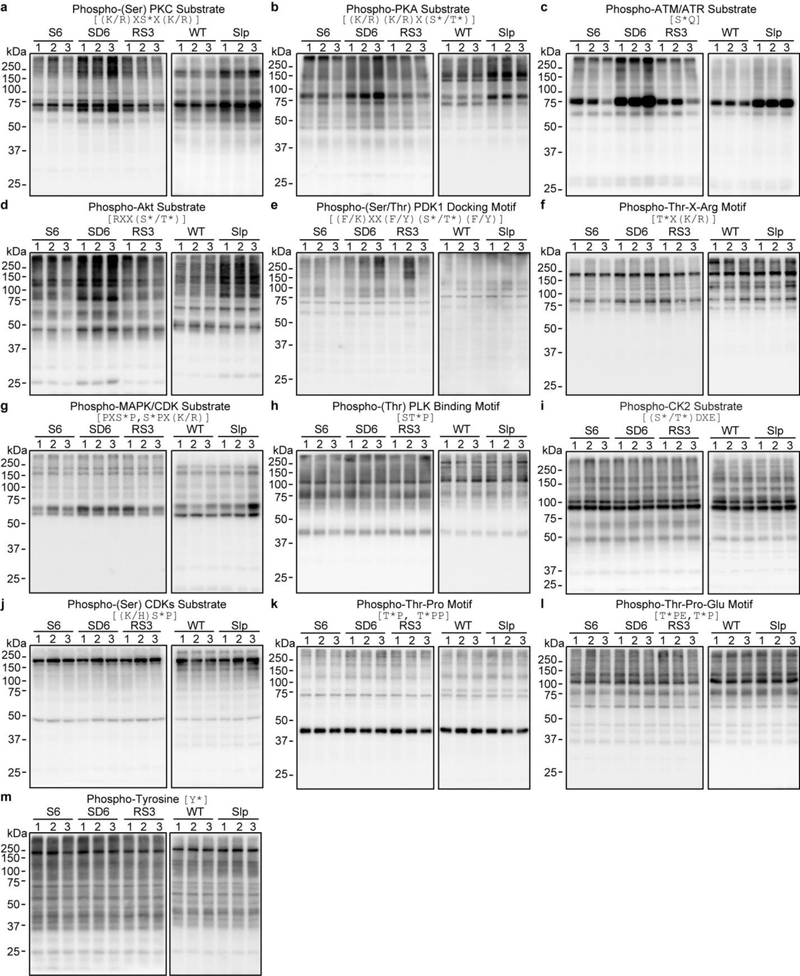
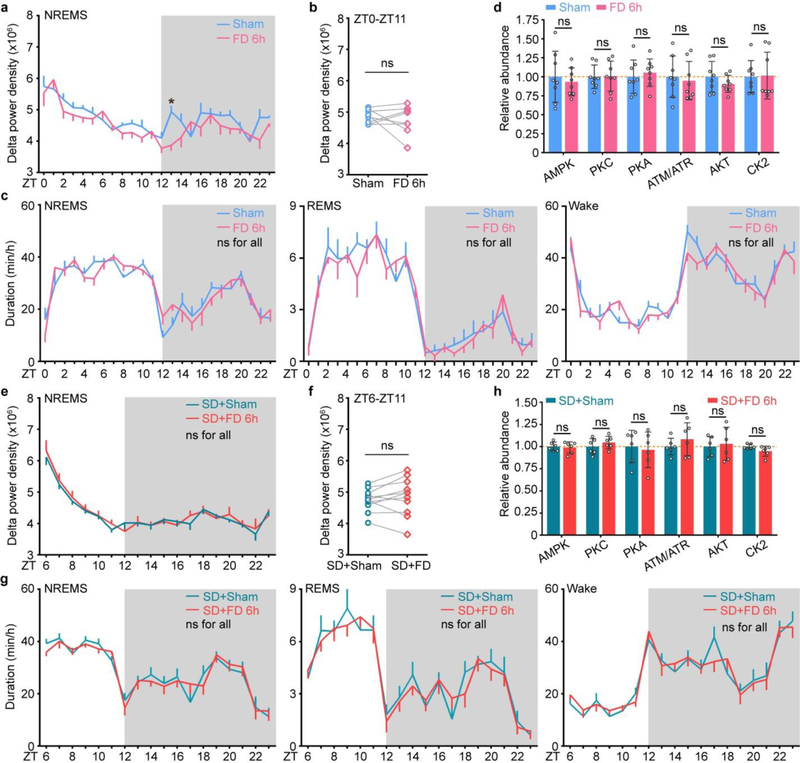
We subjected three groups of wild-type C57BL/6N mice at zeitgeber time (ZT) zero to six hours (6-h) of ad-libtum sleep (S6) or sleep deprivation (SD6), or 6-h sleep deprivation followed by 3-h recovery sleep (RS3), respectively (Fig. 1a). We collected Sik3+/+ and Sik3Slp/+ mouse brains at ZT12.5, the lowest point of SWA in wild-type mice (Fig. 1a). As shown by immunoblotting with 14 phospho-motif antibodies, global phosphorylation of substrates for AMPK, protein kinase C (PKC), protein kinase A (PKA), and Ataxia telangiectasia mutated (ATM)/ATM and Rad3-related (ATR) kinases was specifically increased in both Sleepy and SD6 brains, but not affected by fasting (Fig. 1b, c and Extended Data Fig. 2, 3). By contrast, other signaling pathways, such as casein kinase II (CK2) or tyrosine kinases, were not significantly affected (Fig. 1c and Extended Data Fig. 2). These observations indicate that similar kinase pathways are globally activated in Sleepy and sleep-deprived brains.
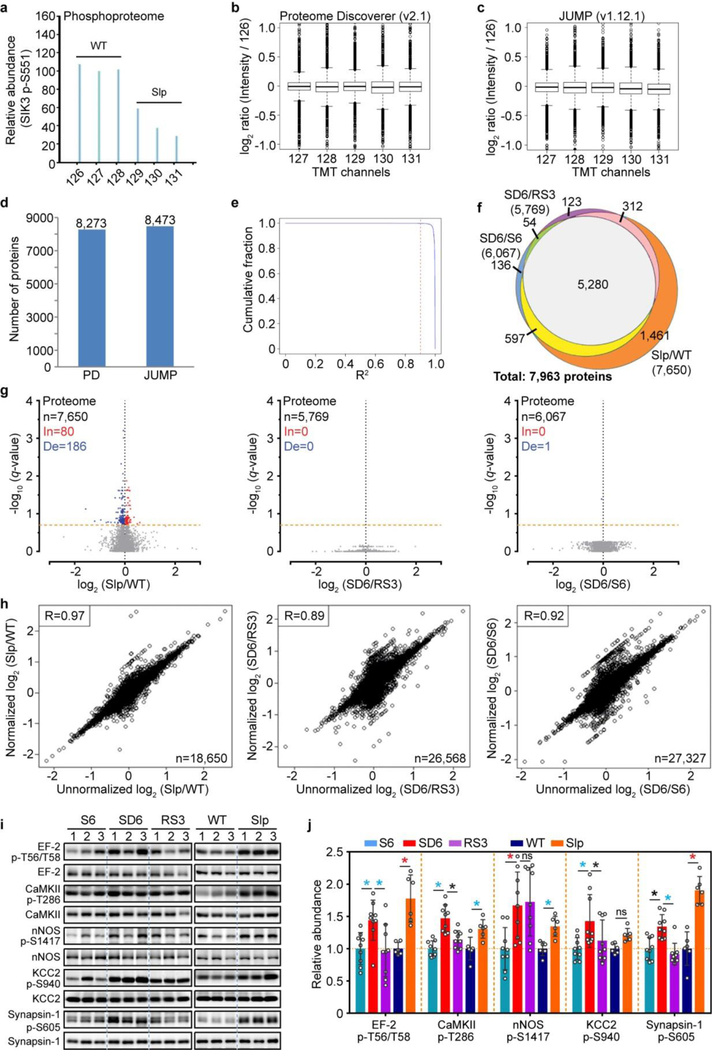
Next, we performed quantitative proteomic and phosphoproteomic studies of whole brain lysates using multiplex tandem mass tag (TMT)-labeling coupled with liquid chromatography-mass spectrometry (LC-MS)16–19 (Fig. 1a). A total of 4 proteomic and 13 phosphoproteomic experiments were performed (Supplementary Table 1, 2). As a stringent internal quality control, the amount of peptides or phosphopeptides from skipped exon 13 of Sik3Slp was specifically reduced by 40% in Sik3Slp/+ relative to Sik3+/+ samples (Fig. 1d, g and Extended Data Fig. 4a). In summary, proteomic analysis quantified 7,963 proteins, of which 5,280 are overlapped among the SD6/RS3 (5,769), SD6/S6 (6,067) and Slp/WT (7,650) groups (Extended Data Fig. 4b–h, Supplementary Table 1). Phosphoproteomic analysis quantified a total of 62,384 unique phosphopeptides from 7,104 phosphoproteins and identified 51,821 phosphorylation sites (Supplementary Table 2a).
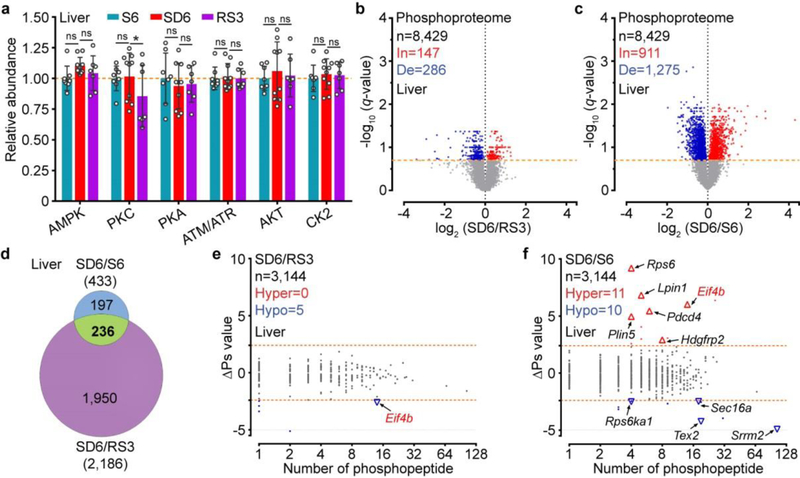
Few quantified peptides or proteins showed significant abundance changes (q < 0.2) in the Slp/WT (0.09%; 3.5%), SD6/RS3 (0.01%; 0%) or SD6/S6 (0%; 0.01%) proteome comparisons (Fig. 1d-f and Extended Data Fig. 4g), suggesting a global stability of whole brain proteome (Supplementary Discussion 1). In contrast, a sizable portion of phosphopeptides showed significant changes in the SD6/RS3 (12.4%), SD6/S6 (4%) and Slp/WT (18.3%) phosphoproteome comparisons (Fig. 1g–j). In sleep-deprived brains, the majority of phosphorylation changes are increases (In): SD6/RS3 (3,551/4,293 = 82.7%) or SD6/S6 (1,198/1,381 = 86.7%) (Fig. 1h, i). The mean abundance of 918 phosphopeptides that are changed in both SD6/RS3 and SD6/S6 groups was, respectively, ~32% or ~25% lower in S6 or RS3 brains than in SD6 brains (Fig. 1j, k). This asymmetric increase in phosphorylation was not observed in liver phosphoproteome after sleep deprivation (Extended Data Fig. 5). Rather, most phosphorylation changes in the liver are decreases (De): SD6/S6 (1,275/2,186 = 58.3%) and SD6/RS3 (286/433 = 66.1%) (Extended Data Fig. 5b, c). These studies suggest that sleep and wake promote opposite remodeling of brain phosphoproteome: prolonged wakefulness causes hyper-phosphoproteome, whereas sleep promotes global dephosphorylation of brain proteome.
Comparison of Sleepy and sleep-deprived models reveals 329 phosphopeptides that are significantly altered in all three (Slp/WT, SD6/S6, SD6/RS3) groups (Fig. 1j). According to the mean abundance of each of 329 phosphopeptides, unsupervised cluster analysis indicates that Sleepy samples nicely cluster with SD6 samples, whereas wild-type samples cluster with S6 and RS3 samples (Fig. 1l). We used phospho-site specific antibodies to validate hyper-phosphorylation of multiple proteins in both Sleepy and SD6 samples (Extended Data Fig. 4i, j). These results suggest that Sleepy mutant brains exhibit a hyper-phosphoproteome mimicking sleep-deprived brains.
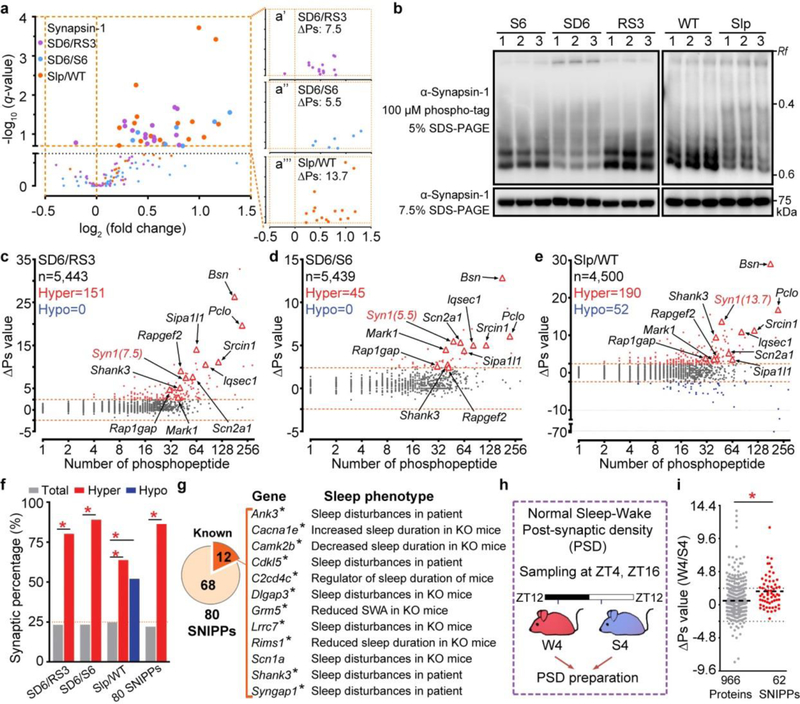
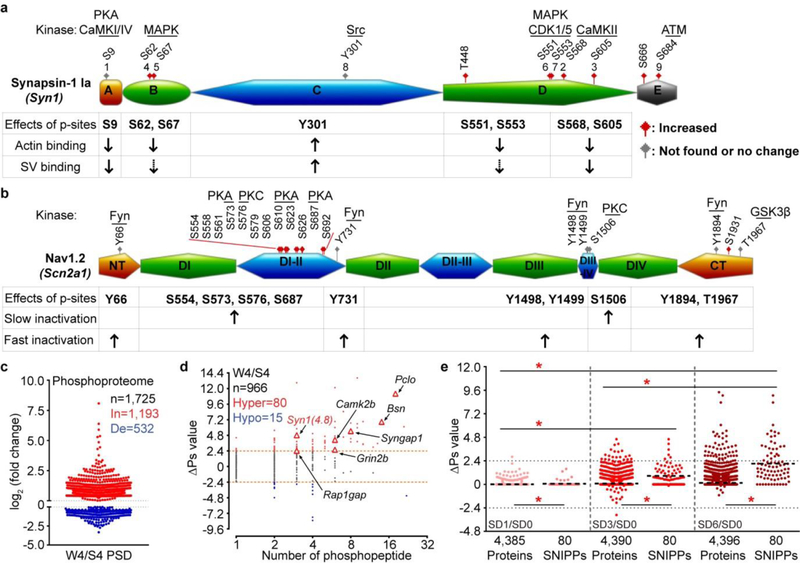
Protein functions can be switched on/off by site-specific phosphorylation, or modulated by cumulative phosphorylation of multiple sites20–23. We noted a group of proteins containing multiple phosphorylation sites that seemed to be coordinately regulated in both models (Extended Data Fig. 6a, b). For example, the synaptic vesicle protein Synapsin-1 contains multiple functionally important phosphorylation sites21,22, almost all of which are hyper-phosphorylated in sleep-deprived and Sleepy brains (Fig. 2a, Extended Data Fig. 6a). We devised a formula to measure overall phosphorylation state change (∆Ps) of Synapsin-1 by calculating the sum of log2 (fold change) values of all significantly changed phosphopeptides. Thus, Synapsin-1 exhibits a ∆Ps value of 7.5, 5.5 and 13.7 for the SD6/RS3, SD6/S6 and Slp/WT comparisons, respectively (Fig. 2a). Hyper-phosphorylation of Synapsin-1 in Sleepy and SD6 brain lysates was validated by phospho-tag gel electrophoresis (Fig. 2b).
Figure 2 |. Phospho-state changes of SNIPPs parallel changes of sleep need.
a, Volcano plots of quantified phosphopeptides of Synapsin-1 in SD6/RS3 (violet), SD6/S6 (blue) and Slp/WT (orange) comparisons. Multiple unpaired t-test (p-value) following FDR (q-value) analysis. b, Phosphorylation of Synapsin-1 was assessed by regular or phospho-tag gel electrophoresis followed by immunoblotting (two independent experiments). c-e, Global ∆Ps analysis of phosphoproteins in three comparisons. Dotted lines (∆Ps = +/−2.4). f, Percentage of synaptic proteins in total, Hypo-, Hyper-phosphoproteins and 80 SNIPPs. Chi-square test, two-sided. g, Mutations in 12 SNIPPs cause sleep phenotypes. Stars, synaptic proteins. h, A schematic of normal sleep/wake model4. i, Quantitative ∆Ps analysis of SNIPPs in W4/S4 model. [n=966 (total), 62 (SNIPPs)]. Mean, unpaired t-test, two-tailed. *(red) P < 0.001.
Next, we performed global ∆Ps analysis for all quantified phosphoproteins in our datasets (Fig. 2c-e and Supplementary Table 3). In sleep-deprived model, phospho-state of 151 (SD6/RS3) and 45 (SD6/S6) proteins is significantly up-regulated (Hyper, ∆Ps > 2.4) in SD6 brains relative to RS3 or S6 brains, respectively (Fig. 2c, d). In Sleepy model, phospho-state of 190 proteins is significantly up-regulated, whereas phospho-state of 52 proteins down-regulated (Hypo, ∆Ps < −2.4) in Slp/WT comparison (Fig. 2e). Cross-comparison of sleep-deprived and Sleepy models identified 80 Hyper-phosphoproteins, which we termed the Sleep-Need-Index-PhosphoProteins (SNIPPs), whose cumulative phospho-state changes parallel sleep need changes in both models (Extended Data Fig. 7a).
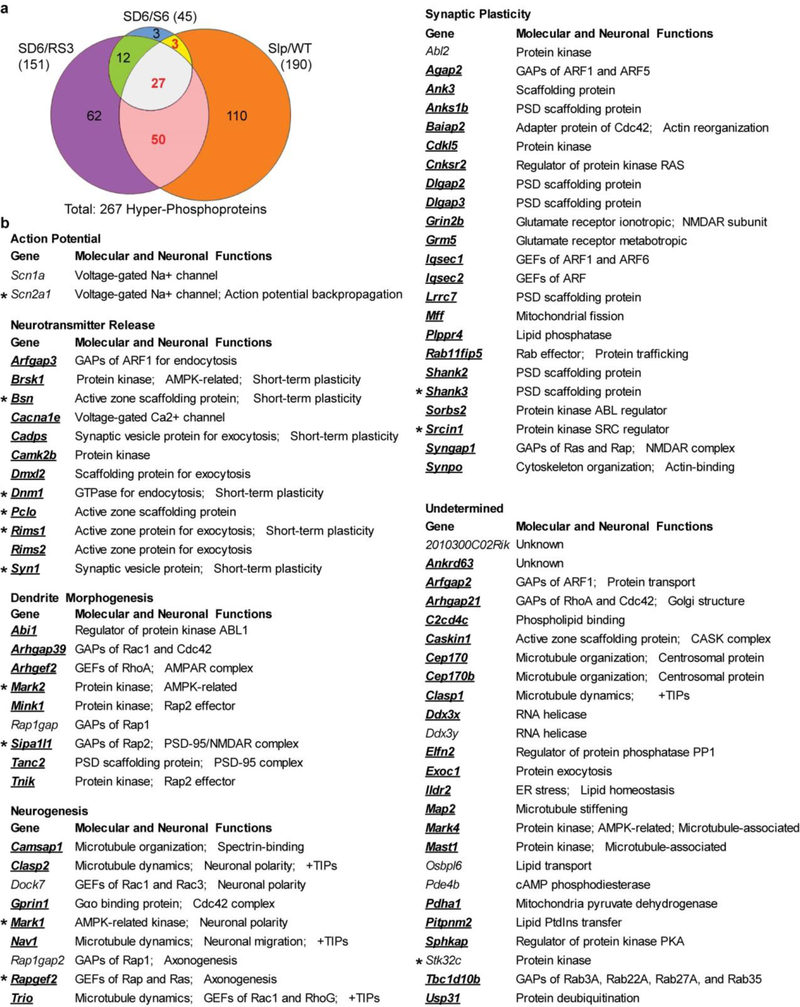
Notably, 69 (>86%) of 80 SNIPPs are annotated synaptic proteins, which only account for 20% of total phosphoproteins (Fig. 2f, Extended Data Fig. 7b and Supplementary Table 4a, b). Literature search reveals that mutations of 12 (15%) of 80 SNIPPs cause various sleep phenotypes in mice or humans (Fig. 2g, Supplementary Table 4a). Furthermore, we analyzed published phosphoproteomic data of post-synaptic density (PSD) fractions from mouse forebrains collected at normal sleep (ZT4) and wake (ZT16) states4 (Fig. 2h, Supplementary Table 5). Approximately 70% of phosphorylation changes in PSD are hyper-phosphorylation, and the mean ∆Ps value of 80 SNIPPs is significantly increased in accordance with higher sleep need in wake brains relative to slept brains (Fig. 2i, Extended Data Fig. 6c, d). These observations suggest a potential mechanistic link between synaptic phosphoproteome and homeostatic sleep regulation (Supplementary Discussion 2).
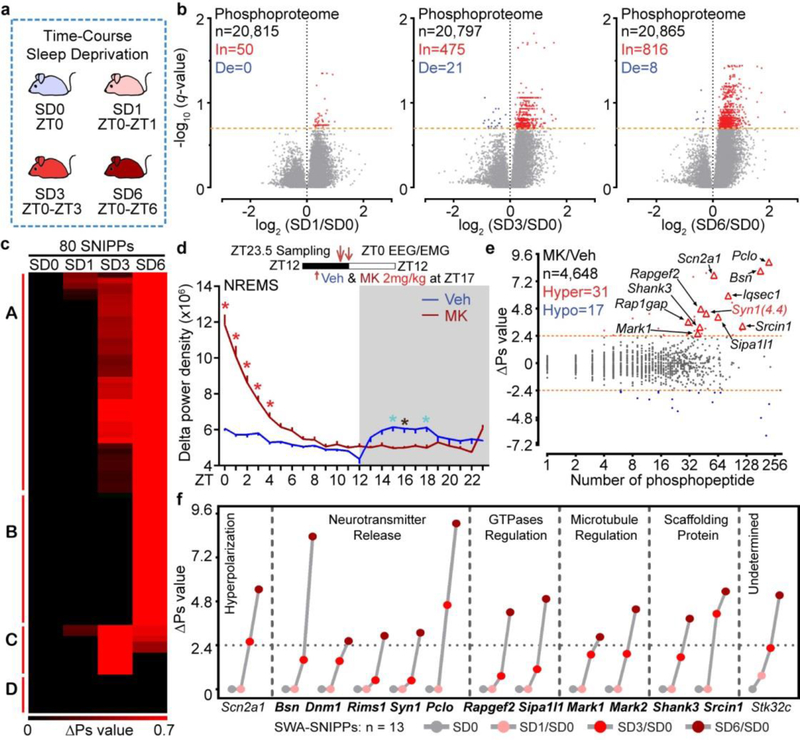
Because synaptic activities underlie waking experience, we hypothesize that SNIPPs track waking experience through cumulative phosphorylation. To test this hypothesis, we conducted a time-course sleep-deprivation followed by quantitative phosphoproteomic analysis (Fig. 3a). Comparison of SD1, SD3 or SD6 to SD0 samples reveals a dose-dependent increase in the number of phosphorylation events in whole-brain phosphoproteome (Fig. 3b). ∆Ps analysis indicates that mean phospho-state of 80 SNIPPs gradually rise with the duration of sleep deprivation (Extended Data Fig. 6e), with many SNIPPs showing time-dependent cumulative phosphorylation (Fig. 3c, Class A-C).
Figure 3 |. SNIPPs exhibit time-dependent cumulative phosphorylation.
a, A schematic of time-course sleep-deprivation. b, Volcano plots of SD1/SD0, SD3/SD0, SD6/SD0 phosphoproteome comparisons. Multiple unpaired t-test (p-value) following FDR (q-value) analysis. c, Temporal profile and classification of phospho-state changes of SNIPPs. d, Circadian analysis of absolute NREMS delta power of Vehicle (Veh) or MK801 (MK)-injected mice (n = 14). Mean ± s.e.m., two-way ANOVA, Sidak’s. *(black) P < 0.05; *(cyan) P < 0.01; *(red) P < 0.001. e, Global ∆Ps analysis of MK/Veh group. f, Time-dependent cumulative phosphorylation of 13 SWA-SNIPPs shared by Sleepy, SD and MK models. Synaptic proteins (bold).
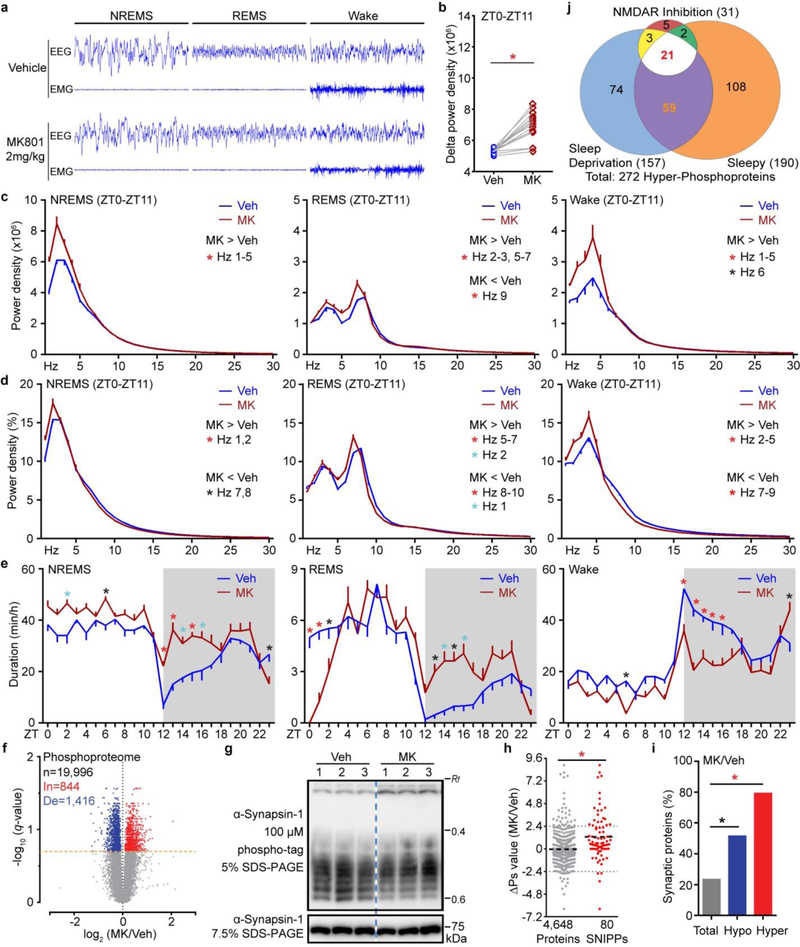
A specific inhibitor of N-methyl-D-aspartic receptor (NMDAR), MK801, has previously been identified as a potent inducer of SWA in rodents24–26. Our quantitative phosphoproteomic analysis of this pharmacological model identified 31 Hyper-phosphoproteins (∆Ps > 2.4), of which 25 (80%) are annotated synaptic proteins, in the MK801/Vehicle (MK/Veh) comparison (Fig. 3d, e and Extended Data Fig. 8). The MK801, Sleepy and sleep-deprived models share 21 SNIPPs (Extended Data Fig. 8j), of which 13 accumulate phosphorylation in a time-dependent manner (Fig. 3f). These 13 SWA-SNIPPs not only serve as a reliable “molecular beacon” for SWA/sleep need in multiple models, but also may contribute critically to regulation of SWA, a macro-electrophysiological readout of synaptic functions5,7 (Supplementary Discussion 3).
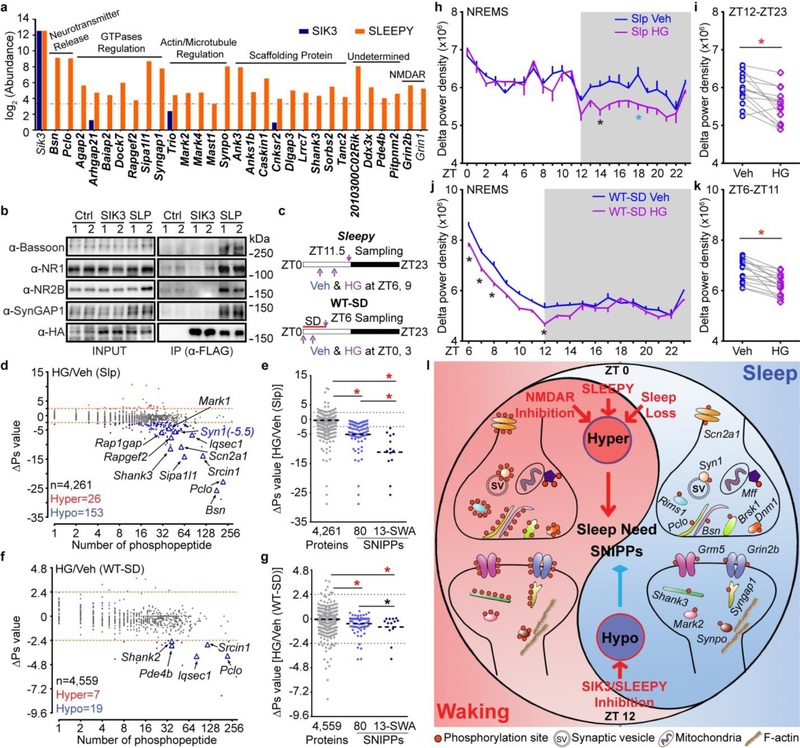
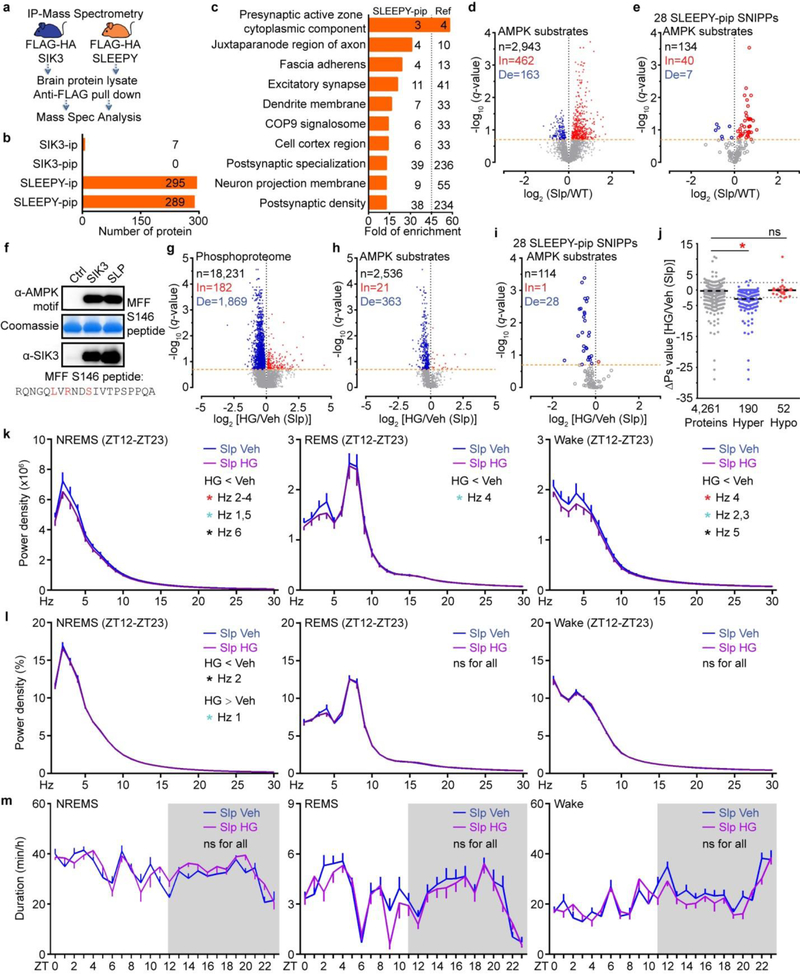
To examine whether SNIPPs are substrates of SLEEPY kinase, we compared the interactomes of SLEEPY and SIK3 by immunoprecipitation (IP) and mass spectrometric analysis using whole-brain lysates from the Flag-HA-Sik3+ and Flag-HA-Sik3Slp knock-in mice14 (Extended Data Fig. 9a, Supplementary Table 6). Accordingly, SLEEPY preferentially associated with synaptic proteins, including 28 of 80 SNIPPs (Fig. 4a and Extended Data Fig. 9b, c). IP-Western validated enhanced associations between SLEEPY and SNIPPs, such as pre-synaptic active zone protein Bassoon, synaptic Ras GTPase-activating protein 1 (SynGAP1), and NMDAR subunits NR2B and NR1 (Fig. 4b).
Figure 4 |. SLEEPY preferentially interacts with SNIPPs and alters sleep-wake homeostasis.
a, Comparison of mass-spec signals of SNIPPs in immunoprecipitates of SLEEPY and SIK3. b, IP-Western validates SLEEPY-SNIPPs interaction (two independent experiments). c, A schematic of SIK3 inhibition in Sleepy (Slp) and sleep-deprived wild-type (WT-SD) mice. d-g, Global (d, f) and quantitative (e, g) ∆Ps analysis of HG/Veh (Slp) and HG/Veh (WT-SD) groups. h-k Circadian (h, j) and mean (i, k) absolute NREMS delta power analysis of HG/Veh (Slp) (n = 14) and HG/Veh (WT-SD) (n = 16) groups. l, A molecular model of synaptic homeostasis and sleep-wake homeostasis. Mean, one-way ANOVA, Tukey’s (e, g); Mean ± s.e.m., two-way ANOVA, Sidak’s (h, j); Paired t-test, two-tailed (i, k). *(black) P < 0.05; *(cyan) P < 0.01; *(red) P < 0.001.
We applied the “AMPK Motif Analyzer27“ to predict 2,943 phosphopeptides as potential AMPK-like substrates in the Slp/WT phosphoproteome dataset (Extended Data Fig. 9d, Supplementary Table 4c). Among these, 625 phosphopeptides showed significant changes, of which 462 are hyper-phosphorylated, in Sleepy brains (Extended Data Fig. 9d). Particularly, the 28 SLEEPY-interacting SNIPPs contain 47 putative AMPK sites showing significant changes, of which 40 (85%) become hyper-phosphorylated, in Sleepy brains (Extended Data Fig. 9e). Recombinant SLEEPY and SIK3 exhibited similar in vitro kinase activities (Extended Data Fig. 9f), suggesting that SLEEPY is not a hyperactive kinase by itself. Taken together, these observations suggest that SLEEPY may increase phosphorylation of SNIPPs by enhancing kinase-substrate association.
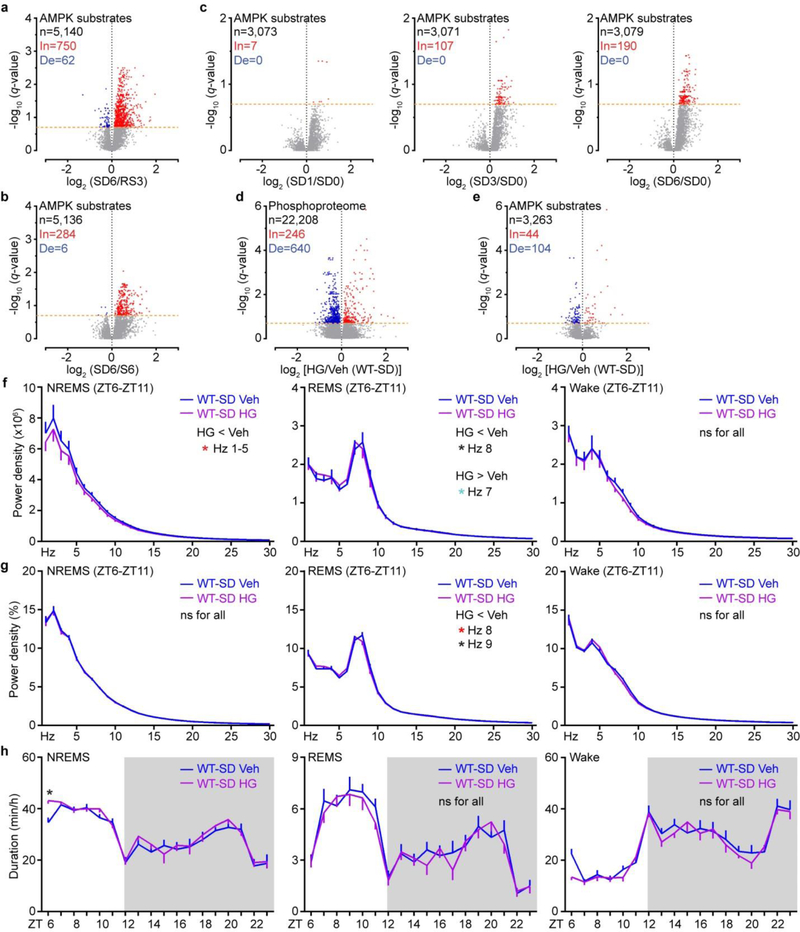
Next, we attempted to rescue the phenotypes of Sleepy mice by intracerebroventricular (ICV) injection of HG-9-91-0128 (HG) to inhibit SLEEPY/SIK3 kinase activity (Fig. 4c). Administration of HG significantly reduced phosphorylation of AMPK substrates, particularly those from 28 SLEEPY-interacting SNIPPs (Extended data Fig. 9g–i). Accordingly, inhibition of SLEEPY activity reduced phospho-state of SNIPPs and SWA, but not duration, of NREMS in Sleepy mice (Fig. 4d, e, h, i and Extended Data Fig. 9j–m). Similarly, inhibition of SIK3 activity reduced phosphorylation of AMPK substrates, phospho-state of SNIPPs and SWA of NREMS in sleep-deprived wild-type mice (Fig. 4f, g, j, k and Extended Data Fig. 10), suggesting a critical role of SIK3-SNIPPs in normal homeostatic sleep regulation.
We propose that a core set of SNIPPs monitor the duration/richness of prior waking through cumulative phosphorylation, which translates into a corresponding sleep need to determine the quality/duration of subsequent sleep11 (Fig. 4l, Supplementary Discussion 4). While prolonged wakefulness leads to cognitive impairment and sleepiness, sleep refreshes the brain through multiple restorative effects and optimizes cognitive functions for the next waking period5,7,9,11. Specifically, the synaptic homeostasis hypothesis (SHY) posits that waking encodes memories by potentiating synapses, whereas sleep consolidates memories and restores synaptic homeostasis by global downscaling of synaptic strength5. We hypothesize that the phosphorylation/dephosphorylation cycle of SNIPPs represent a major regulatory mechanism that underlies both synaptic homeostasis and sleep-wake homeostasis to maximize cognitive functions of the brain.
METHODS
General materials.
Tandem mass tag (TMT) isobaric reagents, water and organic solvents were purchased from Thermo Fisher Scientific (Rockford, IL, USA). Titansphere titanium dioxide (TiO2) beads were from GL Sciences (Tokyo, Japan). Phospho-tag was from Wako Pure Chemical Industries, Ltd. (Osaka, Japan). Unless otherwise noted, all other chemicals were from Sigma-Aldrich (St. Louis, MO, USA) or Nacalai Tesque (Kyoto, Japan).
Animal studies.
All animal experiments were performed according to procedures approved by the Institutional Animal Care and Use Committee of University of Tsukuba (Japan) or University of Texas Southwestern Medical Center at Dallas (USA). All mice used were males in C57BL/6N background and housed under humidity- and temperature-controlled conditions (22–25 ± 1 °C) on a 12-h light/dark cycle. Food and water were provided ad libitum.
Sleep phenotype analysis.
The sleep/wake behaviors were analyzed as previously described with modifications14. Electroencephalogram (EEG)/electromyogram (EMG) data were visualized and analyzed using a custom semi-automated staging MatLab (MathWorks)-based program, followed by visual inspection. We did not apply blinding and only exclude animals with unreadable EEG signals from final sleep analysis. Briefly, mice were implanted with the EEG/EMG electrodes at the age of 8–10 weeks, and EEG/EMG signals were recorded during 12–20 weeks. Age-matched control and treatment group of animals were used for each experiment. Following semi-automated analysis of EEG/EMG data, EEG signals were subjected to fast Fourier transform analysis for 1 to 30 Hz with 1-Hz bin. Wake was defined by low amplitude, fast EEG and high amplitude, variable EMG; NREMS by high amplitude, delta (1–4 Hz) frequency EEG and low EMG tonus; and REMS by dominant theta (6–9 Hz) frequency EEG and EMG atonia. Absolute and relative power spectrum analysis of corresponding state within indicated ZT time were performed; for relative power spectrum analysis (%), the EEG power of each frequency bins was expressed as a percentage of the total power over all frequency bins (1–30 Hz). Absolute NREMS delta power density (arbitrary unit) is determined by the delta band of NREMS and normalized to the average NREMS delta power during ZT8 to ZT11 of the baseline recording day10; relative delta power density (%) is defined by the ratio of delta power (1–4 Hz) to total power of NREMS EEG. In circadian variation plots, each data point represents the mean value of NREMS delta power or duration in the following 1-h.
Experimental design.
To examine how different treatments affect sleep/wake behaviors, 3-day baseline EEG/EMG recording were conducted after mice were acclimated for a week. Mice remained in the same recording chamber for a 3 to 6-day interval between treatments. No abnormal EEG/EMG signals were confirmed during the interval before next treatment.
For sleep deprivation model, mice were sleep deprived on automated orbital shaker with access to food and water14. 1-day baseline recording before sleep deprivation was used as basal condition. Whole brains or livers were harvested at ZT6 for ad-libtum sleep (S6) and sleep-deprived (SD6, ZT0-ZT6) wild-type mice, at ZT9 for 6-h sleep deprivation followed by 3-h recovery sleep (RS3) wild-type mice. For time-course sleep-deprivation, whole brains of wild-type mice were harvested at ZT0 (SD0) or after 1, 3, 6-h of sleep-deprivation (SD1, SD3, SD6). For Sleepy model, baseline EEG/EMG recording data were used; whole brains were collected Sik3+/+ (WT) and Sik3Slp/+ (Slp) at ZT12.5. For food/water deprivation experiments, sham deprived (exchange old food/water to new food/water) and deprived (took out all food/water at indicated ZT) were conducted in both normal sleep and sleep-deprived conditions; whole brains were harvested at ZT6 for both conditions. For MK-801 treatment, we performed intraperitoneal (IP) injection of mice with vehicle (0.9% saline) followed by 2mg/kg MK-801 (Sigma-Aldrich). Wild-type mice were injected at ZT17 in previous dark phase followed by EEG/EMG recording at the onset of light phase (ZT0); whole brains were harvested at ZT23.5, 6.5-h after MK-801 administration. For HG-9-91-0128 (ApexBio) treatment, we performed intracerebroventricular (ICV) injection of mice with vehicle (3% DMSO) followed by 8mg/kg HG-9-91-01. Sik3Slp/+ mice were injected at ZT6 and ZT9; whole brains were harvested at ZT11.5. Wild-type mice were injected at ZT0 and ZT3 during sleep deprivation (ZT0-ZT6); whole brains were harvested at ZT6. The organization of sleep experiments and sleep phenotype results were listed in Supplementary Table 7b.
Protein lysate preparation.
Mouse tissues (whole brain or liver) were quickly dissected at indicated ZT, rinsed with PBS, and flash frozen in liquid nitrogen. Typically, one mouse brain was homogenized in a glass tissue homogenizer with 5 mL of lysis buffer [50 mM HEPES (pH 7.4), 150 mM NaCl, 2.5% SDS, 2 mM MgCl2] freshly supplemented with protease and phosphatase inhibitor cocktail tablets (Roche). Tissue homogenates were incubated at room temperature for 30 min and centrifuged at 15,000 g for 20 min. The supernatant was carefully transferred to a new tube without disturbing the pellet. Protein concentration of protein lysates was determined using the bicinchoninic acid (BCA) assay (Thermo Scientific Pierce).
For comparison of the SIK3 and SLEEPY interactomes, wild-type, Flag-HA-Sik3+ and Flag-HA-Sik3Slp knock-in mouse brains were lysed in ice-cold lysis buffer [20 mM HEPES, pH 7.4, 150 mM NaCl, 1mM EDTA, 1% Triton X-100, 2mM MgCl2, 15mM NaF, 10mM Na4P2O7] freshly supplemented with protease/phosphatase inhibitors in a glass tissue homogenizer14. After 30 min incubation on ice, brain homogenates were centrifuged at 13,000g for 20 min at 4 °C. The supernatant was precleared by IgG and Protein G beads for 30 min before immunoprecipitation. 50 μl of anti-Flag antibody-conjugated Sepharose beads (A2220, Sigma-Aldrich) was added to each pre-cleared lysate and rotated overnight at 4 °C. The beads were washed five times with cold wash buffer [20 mM HEPES, pH 7.4, 150 mM NaCl, 1 mM EDTA, 1% Triton X-100, 2 mM MgCl2, 15 mM NaF, 10 mM Na4P2O7], then added 50 μl of elution buffer [2% SDS, 60 mM Tris-HCl, pH 6.8, 50 mM DTT, 10% glycerol], rotated for 10 min at 4 °C. Protein elution was repeated twice and combined into one eluate, then analyzed by mass spectrometry and Western blotting.
Mass spectrometry sample preparation.
Protein lysate sample was reduced with dithiothreitol (DTT) and then alkylated with iodoacetamide. Chloroform–methanol precipitation of protein lysate was performed and then resuspended in 8 M urea buffer. Protein lysate was digested 2-h with Lys-C (1:100, enzyme to protein; Wako), followed by dilution to 2 M urea with 25 mM ammonium carbonate buffer (pH 7.8), and trypsin (1:100, enzyme to protein; Thermo Scientific Pierce) digestion overnight at room temperature. After stopping the digestion with 1% formic acid, the peptide mixture was subjected to C18 solid-phase extraction (Sep-Pak, Waters) for desalt, and subsequently vacuum-centrifuged to near-dryness.
For phosphopeptide enrichment, desalted peptides were resuspended in 1 mL phosphopeptide binding buffer [2 M lactic acid/50% acetonitrile (ACN)] and centrifuged at 15,000 g for 20 min at room temperature. The supernatant was carefully transferred to a new tube without disturbing the pellet. TiO2 beads were washed for three times with phosphopeptide binding buffer, and added to the supernatant (peptide mixture) and incubated with gentle rotation for 1-h at room temperature. Afterwards, TiO2 beads were washed twice with phosphopeptide binding buffer and twice with wash buffer [50% ACN/0.1% TFA]. Phosphopeptides were eluted twice from TiO2 beads with 500 µL elution buffer [50 mM K2HPO4, pH 10], acidified with 20% formic acid, subjected to desalt and vacuum-centrifuged to near-dryness.
Desalted peptides were resuspended in 200 mM HEPES (pH 8.5) and peptide concentration was determined using the BCA assay. Approximately 50 µg of peptides for each sample were labeled with TMT reagent for 1-h at room temperature. After the reaction was quenched with hydroxylamine, all TMT-labeled samples for one experiment were combined into one mixture, acidified with 20% formic acid, desalted and vacuum-centrifuged to near-dryness. The TMT-labeled sample mixture was solubilized in HPLC buffer A [1% ACN, 10 mM ammonium bicarbonate, pH 8.0] for HPLC fractionation using an Agilent 300 Extend C18 column (5 µm particles, 4.6 mm id, and 150 mm in length). Different HPLC fractions were acidified with 20% formic acid and vacuum centrifuged to near-dryness. Each fraction was desalted via StageTip, dried by vacuum centrifugation, and re-suspended for LC/MS analysis.
Mass spectrometry data acquisition.
Data were collected using the Orbitrap-Fusion mass spectrometry platform coupled with EASY-nLC 1000 liquid chromatography (LC) pump (Thermo Fisher Scientific). Pre-column (Acclaim PepMap 100 C18, Thermo Fisher Scientific) and analytical column (NTCC-360/75–3-125, NIKKYO) were used for sample trapping and analytical separation. Peptides were separated at a flow rate of 300 nL/min using a gradient of 6–27% ACN (0.1% formic acid) over 190 min.
MultiNotch synchronous precursor selection MS3-based TMT method was used on Orbitrap-Fusion mass spectrometer using Xcalibur (version 3.0; Thermo Fisher Scientific) as described with modifications16–19. Briefly, MS1 spectra data between 400–1500 m/z were acquired from the Orbitrap at 120,000 resolution in profile data type with 4e5 AGC target, 50 ms maximum injection time. MS1 ions were isolated in top speed mode using the quadrupole with a 0.7 m/z isolation window. MS2 scans between 400–1200 m/z were acquired from the Ion Trap in centroid data type with CID fragmentation (35% collision energy) in Turbo mode, 1e4 AGC target, 50 ms maximum injection time. Top ten MS2 fragment ions were selected using synchronous precursor selection mode for TMT reporter ions quantitation. MS3 scans were acquired from the Orbitrap at 60,000 resolution in profile data type with HCD fragmentation (65% collision energy), 1e5 AGC target, 120 ms maximum injection time. Ions were not accumulated for all parallelisable time.
Mass spectrometry data analysis.
Raw mass spectrometry files of entire study were searched against a composite target/decoy database using SEQUEST29–31 from Proteome Discoverer software (PD, version 2.1, Thermo Fisher Scientific). The target mouse protein database was generated from UniProt that combined all Swiss-Prot and TrEMBL entries (October 17, 2015). MS2 spectra were searched with ±20 ppm for precursor ion mass tolerance, ±1 Da for fragment ion mass tolerance, fully tryptic restriction, four maximal missed cleavages, dynamic mass shift for oxidation of methionine (+15.9949 Da), fixed TMT modifications on the N terminus and lysine (+229.1629 Da), and carbamidomethylation of cysteine residues (+57.0215 Da). For phosphoproteomic analysis, additional dynamic modifications on serine, threonine and tyrosine (+79.9663 Da) were used. The peptide spectrum matches (PSMs) were filtered by Percolator32 (PD 2.1) to achieve 1% protein and peptide FDR (according to q-value) for proteome and phosphoproteome, respectively. ptmRS33 (PD 2.1) was used for phosphorylation site localization, which derived a localization probability score for each putatively modified site based on the given MS2 data. Phosphopeptides with the phosphorylation site probability score ≥ 25 were considered in following analysis.
TMT reporter ion signal-to-noise (S/N) values were quantified from MS3 scans using an integration tolerance of 20 ppm (Orbitrap) with the most confident centroid setting (PD 2.1) for matching peptides. For interactome analysis, raw reporter ion abundance was used for further analysis. For proteomic and phosphoproteomic analysis, the sum of raw reporter ion for each channel was normalized assuming equal input loading of all channels. The sum of reporter ion for each protein was used in protein quantitation. The normalized quantification data of all quantified proteins, peptides or phosphopeptides were used for further analysis.
To evaluate the confidence of protein identification and quantification by PD, we used a recently-developed proteomics pipeline JUMP34,35 (version 1.12.1) to re-process one set of proteome data (EX4, SlpWTpa2) with the above same database search and PSM filtering parameters. The consistency of protein quantification between these two pipelines was indicated by Pearson correlation, which was calculated for each PSM from proteins quantified by both pipelines.
Mass spectrometry data processing.
For proteomic analysis, different isoform was considered as different protein for data analysis unless otherwise stated. For phosphoproteomic analysis, phosphopeptide was used for further analysis including unique and composite (contain ≥ 2 phosphorylation sites) forms. The normalized quantification data of all quantified proteins, peptides or phosphopeptides were consolidated (sum of value) to generate unique subject ID. The consolidated abundance values were then scaled for each protein or phosphopeptide so that the average abundance is one. The scaled data from different TMT-multiplex experiments for the same comparison (e.g., Slp/WT group) were integrated together based on unique subject ID. The multiple unpaired t-test (p-value) analysis following the two-stage step-up False Discovery Rate (q-value) approach was used to determine statistical significance (q < 0.2) for each comparison36. The mean value for each experiment condition was used to generate the ‘log2 (fold change)’ value for each unique subject, which was used for further analysis. To evaluate phosphorylation stoichiometry37, phosphoproteome normalization was performed for SD6/RS3, SD6/S6 and Slp/WT groups which whole proteome and phosphoproteome data are available. Briefly, the scaled phosphopeptide abundances of SD6 and Slp groups were adjusted with the mean abundance fold change value of corresponding protein. Pearson correlation of “log2 (fold change)” value between normalized and unnormalized was performed to evaluate the normalization effect. The full description and datasets for all proteomic experiments were listed in Supplementary Table 1, and those for all phosphoproteomic experiments were listed in Supplementary Table 2.
For SIK3 and SLEEPY interactome analysis, raw abundance data of all quantified proteins were consolidated (sum of value) to generate unique subject ID, and then normalized assuming equal SIK3/SLEEPY protein amount in all channels. Two criteria were used to define the interacting protein (ip) for SIK3 or SLEEPY: a) TMT intensity [Mean-Blank > 10]; b) Fold change [Mean/Blank > 2]. For the SIK3 preferential interacting protein (SIK3-pip): [(Mean SLEEPY-Blank) / (Mean SIK3-Blank) < 0.5]; SLEEPY-pip: [(Mean SLEEPY-Blank) / (Mean SIK3-Blank) > 2]. SLEEPY-pip proteins were used for the Gene Ontology (GO) cellular component enrichment analysis through Gene Ontology Consortium and PANTHER classification system38–40. All 22,262 genes of Mus musculus in database were used as reference to determine the fold of enrichment. Fisher’s Exact with FDR multiple test correction was used to determine statistical significance. The full description and datasets were listed in Supplementary Table 6.
Protein phospho-state analysis.
The phospho-state change (∆Ps) value for individual protein is calculated as the “sum of log2 (fold change) value” of all phosphopeptides with statistically significant changes (q < 0.2) from all protein isoforms encoded by the same gene. If none of phosphopeptide’s q-value is above 0.2, ∆Ps value will be zero. The total quantified phosphopetides number of SD6/RS3 group was used for the ∆Ps value normalization with other comparisons of brain phosphoproteome in this study. Normalized ∆Ps value was used for further analysis to determine the Hyper- or Hypo-phosphoproteins. To set up the cutoff for ∆Ps value, two null-tests were performed using data from SD6/RS3 and Slp/WT phosphoproteome, briefly, data from channels with even number between two groups were swapped and then to determine the false discovery rate. For two null-tests, no phosphopeptide’s q-value is above 0.2, ∆Ps value is zero for all proteins (Supplementary Table 2z, aa). Because average standard deviation (s.d.) for ∆Ps value of SD6/RS3, SD6/S6 and Slp/WT groups equals to 1.1 (Supplementary Table 3d), we applied a stringent cutoff for ∆Ps value as +/−2.4 (> 2 s.d.) in this study for each comparison group to represent the concept of cumulative phosphorylation. Hyper-phosphorylated (Hyper: ∆Ps > 2.4), hypo-phosphorylated (Hypo: ∆Ps < −2.4) phosphoproteins. The full description and datasets were listed in Supplementary Table 3.
As previously described4, in the normal sleep-wake model, mouse forebrains (cortex plus hippocampus) were harvested at ZT16 (W4) and ZT4 (S4) to purify PSD fractions for phosphoproteomic analysis. For analysis of the normal sleep-wake model, the raw phosphopeptides data from Diering et al. Table S2A [hyper-phosphorylated during wake (10pm/10am ratio >1.3)] and S2B [hyper-phosphorylated in the PSD during sleep (10am/10pm ratio >1.3, or 10pm/10am ratio < 0.77)]4 were combined into one data table. The raw quantification data of all phosphopeptides were consolidated (sum of value) to generate unique subject ID and “log2 (fold change)” value. It should be noted that no statistical test was performed for phosphopeptide comparisons as there were only two technical replicates for each condition. The ∆Ps value for each protein is calculated as the “sum of log2 (fold change) value” of all phosphopeptides from all protein isoforms encoded by the same gene, which was not normalized with SD6/RS3 group. The full description and datasets were listed in Supplementary Table 5.
Bioinformatic analysis.
The sleep phenotypes, molecular and neuronal functions of 80 SNIPPs were classified manually by literature mining23,24,41–55, the complete literature information was listed in Supplementary Table 4a. The classification of synaptic proteins was mainly based on an integrated synaptic protein database from 11 proteomic studies56–66 as listed in Supplementary Table 4b. A protein that is shown in ≥ 2 references (Synaptic Ref Count ≥ 2) will be considered as annotated synaptic protein in this study. To predict potential AMPK substrates, a sequence window of −5/+4 positions around each phosphorylation site was scored with the “AMPK Motif Analyzer27“. Putative AMPK phosphorylation site (score > −0.94, the lowest scoring known AMPK substrate) were used for further analysis. Complete data for AMPK substrate prediction was list in Supplementary Table 4c. Hierarchical clustering (Centroid linkage with Euclidean distance) were performed with Cluster 3.067.
In vitro kinase assay.
The kinase activity of recombinant SIK3 and SLEEPY proteins were measured by in vitro kinase assay as previously described68. A recombinant GST-MFF-S146 [136-RQNGQLVRNDSIVTPSPPQA-155; AMPK motif score, 1.06] fusion protein was used as a substrate. Recombinant Flag-SIK3 and Flag-SLEEPY were overexpressed in HEK 293T cells and affinity purified with anti-Flag antibody-conjugated Sepharose beads. A mocked preparation from HEK293T cells transfected with empty vector was used as negative control. The same amount of recombinant kinase and substrate proteins were incubated for 20 min at 30 °C in kinase reaction buffer [50 mM HEPES, pH 7.4, 1 mM EDTA, 10 mM MgCl2, 0.5 mM ATP] freshly supplemented with protease/phosphatase inhibitors. Reactions were stopped by the addition of sample loading buffer; samples were resolved by SDS-PAGE followed by Western blotting or by Coomassie Blue Staining.
Phospho-tag gel electrophoresis and immunoblotting.
Equal amounts of protein samples were resolved by phospho-tag69 (Wako) or regular SDS-PAGE and transferred to PVDF membrane. Phos-tag SDS-PAGE is an electrophoresis technique capable of separating phosphorylated and non-phosphorylated forms based on phosphorylation levels, owing to binding to the phospho-tag chemical that slowed the migration of phosphorylated protein69. The molecular weight markers are only indicative for the non-phosphorylated forms and irrelevant for those phosphorylated forms. The Rf value of 1.0 is defined as the position of bromphenol blue dye69.
Western blotting was performed according to standard procedures using the corresponding antibodies. Dilution of antibodies at the optimal concentration was used according to the manufacturer’s instructions. Lamin A/C was measured as a loading control for the quantitative analysis of phospho-motif antibodies immunoblotting. Antibodies used in this study included anti-EF2 (phospho T56/T58) [ab82981, Abcam], anti-EF2 [#2332, Cell Signaling], anti-CaMKII (phospho T286) [ab32678, Abcam], anti-CaMKII [#4436, Cell Signaling], anti-nNOS (phospho S1417) [ab5583, Abcam], anti-nNOS [ab76067, Abcam], anti-KCC2 (S940) [612-401-E15, Rockland], anti-KCC2 [07–432, EMD Millipore], anti-Synapsin-1 (Ser605) [#88246, Cell Signaling], anti-Synapsin-1[sc-8295, Santa Cruz], anti-Phospho-AMPK Substrate Motif [LXRXX(S*/T*)] [#5759, Cell Signaling], anti-Phospho-PKC Substrate Motif [(K/R)XS*X(K/R)] [#6967, Cell Signaling], anti-Phospho-PKA Substrate Motif [(K/R)(K/R)X(S*/T*)] [#9624, Cell Signaling], anti-Phospho-ATM/ATR Substrate Motif [S*Q] [#9607, Cell Signaling], anti-Phospho-Akt Substrate Motif [RXX(S*/T*)] [#9614, Cell Signaling], anti-Phospho-PDK1 Docking Motif [(F/K)XX(F/Y)(S*/T*)(F/Y)] [#9634, Cell Signaling], anti-Phospho-CK2 Substrate Motif [(S*/T*)DXE] [#8738, Cell Signaling], anti-Phospho-MAPK/CDK Substrate Motif [PXS*P, S*PX(K/R)] [#2325, Cell Signaling], anti-Phospho-CDKs Substrate Motif [(K/H)S*P] [#9477, Cell Signaling], anti-Phospho-PLK Binding Motif [ST*P] [#5243, Cell Signaling], anti-Phospho-Thr-Pro Motif [T*P, T*PP] [#3003, Cell Signaling], anti-Phospho-Thr-Pro-Glu Motif [T*PE, T*P] [#3004, Cell Signaling], anti-Phospho-Thr-X-Arg Motif [T*X(K/R)] [#2351, Cell Signaling], anti-Phospho-Tyrosine [Y*] [#8954, Cell Signaling], anti-Lamin A/C [sc-6215, Santa Cruz], anti-HA (Y-11) [sc-805, Santa Cruz], anti-NMDAR1 [MAB363, EMD Millipore], anti-NMDAR2B [75–101, NeuroMab], anti-SynGAP [#5539, Cell Signaling], and anti-SIK3 C-term [a custom generated rabbit polyclonal antibody against the C-terminal 171 amino acids of mouse SIK3].
Statistical methods.
Unless otherwise noted, all experimental subjects are biological replicates and at least two independent experiments were performed. Image J software were used to quantify the protein bands intensity. GraphPad Prism 7 or R (Foundation for Statistical Computing) software was used for statistical test analysis. No statistical methods were used to predetermine sample size. Randomization and blinding were not used. Following one-way or two-way analysis of variance (ANOVA), Fisher’s LSD test compares one mean with another mean; Tukey’s test compares every mean with every other mean; Dunnett’s test compares every mean to a control mean; Sidak’s test compares a set of means. Repeated measures (RM) or paired test performed for matched subject comparisons. P < 0.05 was considered statistically significant. The complete sample size, statistical test method and results for each comparison are reported in each figure legends and described in detail in Supplementary Table 7a.
Data availability.
The mass spectrometry datasets include raw data files, search engine files and a full experimental summary file have been deposited to MassIVE70,71 (MSV000081865; PXD008558). Source data are provided with the online version of the paper. All other datasets generated and/or analyzed in the current study will be available from the corresponding author on reasonable request.
Extended Data
Extended Data Figure 1 |. Sleep phenotype analysis of the sleep-deprived and Sleepy models.
a-e, Analysis of circadian (a) and mean (b) absolute NREMS delta power, absolute EEG power spectra (c), relative EEG power spectra (d) and duration (e) of NREMS, REMS, wake states of wild-type mice (n = 24) without (WT Basal) and with 6-h sleep deprivation (WT SD). f-i, Analysis of circadian (f) and mean (g) relative NREMS delta power, relative EEG power spectra (h) and duration (i) of NREMS, REMS, wake states of Sik3+/+ (WT, n = 24) and Sik3Slp/+ (Slp, n = 24) mice. Mean ± s.e.m., two-way ANOVA with Sidak’s test (a, c-f, h, i); Paired t-test, two-tailed (b); Mean, unpaired t-test, two-tailed (g). *(black) P < 0.05; *(cyan) P < 0.01; *(red) P < 0.001.
Extended Data Figure 2 |. Analysis of global signaling changes in two models of increased sleep need.
a-m, Representative immunoblots of 13 phospho-motif antibodies to assess global signaling changes in whole brain lysates of two models [three (sleep-deprived) or two (Sleepy) independent experiments]. Quantitative analysis of immunoblots of all 14 phospho-motif antibodies is shown in Figure 1c [n=12 (S6), 9 (SD6, RS3), 6 (WT, Slp)].
Extended Data Figure 3 |. Analysis of sleep phenotype and signaling changes after food/water deprivation in the baseline and sleep deprivation conditions.
a-c, Analysis of circadian (a) and mean (b) absolute NREMS delta power, duration (c) of NREMS, REMS, wake states of wild-type mice (n = 8) without (Sham) or with 6-h food/water deprivation (FD 6h). d, Quantitative analysis of immunoblots with 7 phospho-motif antibodies using whole brain lysates of sham and FD 6h mice (n = 8) harvested at ZT6. e-g, Analysis of circadian (e) and mean (f) absolute NREMS delta power, duration (g) of NREMS, REMS, wake states of wild-type mice (n = 11) without (SD+Sham) or with 6-h food/water deprivation during 6-h sleep deprivation (SD+FD 6h). h, Quantitative analysis of immunoblots with 7 phospho-motif antibodies using whole brain lysates of SD+Sham and SD+FD mice (n = 6) harvested at ZT6. Mean ± s.e.m., two-way ANOVA, Sidak’s test (a, c, e, g); Paired t-test, two-tailed (b, f); Mean ± s.d., two-way ANOVA, Fisher’s LSD test (d, h). *(black) P < 0.05; ns, P > 0.05.
Extended Data Figure 4 |. Quality assessment of proteomic and phosphoproteomic analysis.
a, Representative TMT quantification spectrum for the p-S551 containing phosphopeptide from the skipped Sik3 exon-13 among phosphoproteomic data of the Sleepy model (two independent experiments). b-e, Quality assessment of one proteomic dataset (EX4, SlpWTpa2) by two search pipelines. Global distribution of protein quantification using Proteome Discoverer (PD v2.1; n = 8,273) (b) and JUMP (v1.12.1; n = 8,473). Boxes correspond to the 25th, 50th, and 75th percentiles of the data, whiskers extend 1.5-fold of the interquartile range. (c). A similar number of accepted proteins (1% FDR) were identified by two pipelines (d). Pearson correlation between the two pipelines was calculated for each PSM from quantified proteins by both pipelines (e). The vast majority (99.88%) of PSMs (n = 73,454) have R2 larger than 0.9 (red dashed line). f, A Venn diagram showing overlaps of quantified proteins between whole brain proteomes of Sleepy and sleep-deprived models. g, Volcano plots showing comparative analysis of Slp/WT, SD6/RS3 and SD6/S6 proteomes. Multiple unpaired t-test (p-value) following FDR (q-value) analysis. X-axis, log2 (fold change) in abundance; Y-axis, -log10 (q-value) of abundance change. The numbers of total (n), increased [In: q < 0.2, red] and decreased [De: q < 0.2, blue] subjects are shown. Orange dotted lines (q = 0.2). h, Pearson correlation between normalized and unnormalized phosphopeptides in Slp/WT, SD6/RS3, SD6/S6 groups. The numbers of phosphopeptides that can be normalized are shown. i, Immunoblots were performed with phospho-site specific antibodies to verify hyper-phosphorylation of several proteins in two models [three (sleep-deprived) or two (Sleepy) independent experiments]. j, Quantitative analysis of immunoblots using phospho-site specific antibodies (i), normalized with whole protein abundance, for Sleepy (n = 6) and sleep-deprived (n = 9) models. Mean ± s.d., two-way ANOVA with Fisher’s LSD test. *(black) P < 0.05; *(cyan) P < 0.01; *(red) P < 0.001; ns, P > 0.05.
Extended Data Figure 5 |. Liver phosphoproteome analysis of the sleep-deprived model.
a, Quantitative analysis of immunoblots with 7 phospho-motif antibodies using whole liver lysates from the sleep-deprived model. n =8 (S6), 10 (SD6), 7 (RS3); Mean ± s.d., two-way ANOVA with Fisher’s LSD test. *(black) P < 0.05; ns, P > 0.05. b-c, Volcano plots showing comparative analysis of liver phosphoproteomes in the SD6/RS3 (b) and SD6/S6 (c) groups. Multiple unpaired t-test (p-value) following FDR (q-value) analysis. X-axis, log2 (fold change) in abundance; Y-axis, -log10 (q-value) of abundance change. The numbers of total (n), increased [In: q < 0.2, red] and decreased [De: q < 0.2, blue] subjects are shown. Orange dotted lines (q = 0.2). d, A Venn diagram showing overlaps of significant changed (q < 0.2) phosphopeptides among the SD6/RS3 and SD6/S6 groups. e-f, Global ∆Ps analysis of all phosphoproteins identified in the SD6/RS3 (e) and SD6/S6 (f) groups of liver phosphoproteomes. Dotted lines (∆Ps = +/−2.4).
Extended Data Figure 6 |. Examples of cumulative phosphorylation of SNIPPs and synaptic phosphoproteomic analysis of normal sleep-wake model.
a-b, A schematic diagram of the domain structure of Synapsin-122 (a) and Nav1.223,41,42 (b) that summarizes known phosphorylation sites, kinases and physiological functions. Synapsin-1 can be divided into five domains (domain A-E). Nav1.2 can be divided into cytoplasmic N-terminal (NT), C-terminal (CT), four homologous transmembrane domains (DI-DIV) and intracellular loops (DI-II, DII-III, DIII-IV). Amino acid numbers refer to the sequence of mouse proteins. Sites 1–9 of Synapsin-1 are designated according to the consensus in the literature. While undetected or unchanged phosophorylation sites are labeled in grey, significantly increased phosphorylation sites are in red. Dashed arrows indicate the presence of contrasting data for biological functions in the literature. c, Published forebrain PSD phosphoproteome results [Diering et al. TableS2]4 were used for comparative analysis between normal slept (S4) and wake (W4) brains. d, Global ∆Ps analysis of all identified phosphoproteins in the W4/S4 group. Dotted lines (∆Ps = +/−2.4). e, Quantitative ∆Ps analysis of SD1/SD0, SD3/SD0, SD6/SD0 groups. Mean; one-way ANOVA, Tukey’s (Total, SNIPPs); Unpaired t-test, two-tailed (Total vs. SNIPPs). *(red) P < 0.001.
Extended Data Figure 7 |. Physiological functions of 80 SNIPPs.
a, A Venn diagram showing overlaps of the Hyper-phosphoproteins (∆Ps > 2.4) between sleep-deprived and Sleepy models. b, A summary of 80 SNIPPs and their physiological functions. Stars mark the 13 SWA-SNIPPs (Fig. 3f). Gene names for annotated synaptic proteins are shown in bold.
Extended Data Figure 8 |. Phospho-state changes of SNIPPs correspond to changes of sleep need in NMDAR inhibition model.
a, Representative 8-s EEG and EMG from ZT0-ZT3 for NREMS, REMS and wake of vehicle and MK801-treated mice. b, Mean absolute NREMS delta power analysis of Veh- or MK-injected mice (n = 14). Paired t-test, two-tailed. c-e, Analysis of absolute EEG power spectra (c), relative EEG power spectra (d) and duration (e) of Veh- or MK-injected wild-type mice (n = 14). Mean ± s.e.m., two-way ANOVA with Sidak’s test. f, Volcano plot showing MK/Veh phosphoproteome comparison. Orange dotted line (q = 0.2). Multiple unpaired t-test (p-value) following FDR (q-value) analysis. g, Phosphorylation state of Synapsin-1 was assessed by phospho-tag (top) and regular (bottom) SDS-PAGE followed by immunoblotting with anti-Synapsin-1 antibody. The Rf value of 1.0 is defined as the position of bromphenol blue dye (two independent experiments). h, Quantitative ∆Ps analysis of MK/Veh group. Mean, unpaired t-test, two-tailed. i, Percentage of synaptic proteins among the total, Hypo- and Hyper-phosphoproteins in MK/Veh group. Chi-square test, two-sided. j, Venn diagram showing overlaps of Hyper-phosphoproteins (∆Ps > 2.4) among all three (Sleepy, SD and MK) models. *(black) P < 0.05; *(cyan) P < 0.01; *(red) P < 0.001.
Extended Data Figure 9 |. SLEEPY causes constitutively high sleep need by preferentially associating with and phosphorylating SNIPPs.
a, Experimental design for comparing the interactomes of SIK3 and SLEEPY from whole brain lysates. b, Summary of SIK3 and SLEEPY interacting proteins (ip) and preferential interacting proteins (pip). c, Gene-annotation enrichment analysis of 289 SLEEPY preferential interacting proteins (SLEEPY-pip). GO cellular component enrichment analysis using all 22,262 genes of Mus musculus as reference (Ref). Fisher’s Exact with FDR multiple test correction was used to determine statistical significance. Top 10 GO terms of fold enrichment (FDR < 0.0001), the gene number of SLEEPY-pip and Ref in each term are shown. d-e, Volcano plots showing phosphorylation changes of all putative AMPK substrates in the Slp/WT group (d) or from the 28 SLEEPY-pip SNIPPs (e). Orange dotted lines (q = 0.2). f, In vitro kinase assay of recombinant SLEEPY and SIK3, and immunoblotting with AMPK phospho-motif antibody (two independent experiments). g–i, Volcano plot showing comparative analysis of whole brain phosphoproteomes (g), all putative AMPK substrates (h) or from 28 SLEEPY-pip SNIPPs (i) in the HG/Veh (Slp) group. Orange dotted lines (q = 0.2). j, Quantitative ∆Ps analysis of 190 Hyper-phosphoproteins and 52 Hypo-phosphoproteins in HG/Veh (Slp) group. Dotted lines (∆Ps = +/−2.4). k-m, Analysis of absolute EEG power spectra (k), relative EEG power spectra (l), duration (m) of NREMS, REMS and wake states of Sik3Slp/+ (Slp, n = 14) mice injected with vehicle (Veh) or 8mg/kg HG-9–91-01 (HG) at ZT6 and ZT9. Multiple unpaired t-test (p-value) following FDR (q-value) analysis (d-e, g-i). Mean, one-way ANOVA with Dunnett’s test (j). Mean ± s.e.m., two-way ANOVA with Sidak’s test (k-m). *(black) P < 0.05; *(cyan) P < 0.01; *(red) P < 0.001; ns, P > 0.05.
Extended Data Figure 10 |. Inhibition of SIK3 kinase activity reduced phosphorylation of AMPK substrates in sleep-deprived wild-type brains.
a-c, Volcano plots showing phosphorylation changes of all putative AMPK substrates in the SD6/RS3 (a), SD6/S6 (b) and time-course sleep-deprivation groups (c). Orange dotted lines (q = 0.2). d-e, Volcano plots showing comparative analysis of whole brain phosphoproteome (d) and phosphorylation changes of all putative AMPK substrates (e) in the HG/Veh (WT-SD) group. Orange dotted lines (q = 0.2). f-h, Analysis of absolute EEG power spectra (f), relative EEG power spectra (g), duration (h) of NREMS, REMS and wake states of sleep-deprived (ZT0-ZT6) wild-type (n = 16) mice injected with vehicle (Veh) or 8mg/kg HG-9–91-01 (HG) at ZT0 and ZT3. Multiple unpaired t-test (p-value) following FDR (q-value) analysis (a-e). Mean ± s.e.m., two-way ANOVA with Sidak’s test (f-h). *(black) P < 0.05; *(cyan) P < 0.01; *(red) P < 0.001; ns, P > 0.05.
Supplementary Material
Acknowledgements
We are grateful to Drs. Mengqiu Dong, She Chen, Hamid Mirzaei for mass spectrometry assistance; Drs. Jonathan Cohen, Robert Greene and Feng Shao for comments on the manuscript. Q.L. is a W.A. “Tex” Moncrief Jr. Scholar in Medical Research. Y.Y. is a Virginia Murchison Linthicum Scholar in Medical Research and a CPRIT scholar in Cancer Research. This work was supported by the Welch foundation (I-1608 to Q.L.; I-1800 to Y.Y.), the National Institute of Health (GM111367 to Q.L.; R01AG047928 to J.P.; GM114160 to Y.Y.), JSPS KAKENHI (16K16639 to Z.W.; 17K15592 to J.M.; 26220207, 17H06095 to M.Y., H.F., Q.L.), JST CREST (JPMJCR1655 to M.Y.) and the World Premier International Research Center Initiative (WPI) program from Japan’s MEXT.
Footnotes
Author Information Readers are welcome to comment on the online version of the paper.
The authors declare no competing financial interests.
References
- 1.Cirelli C & Tononi G Changes in anti-phosphoserine and anti-phosphothreonine antibody binding during the sleep-waking cycle and after lesions of the locus coeruleus. Sleep research online : SRO 1, 11–18 (1998). [PubMed] [Google Scholar]
- 2.Elliott AS, Huber JD, O’Callaghan JP, Rosen CL & Miller DB A review of sleep deprivation studies evaluating the brain transcriptome. SpringerPlus 3, 728 (2014). [DOI] [PMC free article] [PubMed] [Google Scholar]
- 3.Thompson CL et al. Molecular and anatomical signatures of sleep deprivation in the mouse brain. Frontiers in neuroscience 4, 165 (2010). [DOI] [PMC free article] [PubMed] [Google Scholar]
- 4.Diering GH et al. Homer1a drives homeostatic scaling-down of excitatory synapses during sleep. Science 355, 511–515 (2017). [DOI] [PMC free article] [PubMed] [Google Scholar]
- 5.Tononi G & Cirelli C Sleep and the price of plasticity: from synaptic and cellular homeostasis to memory consolidation and integration. Neuron 81, 12–34 (2014). [DOI] [PMC free article] [PubMed] [Google Scholar]
- 6.de Vivo L et al. Ultrastructural evidence for synaptic scaling across the wake/sleep cycle. Science 355, 507–510 (2017). [DOI] [PMC free article] [PubMed] [Google Scholar]
- 7.Vyazovskiy VV & Harris KD Sleep and the single neuron: the role of global slow oscillations in individual cell rest. Nature reviews. Neuroscience 14, 443–451 (2013). [DOI] [PMC free article] [PubMed] [Google Scholar]
- 8.Borbely AA A two process model of sleep regulation. Hum. Neurobiol 1, 195–204 (1982). [PubMed] [Google Scholar]
- 9.Benington JH Sleep homeostasis and the function of sleep. Sleep 23, 959–966 (2000). [PubMed] [Google Scholar]
- 10.Franken P, Chollet D & Tafti M The homeostatic regulation of sleep need is under genetic control. J. Neurosci 21, 2610–2621 (2001). [DOI] [PMC free article] [PubMed] [Google Scholar]
- 11.Vassalli A & Dijk DJ Sleep function: current questions and new approaches. The European journal of neuroscience 29, 1830–1841 (2009). [DOI] [PubMed] [Google Scholar]
- 12.Saper CB & Fuller PM Wake-sleep circuitry: an overview. Current opinion in neurobiology 44, 186–192 (2017). [DOI] [PMC free article] [PubMed] [Google Scholar]
- 13.Liu S, Liu Q, Tabuchi M & Wu MN Sleep Drive Is Encoded by Neural Plastic Changes in a Dedicated Circuit. Cell 165, 1347–1360 (2016). [DOI] [PMC free article] [PubMed] [Google Scholar]
- 14.Funato H et al. Forward-genetics analysis of sleep in randomly mutagenized mice. Nature 539, 378–383 (2016). [DOI] [PMC free article] [PubMed] [Google Scholar]
- 15.Lizcano JM et al. LKB1 is a master kinase that activates 13 kinases of the AMPK subfamily, including MARK/PAR-1. The EMBO journal 23, 833–843 (2004). [DOI] [PMC free article] [PubMed] [Google Scholar]
- 16.Erickson BK et al. Evaluating multiplexed quantitative phosphopeptide analysis on a hybrid quadrupole mass filter/linear ion trap/orbitrap mass spectrometer. Anal. Chem 87, 1241–1249 (2015). [DOI] [PMC free article] [PubMed] [Google Scholar]
- 17.McAlister GC et al. MultiNotch MS3 enables accurate, sensitive, and multiplexed detection of differential expression across cancer cell line proteomes. Anal. Chem 86, 7150–7158 (2014). [DOI] [PMC free article] [PubMed] [Google Scholar]
- 18.Weekes MP et al. Quantitative temporal viromics: an approach to investigate host-pathogen interaction. Cell 157, 1460–1472 (2014). [DOI] [PMC free article] [PubMed] [Google Scholar]
- 19.Paulo JA et al. Effects of MEK inhibitors GSK1120212 and PD0325901 in vivo using 10-plex quantitative proteomics and phosphoproteomics. Proteomics 15, 462–473 (2015). [DOI] [PMC free article] [PubMed] [Google Scholar]
- 20.Humphrey SJ, James DE & Mann M Protein Phosphorylation: A Major Switch Mechanism for Metabolic Regulation. Trends Endocrinol. Metab 26, 676–687 (2015). [DOI] [PubMed] [Google Scholar]
- 21.Greengard P, Valtorta F, Czernik AJ & Benfenati F Synaptic vesicle phosphoproteins and regulation of synaptic function. Science 259, 780–785 (1993). [DOI] [PubMed] [Google Scholar]
- 22.Cesca F, Baldelli P, Valtorta F & Benfenati F The synapsins: key actors of synapse function and plasticity. Progress in neurobiology 91, 313–348 (2010). [DOI] [PubMed] [Google Scholar]
- 23.Cantrell AR et al. Molecular mechanism of convergent regulation of brain Na(+) channels by protein kinase C and protein kinase A anchored to AKAP-15. Molecular and cellular neurosciences 21, 63–80 (2002). [DOI] [PubMed] [Google Scholar]
- 24.Tatsuki F et al. Involvement of Ca(2+)-Dependent Hyperpolarization in Sleep Duration in Mammals. Neuron 90, 70–85 (2016). [DOI] [PubMed] [Google Scholar]
- 25.Campbell IG & Feinberg I NREM delta stimulation following MK-801 is a response of sleep systems. Journal of neurophysiology 76, 3714–3720 (1996). [DOI] [PubMed] [Google Scholar]
- 26.Campbell IG & Feinberg I Noncompetitive NMDA channel blockade during waking intensely stimulates NREM delta. The Journal of pharmacology and experimental therapeutics 276, 737–742 (1996). [PubMed] [Google Scholar]
- 27.Schaffer BE et al. Identification of AMPK Phosphorylation Sites Reveals a Network of Proteins Involved in Cell Invasion and Facilitates Large-Scale Substrate Prediction. Cell Metab 22, 907–921 (2015). [DOI] [PMC free article] [PubMed] [Google Scholar]
- 28.Clark K et al. Phosphorylation of CRTC3 by the salt-inducible kinases controls the interconversion of classically activated and regulatory macrophages. Proceedings of the National Academy of Sciences of the United States of America 109, 16986–16991 (2012). [DOI] [PMC free article] [PubMed] [Google Scholar]
- 29.Eng JK, McCormack AL & Yates JR An approach to correlate tandem mass spectral data of peptides with amino acid sequences in a protein database. J. Am. Soc. Mass Spectrom 5, 976–989 (1994). [DOI] [PubMed] [Google Scholar]
- 30.Peng J, Elias JE, Thoreen CC, Licklider LJ & Gygi SP Evaluation of multidimensional chromatography coupled with tandem mass spectrometry (LC/LC-MS/MS) for large-scale protein analysis: the yeast proteome. J. Proteome Res 2, 43–50 (2003). [DOI] [PubMed] [Google Scholar]
- 31.Elias JE & Gygi SP Target-decoy search strategy for increased confidence in large-scale protein identifications by mass spectrometry. Nat. Methods 4, 207–214 (2007). [DOI] [PubMed] [Google Scholar]
- 32.Kall L, Canterbury JD, Weston J, Noble WS & MacCoss MJ Semi-supervised learning for peptide identification from shotgun proteomics datasets. Nat. Methods 4, 923–925 (2007). [DOI] [PubMed] [Google Scholar]
- 33.Taus T et al. Universal and confident phosphorylation site localization using phosphoRS. J. Proteome Res 10, 5354–5362 (2011). [DOI] [PubMed] [Google Scholar]
- 34.Wang X et al. JUMP: a tag-based database search tool for peptide identification with high sensitivity and accuracy. Mol. Cell. Proteomics 13, 3663–3673 (2014). [DOI] [PMC free article] [PubMed] [Google Scholar]
- 35.Li Y et al. JUMPg: An Integrative Proteogenomics Pipeline Identifying Unannotated Proteins in Human Brain and Cancer Cells. J. Proteome Res 15, 2309–2320 (2016). [DOI] [PMC free article] [PubMed] [Google Scholar]
- 36.Benjamini Y, Krieger AM & Yekutieli D Adaptive linear step-up procedures that control the false discovery rate. Biometrika 93, 491–507 (2006). [Google Scholar]
- 37.Wu R et al. Correct interpretation of comprehensive phosphorylation dynamics requires normalization by protein expression changes. Molecular & cellular proteomics : MCP 10, M111 009654 (2011). [DOI] [PMC free article] [PubMed] [Google Scholar]
- 38.Ashburner M et al. Gene ontology: tool for the unification of biology. The Gene Ontology Consortium. Nature genetics 25, 25–29 (2000). [DOI] [PMC free article] [PubMed] [Google Scholar]
- 39.The Gene Ontology C Expansion of the Gene Ontology knowledgebase and resources. Nucleic acids research 45, D331–D338 (2017). [DOI] [PMC free article] [PubMed] [Google Scholar]
- 40.Mi H et al. PANTHER version 11: expanded annotation data from Gene Ontology and Reactome pathways, and data analysis tool enhancements. Nucleic acids research 45, D183–D189 (2017). [DOI] [PMC free article] [PubMed] [Google Scholar]
- 41.Beacham D, Ahn M, Catterall WA & Scheuer T Sites and molecular mechanisms of modulation of Na(v)1.2 channels by Fyn tyrosine kinase. The Journal of neuroscience : the official journal of the Society for Neuroscience 27, 11543–11551 (2007). [DOI] [PMC free article] [PubMed] [Google Scholar]
- 42.James TF et al. The Nav1.2 channel is regulated by GSK3. Biochimica et biophysica acta 1850, 832–844 (2015). [DOI] [PMC free article] [PubMed] [Google Scholar]
- 43.Siwek ME et al. The CaV2.3 R-type voltage-gated Ca2+ channel in mouse sleep architecture. Sleep 37, 881–892 (2014). [DOI] [PMC free article] [PubMed] [Google Scholar]
- 44.Parker MJ et al. De novo, heterozygous, loss-of-function mutations in SYNGAP1 cause a syndromic form of intellectual disability. Am. J. Med. Genet. A 167A, 2231–2237 (2015). [DOI] [PMC free article] [PubMed] [Google Scholar]
- 45.Carlisle HJ et al. Deletion of densin-180 results in abnormal behaviors associated with mental illness and reduces mGluR5 and DISC1 in the postsynaptic density fraction. J. Neurosci 31, 16194–16207 (2011). [DOI] [PMC free article] [PubMed] [Google Scholar]
- 46.Soorya L et al. Prospective investigation of autism and genotype-phenotype correlations in 22q13 deletion syndrome and SHANK3 deficiency. Mol. Autism 4, 18 (2013). [DOI] [PMC free article] [PubMed] [Google Scholar]
- 47.Ahnaou A, Raeymaekers L, Steckler T & Drinkenbrug WH Relevance of the metabotropic glutamate receptor (mGluR5) in the regulation of NREM-REM sleep cycle and homeostasis: evidence from mGluR5 (−/−) mice. Behav. Brain Res 282, 218–226 (2015). [DOI] [PubMed] [Google Scholar]
- 48.Hagebeuk EE, van den Bossche RA & de Weerd AW Respiratory and sleep disorders in female children with atypical Rett syndrome caused by mutations in the CDKL5 gene. Dev. Med. Child. Neurol 55, 480–484 (2012). [DOI] [PubMed] [Google Scholar]
- 49.Lonart G, Tang X, Simsek-Duran F, Machida M & Sanford LD The role of active zone protein Rab3 interacting molecule 1 alpha in the regulation of norepinephrine release, response to novelty, and sleep. Neuroscience 154, 821–831 (2008). [DOI] [PubMed] [Google Scholar]
- 50.Iqbal Z et al. Homozygous and heterozygous disruptions of ANK3: at the crossroads of neurodevelopmental and psychiatric disorders. Hum. Mol. Genet 22, 1960–1970 (2013). [DOI] [PubMed] [Google Scholar]
- 51.von Stulpnagel C et al. SYNGAP1 Mutation in Focal and Generalized Epilepsy: A Literature Overview and A Case Report with Special Aspects of the EEG. Neuropediatrics 46, 287–291 (2015). [DOI] [PubMed] [Google Scholar]
- 52.Mangatt M et al. Prevalence and onset of comorbidities in the CDKL5 disorder differ from Rett syndrome. Orphanet journal of rare diseases 11, 39 (2016). [DOI] [PMC free article] [PubMed] [Google Scholar]
- 53.Fehr S et al. The CDKL5 disorder is an independent clinical entity associated with early-onset encephalopathy. Eur J Hum Genet 21, 266–273 (2013). [DOI] [PMC free article] [PubMed] [Google Scholar]
- 54.Jiang P et al. A systems approach identifies networks and genes linking sleep and stress: implications for neuropsychiatric disorders. Cell Rep 11, 835–848 (2015). [DOI] [PMC free article] [PubMed] [Google Scholar]
- 55.Welch JM et al. Cortico-striatal synaptic defects and OCD-like behaviours in Sapap3-mutant mice. Nature 448, 894–900 (2007). [DOI] [PMC free article] [PubMed] [Google Scholar]
- 56.Bayes A et al. Comparative study of human and mouse postsynaptic proteomes finds high compositional conservation and abundance differences for key synaptic proteins. PloS one 7, e46683 (2012). [DOI] [PMC free article] [PubMed] [Google Scholar]
- 57.Li J et al. Long-term potentiation modulates synaptic phosphorylation networks and reshapes the structure of the postsynaptic interactome. Science signaling 9, rs8 (2016). [DOI] [PubMed] [Google Scholar]
- 58.Uezu A et al. Identification of an elaborate complex mediating postsynaptic inhibition. Science 353, 1123–1129 (2016). [DOI] [PMC free article] [PubMed] [Google Scholar]
- 59.Gonzalez-Lozano MA et al. Dynamics of the mouse brain cortical synaptic proteome during postnatal brain development. Scientific reports 6, 35456 (2016). [DOI] [PMC free article] [PubMed] [Google Scholar]
- 60.Weingarten J et al. The proteome of the presynaptic active zone from mouse brain. Molecular and cellular neurosciences 59, 106–118 (2014). [DOI] [PubMed] [Google Scholar]
- 61.Boyken J et al. Molecular profiling of synaptic vesicle docking sites reveals novel proteins but few differences between glutamatergic and GABAergic synapses. Neuron 78, 285–297 (2013). [DOI] [PubMed] [Google Scholar]
- 62.Abul-Husn NS et al. Systems approach to explore components and interactions in the presynapse. Proteomics 9, 3303–3315 (2009). [DOI] [PMC free article] [PubMed] [Google Scholar]
- 63.Biesemann C et al. Proteomic screening of glutamatergic mouse brain synaptosomes isolated by fluorescence activated sorting. The EMBO journal 33, 157–170 (2014). [DOI] [PMC free article] [PubMed] [Google Scholar]
- 64.Distler U et al. In-depth protein profiling of the postsynaptic density from mouse hippocampus using data-independent acquisition proteomics. Proteomics 14, 2607–2613 (2014). [DOI] [PubMed] [Google Scholar]
- 65.Loh KH et al. Proteomic Analysis of Unbounded Cellular Compartments: Synaptic Clefts. Cell 166, 1295–1307 e1221 (2016). [DOI] [PMC free article] [PubMed] [Google Scholar]
- 66.Nakamura Y et al. Proteomic Characterization of Inhibitory Synapses Using a Novel pHluorin-tagged gamma-Aminobutyric Acid Receptor, Type A (GABAA), alpha2 Subunit Knock-in Mouse. The Journal of biological chemistry 291, 12394–12407 (2016). [DOI] [PMC free article] [PubMed] [Google Scholar]
- 67.de Hoon MJ, Imoto S, Nolan J & Miyano S Open source clustering software. Bioinformatics 20, 1453–1454 (2004). [DOI] [PubMed] [Google Scholar]
- 68.Lee EE et al. A Protein Kinase C Phosphorylation Motif in GLUT1 Affects Glucose Transport and is Mutated in GLUT1 Deficiency Syndrome. Molecular cell 58, 845–853 (2015). [DOI] [PMC free article] [PubMed] [Google Scholar]
- 69.Kinoshita E, Kinoshita-Kikuta E, Takiyama K & Koike T Phosphate-binding tag, a new tool to visualize phosphorylated proteins. Mol. Cell. Proteomics 5, 749–757 (2006). [DOI] [PubMed] [Google Scholar]
- 70.Vizcaino JA et al. ProteomeXchange provides globally coordinated proteomics data submission and dissemination. Nat Biotechnol 32, 223–226 (2014). [DOI] [PMC free article] [PubMed] [Google Scholar]
- 71.Deutsch EW et al. The ProteomeXchange consortium in 2017: supporting the cultural change in proteomics public data deposition. Nucleic acids research 45, D1100–D1106 (2017). [DOI] [PMC free article] [PubMed] [Google Scholar]
Associated Data
This section collects any data citations, data availability statements, or supplementary materials included in this article.
Supplementary Materials
Data Availability Statement
The mass spectrometry datasets include raw data files, search engine files and a full experimental summary file have been deposited to MassIVE70,71 (MSV000081865; PXD008558). Source data are provided with the online version of the paper. All other datasets generated and/or analyzed in the current study will be available from the corresponding author on reasonable request.


