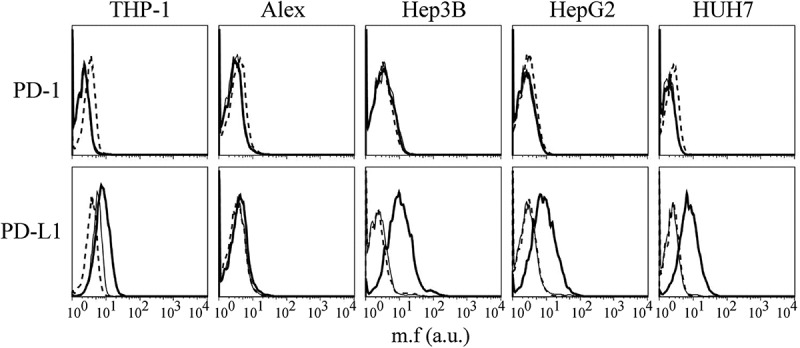
Figure 8.

PD-L1, but not PD-1, expression is induced by IFNγ in HCC cell lines.
PD-1 and PD-L1 cell surface expression in Alex, Hep3B, HepG2 and HUH7 HCC cell lines were assessed by immunofluorescence and FACS analysis before and after treatment with IFNγ for 72 hours. Histograms represent fluorescence profiles of the cells indicated on the top incubated with mouse specific anti PD-1 or PD-L1 mAbs followed by FITC-conjugated F(ab)2 anti-mouse antibody. Untreated (thin solid line) or treated with IFNγ (bold line). Cells incubated with FITC-conjugated F(ab)2 anti mouse antibody only (dashed line) were used as negative controls. Mean fluorescence (m.f.) values are expressed in the abscissa as arbitrary units (a.u.). A representative experiment is shown out of three independent experiments with very similar results.
