Abstract
FAM64A, a marker of cell proliferation, has been investigated as a potential biomarker in several cancers. In the present study, we examined the value of FAM64A expression in the diagnosis and prognosis of pancreatic cancer through bioinformatics analysis of data obtained from The Cancer Genome Atlas (TCGA) database. The diagnostic value of FAM64A expression in pancreatic cancer tissue was deteremined through receiver operating characteristic (ROC) curve analysis, and based on the obtained cut-off value, patients were divided into two groups (high FAM64A expression and low FAM64A expression). Chi-square and Fisher exact tests were applied to identify associations between FAM64A expression and clinical features. Moreover, the effect of FAM64A expression in the survival of pancreatic cancer patients was observed by Kaplan-Meier and Cox analyses. Gene set enrichment analysis (GSEA) was performed using the TCGA dataset. Our results showed that high FAM64A expression in pancreatic cancer was associated with survival status, overall survival (OS), and recurrence. The area under the ROC curve was 0.736, which indicated modest diagnostic value. Patients with higher FAM64A expression had significantly shorter OS and recurrence-free survival (RFS) times. Multivariate survival analysis demonstrated that high FAM64A expression was an independent risk factor for OS and RFS. GSEA identified mitotic spindles, myc targets, MTORC1 signaling, G2M checkpoint, E2F targets, DNA repair, glycolysis and unfolded protein response as differentially enriched with the high FAM64A expression phenotype. In conclusion, high FAM64A mRNA expression is an independent risk factor for poor prognosis in pancreatic cancer.
Introduction
Pancreatic cancer is associated with a high mortality rate worldwide. Although the global incidence is relatively low (about 8/100000 persons per year) [1], the 5-year survival rate is less than 5%. The poor survival rate is, in part, due to late detection of advanced stage disease, and thus, methods for early and accurate diagnosis of pancreatic cancer would help to improve outcomes for these patients. Currently, the diagnosis of pancreatic cancer is mainly based on imaging analyses, including computed tomography (CT) and magnetic resonance imaging (MRI). Unfortunately, even these imaging modalities are ineffective in some cases of pancreatic cancer [2]. Therefore, the identification of a reliable biomarker for pancreatic cancer diagnosis and prognosis has clinical significance.
Genome changes and self-sufficiency in growth signals are among the essential alterations that lead to malignant proliferation [3]. FAM64A, also referred to as PICALM Interacting Mitotic Regulator (gene symbol, PIMREG) [4], was first identified as a CALM (Clathrin Assembly Lymphoid Myeloid leukemia) interacting protein, expressed in response to mitogens. Expression of FAM64A influences the subcellular localization of CALM/AF10 and antagonizes the transactivation function of the leukemic fusion protein [5–7]. As a marker of cell proliferation, FAM64A protein expression is cell cycle-dependent [6, 8], and its expression level has been studied as a potential biomarker in several cancers in recent years [6, 9–12]. However, the potential roles of FAM64A expression in the diagnostic and prognostic evaluation of patients with pancreatic cancer have not yet been determined.
In the present study, we compared FAM64A mRNA expression between pancreatic cancer patients and healthy individuals. From an analysis of the diagnostic value of FAM64A, we divided patients into high and low FAM64A expression groups and searched for correlations between FAM64A expression and clinical features of pancreatic cancer as well as with patients’ overall survival (OS) and recurrence-free survival (RFS). Gene set enrichment analysis (GSEA) was performed to identify the signaling pathways related to the regulatory mechanism of FAM64A. Our results indicate that FAM64A may be a useful biomarker for the diagnosis and prognosis of pancreatic cancer.
Materials and methods
Data mining
Level 3 expression data were downloaded from The Cancer Genome Atlas (TCGA) database and estimated as log2(x+1) transformed RSEM normalized counts. Clinical information was also obtained from TCGA database. Expression data for normal pancreatic tissue was download from The Genotype-Tissue Expression (GTEx) database. All data were processed using R software (version 3.5.1) [13].
Statistical analysis
The expression of FAM64A in patients in the TCGA-Liver Hepatocellular Carcinoma (LIHC) dataset was evaluated using box plots. A received operating characteristic (ROC) curve was generated to evaluate the diagnostic value of FAM64A expression using the pROC package [14], and the area under curve (AUC) of ROC curve represents the diagnostic value. Patients were divided into two groups (high and low FAM64A expression) according to the threshold value identified from the ROC curve. The chi-square and Fisher exact tests were applied to identify correlations between FAM64A mRNA expression and clinical features of pancreatic cancer. OS and RFS were compared between the high and low FAM64A expression groups via Kaplan-Meier analysis, with p-values calculated by the log-rank test, using the Survival package in R [15, 16]. Univariate Cox analysis was performed to select potential prognostic factors, and multivariate Cox analysis was performed to verify the correlations between FAM64A expression and survival along with other clinical features. P<0.05 was considered statistically significant.
GSEA
To identify potential mechanisms underlying the influence of FAM64A expression on pancreatic cancer prognosis, GSEA was performed to detect whether an a priori defined set of genes showed statistically significant differential expression between the high and low FAM64A expression groups [17, 18]. Gene sets with a normal P-value <0.05 and false discovery rate (FDR) <0.25 were considered to be significantly enriched.
Results
Characteristics of the study population
The clinical data of 179 patients were downloaded from TCGA database, including patients’ age, gender, and alcohol consumption history as well as the anatomic location, histological type, histologic grade, clinical stage, TNM classification, residual tumor, therapy, survival status, and recurrence of pancreatic cancer (Table 1).
Table 1. Clinical characteristics of the pancreatic cancer patients.
| Characteristic | n (%) |
|---|---|
| Age | |
| <55 years | 34(18.99) |
| ≥55 years | 145(81.01) |
| Gender | |
| Female | 80(44.69) |
| Male | 99(55.31) |
| Alcohol consumption history | |
| No | 65(36.31) |
| Yes | 102(56.98) |
| Not available | 12(6.7) |
| Anatomic location | |
| Head of pancreas | 139(77.65) |
| Body of pancreas | 14(7.82) |
| Tail of pancreas | 15(8.38) |
| Other | 11(6.15) |
| Histological type | |
| Adenocarcinoma other subtype | 26(14.53) |
| Adenocarcinoma ductal type | 147(82.12) |
| Colloid carcinoma | 4(2.23) |
| Undifferentiated carcinoma | 1(0.56) |
| Not available | 1(0.56) |
| Histological grade | |
| G1 | 31(17.32) |
| G2 | 96(53.63) |
| G3 | 48(26.82) |
| G4 | 2(1.12) |
| GX | 2(1.12) |
| Stage | |
| I | 21(11.73) |
| II | 147(82.12) |
| III | 4(2.23) |
| IV | 5(2.79) |
| Not available | 2(1.12) |
| T classification | |
| T1 | 7(3.91) |
| T2 | 24(13.41) |
| T3 | 143(79.89) |
| T4 | 3(1.68) |
| TX | 1(0.56) |
| Not available | 1(0.56) |
| N classification | |
| N0 | 50(27.93) |
| N1 | 124(69.27) |
| NX | 4(2.23) |
| Not available | 1(0.56) |
| M classification | |
| M0 | 80(44.69) |
| M1 | 5(2.79) |
| MX | 94(52.51) |
| Residual tumor | |
| R0 | 107(59.78) |
| R1 | 53(29.61) |
| R2 | 5(2.79) |
| RX | 4(2.23) |
| Not available | 10(5.59) |
| Survival status | |
| Death | 93(51.96) |
| Survival | 86(48.04) |
| Recurrence | |
| No | 98(54.75) |
| Yes | 58(32.40) |
| Not available | 23(12.85) |
High FAM64A expression in pancreatic cancer
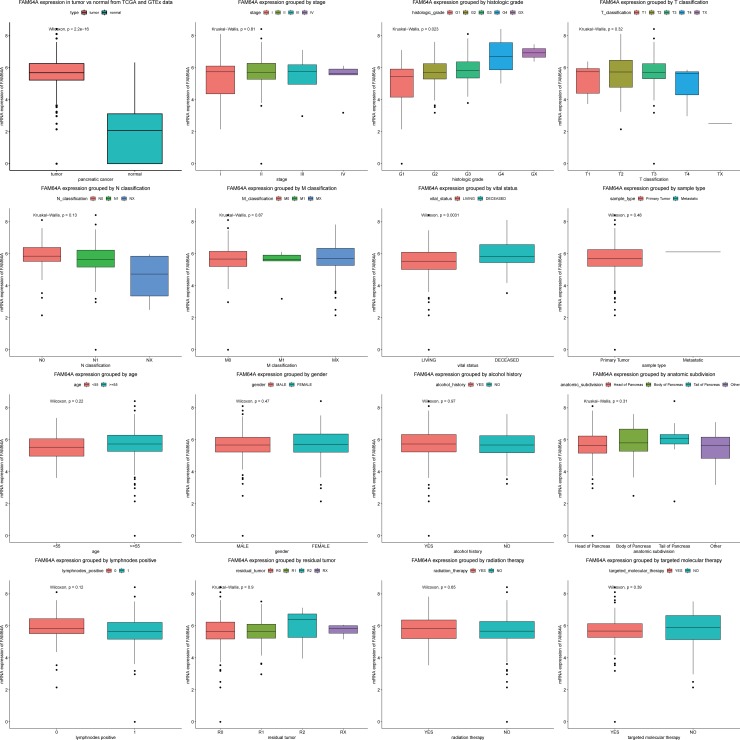
FAM64A expression in pancreatic cancer and normal tissues was compared (Fig 1), and the results indicated that FAM64A expression was elevated in pancreatic cancer (P<2.2e-16). Moreover, differences in FAM64A expression were observed according to histological grade (P = 0.029) and survival status (P = 0.0021).
Fig 1. FAM64A expression in pancreatic cancer.
FAM64A expression was compared between normal tissues and pancreatic cancer tissues as well as according to the cancer stage, histologic grade, anatomic location, TNM classification, survival status, sample type, patient age, gender, alcohol consumption history, lymph node positivity, residual tumor, treatment with radiation, and treatment with targeted molecular therapy.
Diagnostic value of FAM64A expression in pancreatic cancer
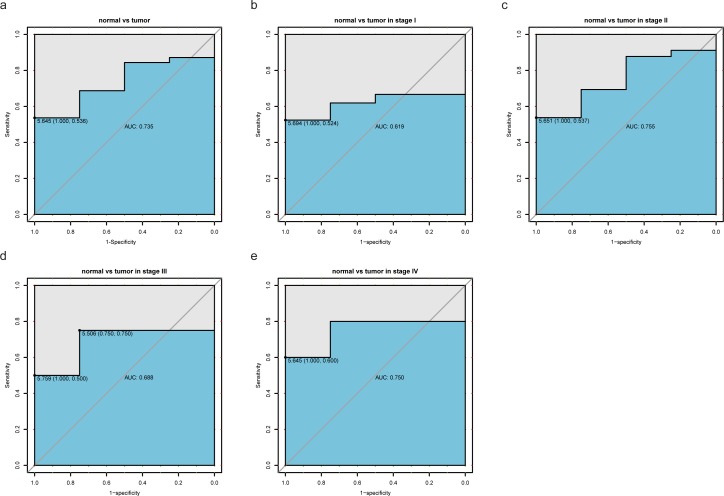
To assess the diagnostic value of FAM64A, we generated a ROC curve using the expression data from pancreatic cancer patients and healthy individuals (Fig 2A). The area under the ROC curve (AUC) was 0.735, which indicated modest diagnostic value. Subgroup analysis demonstrated the diagnostic value of FAM46A expression in different stages of pancreatic cancer, with AUC values of 0.619 for stage I disease, 0.755 for stage II disease, 0.688 for stage III disease, and 0.750 for stage IV disease (Fig 2B–2E).
Fig 2. Diagnosis value of FAM64A expression in pancreatic cancer.
(A) ROC curve for FAM64A expression in normal pancreatic tissue and pancreatic cancer. (B-E) Subgroup analysis for stage I, II, III, and IV pancreatic cancer.
Correlation between FAM64A expression and clinical features of pancreatic cancer
We divided patients into two groups (high versus low FAM64A expression) according to the threshold determined from the ROC curve. The associations identified between FAM64A expression and the clinical characteristics of pancreatic cancer cases are summarized in Table 2. Survival status (P = 0.0023) and recurrence (P = 0.0376) were significantly correlated with FAM64A expression.
Table 2. Relationship between the clinical features of pancreatic cancer and FAM64A expression.
| Features | Variable | n | FAM64A (%) | χ2 | P | |||
|---|---|---|---|---|---|---|---|---|
| High | Low | |||||||
| Age | <55 years | 34 | 18 | -15.38 | 16 | -25.81 | 2.224 | 0.136 |
| ≥55 years | 145 | 99 | -84.62 | 46 | -74.19 | |||
| Gender | Female | 80 | 55 | -47.01 | 25 | -40.32 | 0.487 | 0.485 |
| Male | 99 | 62 | -52.99 | 37 | -59.68 | |||
| Alcohol use history | No | 65 | 43 | -39.81 | 22 | -37.29 | 0.024 | 0.878 |
| Yes | 102 | 65 | -60.19 | 37 | -62.71 | |||
| Anatomic location | Body of pancreas | 14 | 9 | -7.69 | 5 | -8.06 | 3.288 | 0.349 |
| Head of pancreas | 139 | 88 | -75.21 | 51 | -82.26 | |||
| Other | 11 | 7 | -5.98 | 4 | -6.45 | |||
| Tail of pancreas | 15 | 13 | -11.11 | 2 | -3.23 | |||
| Histological type | Adenocarcinoma Other subtype | 26 | 14 | -12.07 | 12 | -19.35 | 2.319 | 0.509 |
| Adenocarcinoma ductal type | 147 | 98 | -84.48 | 49 | -79.03 | |||
| Colloid carcinoma | 4 | 3 | -2.59 | 1 | -1.61 | |||
| Undifferentiated carcinoma | 1 | 1 | -0.86 | 0 | 0 | |||
| Histologic grade | G1 | 31 | 16 | -13.68 | 15 | -24.19 | 4.334 | 0.363 |
| G2 | 96 | 65 | -55.56 | 31 | -50 | |||
| G3 | 48 | 33 | -28.21 | 15 | -24.19 | |||
| G4 | 2 | 1 | -0.85 | 1 | -1.61 | |||
| GX | 2 | 2 | -1.71 | 0 | 0 | |||
| Stage | I | 21 | 12 | -10.34 | 9 | -14.75 | 1.290 | 0.732 |
| II | 147 | 97 | -83.62 | 50 | -81.97 | |||
| III | 4 | 3 | -2.59 | 1 | -1.64 | |||
| IV | 5 | 4 | -3.45 | 1 | -1.64 | |||
| T classification | T1 | 7 | 4 | -3.45 | 3 | -4.84 | 3.799 | 0.434 |
| T2 | 24 | 13 | -11.21 | 11 | -17.74 | |||
| T3 | 143 | 97 | -83.62 | 46 | -74.19 | |||
| T4 | 3 | 2 | -1.72 | 1 | -1.61 | |||
| TX | 1 | 0 | 0 | 1 | -1.61 | |||
| N classification | N0 | 50 | 38 | -32.48 | 12 | -19.67 | 3.507 | 0.173 |
| N1 | 124 | 77 | -65.81 | 47 | -77.05 | |||
| NX | 4 | 2 | -1.71 | 2 | -3.28 | |||
| M classification | M0 | 80 | 50 | -42.74 | 30 | -48.39 | 0.877 | 0.645 |
| M1 | 5 | 4 | -3.42 | 1 | -1.61 | |||
| MX | 94 | 63 | -53.85 | 31 | -50 | |||
| Residual tumor | R0 | 107 | 68 | -62.39 | 39 | -65 | 0.334 | 0.954 |
| R1 | 53 | 35 | -32.11 | 18 | -30 | |||
| R2 | 5 | 3 | -2.75 | 2 | -3.33 | |||
| RX | 4 | 3 | -2.75 | 1 | -1.67 | |||
| Survival status | Death | 93 | 71 | -60.68 | 22 | -35.48 | 9.325 | 0.002 |
| Survival | 86 | 46 | -39.32 | 40 | -64.52 | |||
| Recurrence | No | 98 | 55 | -56.12 | 43 | -74.14 | 4.321 | 0.038 |
| Yes | 58 | 43 | -43.88 | 15 | -25.86 | |||
Bold values indicate P<0.05.
High FAM64A expression is an independent risk factor for OS among pancreatic cancer patients
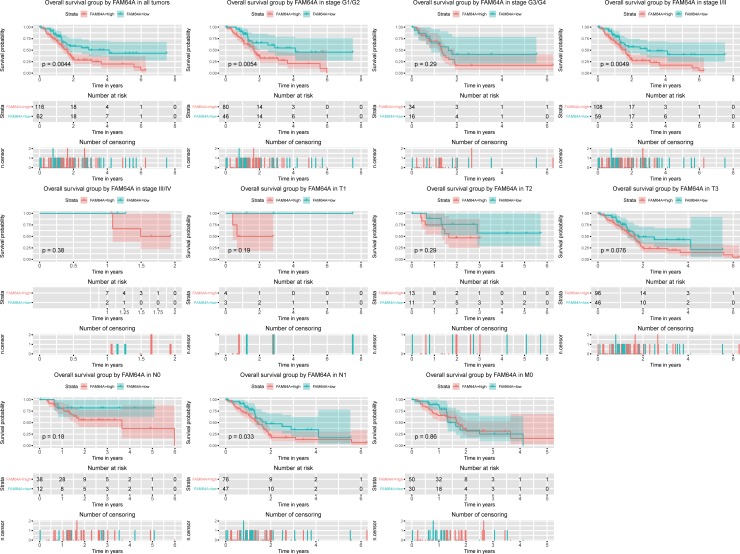
Kaplan-Meier curves showed that high FAM64A expression was associated with worse OS (P = 0.0044; Fig 3). Subgroup analysis indicated that high FAM64A expression significantly affected the OS in pancreatic cancer cases of histological grade G1/G2 (p = 0.0054), clinical stage Ⅰ/Ⅱ (p = 0.0049), and N1 (p = 0.033). Univariate and multivariate Cox analyses showed that FAM64A expression was an independent risk factor for OS among pancreatic cancer patients (hazard ratio [HR] = 1.87, 95% confidence interval [CI]: 1.14–3.06, P = 0.013, Table 3).
Fig 3. Kaplan-Meier curves for OS in pancreatic cancer.
Kaplan-Meier curves for OS in pancreatic cancer for all cases and cases of histologic grade G1/G2 and G3/G4; clinical stage Ⅰ/Ⅱ, and Ⅲ/Ⅳ; and TNM classification T1, T2, T3, N0, N1, and M0.
Table 3. Univariate analysis and multivariate analysis of the correlation of FAM64A expression with OS among pancreatic cancer patients.
| Parameter | Univariate analysis | Multivariate analysis | ||||
|---|---|---|---|---|---|---|
| HR | 95% CI | P | HR | 95% CI | P | |
| Age | 1.22 | 0.73–2.05 | 0.446 | |||
| Gender | 0.81 | 0.54–1.22 | 0.320 | |||
| Alcohol use history | 1.09 | 0.79–1.5 | 0.604 | |||
| Histological type | 2.07 | 1.36–3.16 | 0.001 | 1.71 | 1.09–2.7 | 0.020 |
| Histologic grade | 1.33 | 1.04–1.7 | 0.021 | 1.18 | 0.9–1.55 | 0.223 |
| Stage | 1.33 | 0.96–1.84 | 0.089 | |||
| T classification | 1.64 | 1.08–2.49 | 0.021 | 1.11 | 0.68–1.8 | 0.684 |
| N classification | 1.93 | 1.23–3.03 | 0.005 | 1.58 | 0.97–2.58 | 0.064 |
| M classification | 1.13 | 0.79–1.64 | 0.500 | |||
| Residual tumor | 1.36 | 1.06–1.76 | 0.018 | 1.43 | 1.1–1.86 | 0.008 |
| FAM64A | 1.99 | 1.23–3.22 | 0.005 | 1.87 | 1.14–3.06 | 0.013 |
Bold values indicate P<0.05. HR, hazard ratio; CI, confidence interval.
High FAM64A expression is an independent risk factor for RFS in pancreatic cancer patients
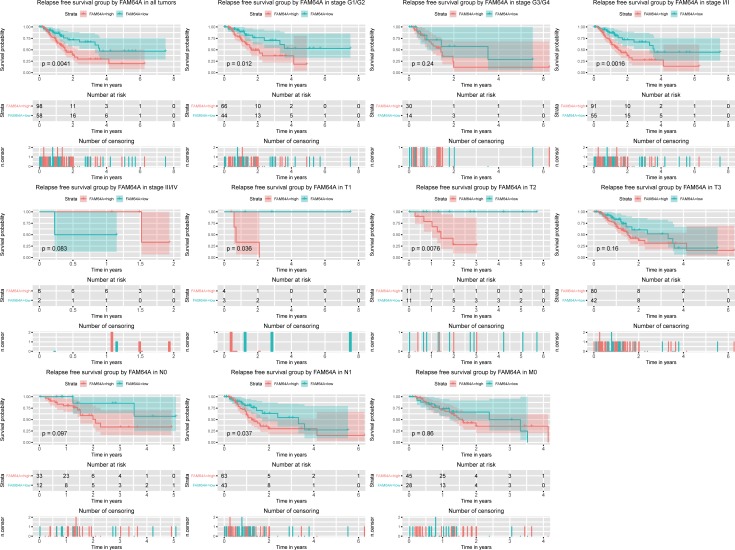
Kaplan-Meier curves for RFS showed that high FAM64A expression was associated with poor RFS (P = 0.0041; Fig 4). Subgroup analysis identified that high FAM64A expression correlated significantly with poor RFS in pancreatic cancer cases of histologic grade G1/G2 (p = 0.012), clinical stage Ⅰ/Ⅱ (p = 0.0016), T1 (p = 0.036), T2 (p = 0.0076), and N1 (p = 0.037). Univariate and multivariate Cox analyses confirmed the role of FAM64A expression as an independent risk factor for RFS in pancreatic cancer patients (HR = 2.5, 95%CI: 1.36–4.61, P = 0.003, Table 4).
Fig 4. Kaplan-Meier curves for RFS in pancreatic cancer.
Kaplan-Meier curves for RFS in all pancreatic cancer cases as well as cases of histologic grade G1/G2 and G3/G4; clinical stage Ⅰ/Ⅱ and Ⅲ/Ⅳ; and TNM classification T1, T2, T3, N0, N1, and M0.
Table 4. Univariate analysis and multivariate analysis of the correlation of FAM64A expression with RFS among pancreatic cancer patients.
| Parameter | Univariate analysis | Multivariate analysis | ||||
|---|---|---|---|---|---|---|
| HR | 95% CI | P | HR | 95% CI | P | |
| Age | 0.93 | 0.51–1.71 | 0.827 | |||
| Gender | 1.12 | 0.67–1.89 | 0.667 | |||
| Alcohol history | 1.22 | 0.79–1.87 | 0.364 | |||
| Histological type | 1.09 | 0.65–1.84 | 0.733 | |||
| Histologic grade | 1.56 | 1.13–2.17 | 0.007 | 1.51 | 1.07–2.14 | 0.020 |
| Stage | 1.41 | 0.98–2.04 | 0.064 | |||
| T classification | 1.51 | 0.94–2.41 | 0.088 | |||
| N classification | 2.03 | 1.17–3.52 | 0.012 | 1.87 | 1.06–3.3 | 0.032 |
| M classification | 1.42 | 0.92–2.21 | 0.116 | |||
| Residual tumor | 1.73 | 1.23–2.42 | 0.002 | 1.87 | 1.33–2.64 | 0.000 |
| FAM64A | 2.34 | 1.29–4.26 | 0.005 | 2.50 | 1.36–4.61 | 0.003 |
Bold values indicate P<0.05. HR, hazard ratio; CI, confidence interval.
GSEA identifies an FAM64A-related signaling pathway
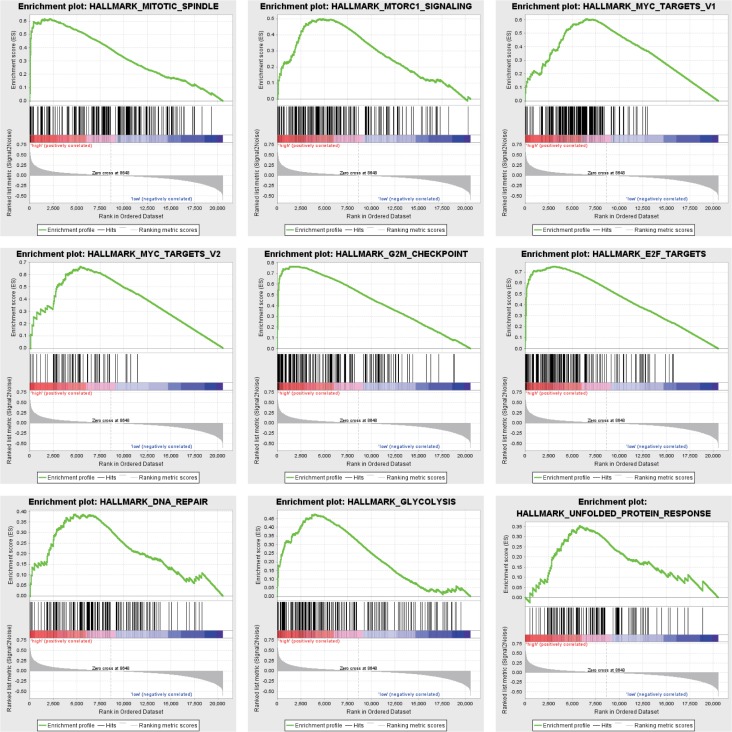
To identify signaling pathways activated in pancreatic cancer, we performed GSEA comparing the low and high FAM64A expression datasets. GSEA revealed significant differences (FDR <0.25, NOM P-value <0.05) in the enrichment of MSigDB Collection (h.all.v6.2.symbols.gmt), and the details are provided in Table 5. Gene sets related to mitotic spindles, myc targets, MTORC1 signaling, G2M checkpoint, E2F targets, DNA repair, glycolysis and unfolded protein response were differentially enriched with the high FAM64A expression phenotype (Fig 5).
Table 5. Gene sets enriched in the high FAM64A expression phenotype.
| Gene set name | NES | NOM p-val | FDR q-val |
|---|---|---|---|
| HALLMARK_MITOTIC_SPINDLE | 2.133 | 0.000 | 0.018 |
| HALLMARK_MYC_TARGETS_V2 | 2.065 | 0.004 | 0.016 |
| HALLMARK_MTORC1_SIGNALING | 2.033 | 0.004 | 0.012 |
| HALLMARK_MYC_TARGETS_V1 | 1.983 | 0.004 | 0.015 |
| HALLMARK_G2M_CHECKPOINT | 1.982 | 0.000 | 0.012 |
| HALLMARK_E2F_TARGETS | 1.930 | 0.000 | 0.015 |
| HALLMARK_DNA_REPAIR | 1.928 | 0.006 | 0.013 |
| HALLMARK_GLYCOLYSIS | 1.803 | 0.000 | 0.025 |
| HALLMARK_UNFOLDED_PROTEIN_RESPONSE | 1.772 | 0.049 | 0.026 |
NES: normalized enrichment score; NOM: nominal; FDR: false discovery rate. Gene sets with NOM P-value <0.05 and FDR q-value <0.25 were considered as significantly enriched.
Fig 5. Enrichment plots from GSEA.
GSEA results showing differential enrichment of genes related to mitotic spindles, myc targets, MTORC1 signaling, G2M checkpoint, E2F targets, DNA repair, glycolysis and unfolded protein response in pancreatic cancer cases with high FAM64A expression.
Discussion
Our study found that the high FAM64A expression was associated with poor survival status and recurrence in pancreatic cancer. Kaplan-Meier curves for OS and RFS also showed that higher expression of FAM64A was associated with worse outcomes in pancreatic cancer patients. Univariate and multivariate Cox analyses indicated the FAM64A mRNA expression may be a useful biomarker for pancreatic cancer prognosis, and ROC analysis confirmed the diagnostic value of FAM64A expression in pancreatic cancer.
In the field of oncology, Archangelo et al. first reported the high FAM64A expression in hematologic carcinomas, including leukemia and lymphoma [6]. However, few studies have investigated FAM64A expression in solid tumors. Zhang et al. [11] and Yamada et al. [12] found that FAM64A is upregulated in triple negative breast cancer and renal cell carcinoma, respectively. The present study demonstrated high FAM64A expression in pancreatic cancer, which is consistent with other findings for FAM64A expression in tumors. ROC analysis provided evidence that FAM64A could be developed as a biomarker for the diagnosis of pancreatic cancer, and we found that distinct histologic grades and survival status were associated with FAM64A expression, which suggests a possible relationship between FAM64A expression and survival in pancreatic cancer.
Many studies have reported that FAM64A plays an important role in malignant transformation. Archangelo et al. also found that the expression of FAM64A is elevated during mouse embryogenesis [6]. Hashimoto et al. showed that knockdown of the FAM64A gene in fetal cardiomyocytes leads to repression of cell cycle genes and Ki67 downregulation [19]. Barbutti et al. demonstrated that cell proliferation and cell cycle progression are correspondingly reduced upon silencing of FAM64A in the U937 cell line or MDA-MB-231 cells [9]. Based on these reports, higher expression of FAM64A indicates the promotion of cell proliferation, which might contribute to worse outcomes in pancreatic cancer patients. Yamada et al. also demonstrated the value of FAM64A expression in the prognosis of breast cancer and renal cell carcinoma [12]. Hu et al. explored the prognostic role of FAM64A expression in a variety of cancer types, including pancreatic cancer [10]. Consistently, our results showed that FAM64A expression was correlated with OS in patients with pancreatic cancer, and the potential mechanism may be related with mitotic spindles, myc targets, MTORC1 signaling, G2M checkpoint, E2F targets, DNA repair, glycolysis and unfolded protein response as GSEA identified. In addition, we further explored the prognostic value of FAM64A expression in different subgroups of pancreatic cancer and found that high FAM64A expression correlated significantly with G1/G2, stage I/II, and N1 cases.
At present, surgery is the only curable treatment for pancreatic cancer [20]. However, the possibility of recurrence, which adversely impacts patients’ outcomes, is an important factor in the choice of treatment. Here we also explored the correlation of FAM64A expression with recurrence, and found that this potential biomarker may help to guide treatment selection in pancreatic cancer patients. High expression of FAM64A also negatively affected OS and RFS among patients in with histological grade G1/G2 and clinical stage Ⅰ/Ⅱ cancers, but not with histological grade G3/G4 and clinical stage Ⅲ/Ⅳ cancers, which further demonstrates the specific prognostic role of FAM64A expression in subgroup analysis and its potential contribution to precision therapy for pancreatic cancer. However, the reduce number of patients evaluated in the later stages is a limitation in this study, future work need to expend the sample size to verify this conclusion.
Overall, our study provides evidence of the diagnostic and prognostic value of FAM64A expression in pancreatic cancer patients. However, the diagnostic and prognostic roles of high FAM64A expression were limited to stage Ⅰ and Ⅱ cases, and further identification of effective biomarkers in pancreatic cancer cases of advanced stage is imperative in the future.
Conclusion
Our data demonstrate that FAM64A is upregulated in pancreatic cancer, and elevated FAM64A expression correlates with clinical progression and serves as an independent risk factor for OS and RFS in pancreatic cancer patients. Our findings suggest that FAM64A may be a useful biomarker in the diagnosis and prognosis of pancreatic cancer.
Acknowledgments
The authors extend our deepest gratitude to Mr. Xie Tianzhong and Dr Chen Fuzhou, who provided assistance in the early stage of manuscript writing.
Data Availability
All relevant data are within the manuscript.
Funding Statement
The authors received no specific funding for this work.
References
- 1.Yadav D, Lowenfels AB. The epidemiology of pancreatitis and pancreatic cancer. Gastroenterology. 2013;144(6):1252–61. 10.1053/j.gastro.2013.01.068 [DOI] [PMC free article] [PubMed] [Google Scholar]
- 2.Zhang L, Sanagapalli S, Stoita A. Challenges in diagnosis of pancreatic cancer. World J Gastroenterol. 2018;24(19):2047–60. Epub 2018/05/23. 10.3748/wjg.v24.i19.2047 [DOI] [PMC free article] [PubMed] [Google Scholar]
- 3.Tony G, Sven DJRB. The hallmarks of cancer. 2012;9(6):703–19. 10.4161/rna.20481 [DOI] [PMC free article] [PubMed] [Google Scholar]
- 4.Stelzer G, Rosen N, Plaschkes I, Zimmerman S, Twik M, Fishilevich S, et al. The GeneCards Suite: From Gene Data Mining to Disease Genome Sequence Analyses: The GeneCards Suite: John Wiley & Sons, Inc.; 2016. 1.30.1 p. [DOI] [PubMed] [Google Scholar]
- 5.Archangelo LF, Glasner J, Krause A, Bohlander SK. The novel CALM interactor CATS influences the subcellular localization of the leukemogenic fusion protein CALM/AF10. Oncogene. 2006;25(29):4099–109. Epub 2006/02/24. 10.1038/sj.onc.1209438 . [DOI] [PubMed] [Google Scholar]
- 6.Archangelo LF, Greif PA, Holzel M, Harasim T, Kremmer E, Przemeck GK, et al. The CALM and CALM/AF10 interactor CATS is a marker for proliferation. Mol Oncol. 2008;2(4):356–67. 10.1016/j.molonc.2008.08.001 [DOI] [PMC free article] [PubMed] [Google Scholar]
- 7.Archangelo LF, Greif PA, Maucuer A, Manceau V, Koneru N, Bigarella CL, et al. The CATS (FAM64A) protein is a substrate of the Kinase Interacting Stathmin (KIS). Biochim Biophys Acta. 2013;1833(5):1269–79. 10.1016/j.bbamcr.2013.02.004 . [DOI] [PubMed] [Google Scholar]
- 8.Kimes PK, Cabanski CR, Wilkerson MD, Zhao N, Johnson AR, Perou CM, et al. SigFuge: single gene clustering of RNA-seq reveals differential isoform usage among cancer samples. Nucleic Acids Res. 2014;42(14):e113 10.1093/nar/gku521 [DOI] [PMC free article] [PubMed] [Google Scholar]
- 9.Barbutti I, Xavier-Ferrucio JM, Machado-Neto JA, Ricon L, Traina F, Bohlander SK, et al. CATS (FAM64A) abnormal expression reduces clonogenicity of hematopoietic cells. Oncotarget. 2016;7(42):68385–96. 10.18632/oncotarget.11724 [DOI] [PMC free article] [PubMed] [Google Scholar]
- 10.Hu S, Yuan H, Li Z, Zhang J, Wu J, Chen Y, et al. Transcriptional response profiles of paired tumor-normal samples offer novel perspectives in pan-cancer analysis. Oncotarget. 2017;8(25):41334–47. 10.18632/oncotarget.17295 [DOI] [PMC free article] [PubMed] [Google Scholar]
- 11.Zhang C, Han Y, Huang H, Min L, Qu L, Shou C. Integrated analysis of expression profiling data identifies three genes in correlation with poor prognosis of triple-negative breast cancer. Int J Oncol. 2014;44(6):2025–33. 10.3892/ijo.2014.2352 . [DOI] [PubMed] [Google Scholar]
- 12.Yamada Y, Arai T, Kojima S, Sugawara S, Kato M, Okato A, et al. Regulation of antitumor miR-144-5p targets oncogenes: Direct regulation of syndecan-3 and its clinical significance. Cancer Sci. 2018. 10.1111/cas.13722 . [DOI] [PMC free article] [PubMed] [Google Scholar]
- 13.Team RDC. R: A language and environment for statistical computing R Foundation for Statistical Computing, Vienna, Austria: Computing. 2012;1:12–21. [Google Scholar]
- 14.Robin X, Turck N, Hainard A, Tiberti N, Lisacek F, Sanchez JC, et al. pROC: an open-source package for R and S+ to analyze and compare ROC curves. BMC Bioinformatics. 2011;12:77 Epub 2011/03/19. 10.1186/1471-2105-12-77 [DOI] [PMC free article] [PubMed] [Google Scholar]
- 15.Therneau TM, April. A Package for Survival Analysis in S. 2015.
- 16.Therneau TM, Grambsch PM. Modeling Survival Data: Extending the Cox Model. Technometrics. 2000;97(457):353–4. [Google Scholar]
- 17.Mootha VK, Lindgren CM, Eriksson KF, Subramanian A, Sihag S, Lehar J, et al. PGC-1alpha-responsive genes involved in oxidative phosphorylation are coordinately downregulated in human diabetes. 2003;34(3):267–73. 10.1038/ng1180 [DOI] [PubMed] [Google Scholar]
- 18.Subramanian A, Tamayo P, Mootha VK, Mukherjee S, Ebert BL, Gillette MA, et al. Gene set enrichment analysis: a knowledge-based approach for interpreting genome-wide expression profiles. Proc Natl Acad Sci U S A. 2005;102(43):15545–50. Epub 2005/10/04. 10.1073/pnas.0506580102 [DOI] [PMC free article] [PubMed] [Google Scholar]
- 19.Hashimoto K, Kodama A, Honda T, Hanashima A, Ujihara Y, Murayama T, et al. Fam64a is a novel cell cycle promoter of hypoxic fetal cardiomyocytes in mice. Sci Rep. 2017;7(1):4486 10.1038/s41598-017-04823-1 [DOI] [PMC free article] [PubMed] [Google Scholar]
- 20.Kamisawa T, Wood L, Itoi T, Takaori K. Pancreatic cancer. Lancet. 2016;388(10039):73–85. 10.1016/S0140-6736(16)00141-0 [DOI] [PubMed] [Google Scholar]
Associated Data
This section collects any data citations, data availability statements, or supplementary materials included in this article.
Data Availability Statement
All relevant data are within the manuscript.


