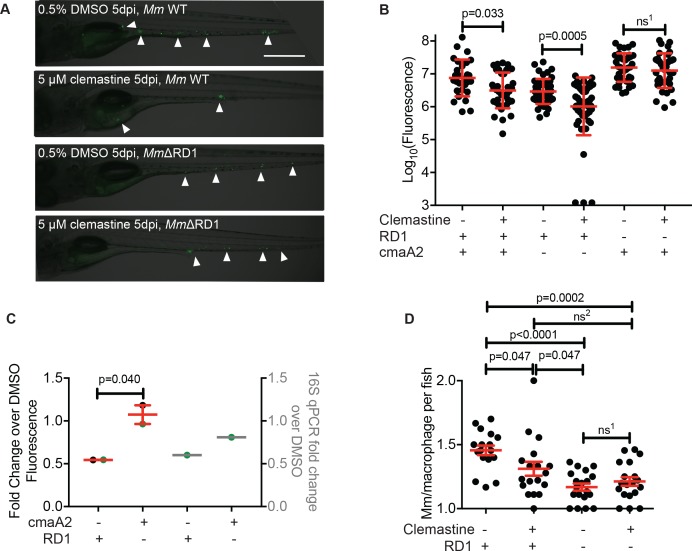
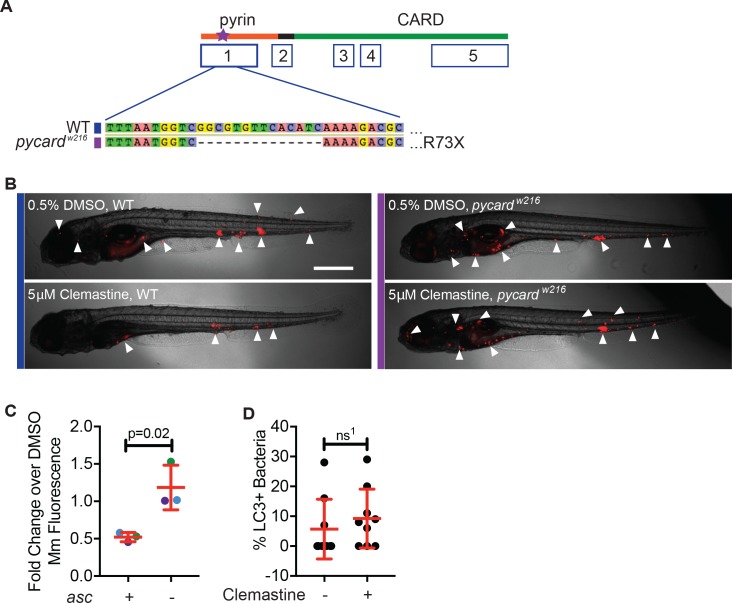
Figure 5. Clemastine efficacy requires cytosolic access and inflammasome signaling.
(A) Quantification of bacterial burden of Mm:Wasabi and MmΔRD1:Wasabi in wildtype larvae treated with 0.5% DMSO or 5 µM clemastine, five dpi. Representative of three independent experiments. Each dot represents an individual animal’s bacterial burden by fluorescence. Red dots denote the animals represented in Figure 5—figure supplement 1A. (B) Quantification of bacterial burden of Mm:tdTomato in pycard (asc) mutants and wildtype/heterozygous siblings after 0.5% DMSO or 5 µM clemastine treatment, 5dpi. Each dot represents an individual animal’s bacterial burden by fluorescence. Representative of three independent experiments. Blue (WT/het) and purple (asc mutants) dots denote representative larvae in Figure 5—figure supplement 2B. Fold change over DMSO for each genotype is presented in Figure 5—figure supplement 2C. (A) Ordinary one-way ANOVA with Tukey’s multiple comparison test. All error bars are s.d. ns1 > 0.9999, ns2 = 0.9452, ns3 = 0.9430. (B) One-way ANOVA with Tukey’s multiple comparison test. All error bars are s.d. ns1 = 0.9998, ns2 = 0.5798, ns3 = 0.3723. p Values from statistical tests on untransformed data are provided in Supplementary file 2.


