

ABSTRACT
Autophagy-lysosome pathway (ALP) disruption is considered pathogenic in multiple neurodegenerative diseases; however, current methods are inadequate to investigate macroautophagy/autophagy flux in brain in vivo and its therapeutic modulation. Here, we describe a novel autophagy reporter mouse (TRGL6) stably expressing a dual-fluorescence-tagged LC3 (tfLC3, mRFP-eGFP-LC3) by transgenesis selectively in neurons. The tfLC3 probe distributes widely in the central nervous system, including spinal cord. Expression levels were similar to endogenous LC3 and induced no detectable ALP changes. This ratiometric reporter registers differential pH-dependent changes in color as autophagosomes form, fuse with lysosomes, acidify, and degrade substrates within autolysosomes. We confirmed predicted changes in neuronal autophagy flux following specific experimental ALP perturbations. Furthermore, using a third fluorescence label in TRGL6 brains to identify lysosomes by immunocytochemistry, we validated a novel procedure to detect defective autolysosomal acidification in vivo. Thus, TRGL6 mice represent a unique tool to investigate in vivo ALP dynamics in specific neuron populations in relation to neurological diseases, aging, and disease modifying agents.
Abbreviations: ACTB: actin, beta; AD: Alzheimer disease; AL: autolysosomes; ALP: autophagy-lysosome pathway; AP: autophagosome; APP: amyloid beta (Abeta) precursor protein; ATG5: autophagy related 5; ATG7: autophagy related 7; AV: autophagic vacuoles; CNS: central nervous system; CTSD: cathepsin D; CQ: chloroquine; DMEM: Dulbecco’s modified Eagle’s medium; GFP: green fluorescent protein; GABARAP: gamma-aminobutyric acid receptor associated protein; GABARAPL2/GATE16: gamma-aminobutyric acid (GABA) receptor-associated protein-like 2; ICC: immunocytochemistry; ICV: intra-cerebroventricular; LAMP2: lysosomal-associated membrane protein 2; Leup: leupeptin; LY: lysosomes; MAP1LC3/LC3: microtubule-associated protein 1 light chain 3; MTOR: mechanistic target of rapamycin kinase; RBFOX3/NeuN: RNA binding protein, fox-1 homolog (C. elegans) 3; RFP: red fluorescent protein; RPS6KB1: ribosomal protein S6 kinase, polypeptide 1; SDS-PAGE: sodium dodecyl sulfate-polyacrylamide gel electrophoresis; SQSTM1: sequestosome 1; tfLC3: mRFP-eGFP-LC3; TRGL6: Thy1 mRFP eGFP LC3-line 6; PCR: polymerase chain reaction; PD: Parkinson disease
KEYWORDS: Acidification, autophagosome, cathepsin, lysosome, microtubule associated protein 1 light chain 3 (LC3), neurodegeneration, pH
Introduction
Autophagy is a major lysosomal pathway for degrading cytoplasmic constituents and is the principal mechanism for turning over organelles [1]. The autophagy-lysosome pathway (ALP) comprises multiple distinct processes, including autophagy induction, substrate sequestration within a forming autophagosome (AP), fusion of the AP with a lysosome (LY) to form an autolysosome (AL), and substrate degradation within the AL. Genetic or metabolic disruptions of the ALP have been linked to the pathogenesis of multiple neurodegenerative disorders, including Alzheimer disease (AD), Parkinson disease (PD), and amyotrophic lateral sclerosis (ALS) [2–5]. Studies on the involvement of the ALP in neurological disease have mainly relied on analyses in vitro or static immunocytochemical analysis using a specific organelle marker for AP or LY in tissues. A reliable assessment of cerebral autophagy and its impairment in neurodegenerative disease requires that changes in the behavior of one vesicular component of the autophagy pathway be interpreted in relationship to changes in the other pathway components. This has been challenging, especially within the heterogeneous cellular milieu of the brain.
Only a few efforts to assess in vivo ALP activity in brain have been reported. The most widely applied autophagy reagent for this purpose is the Atg8-family protein LC3 which, in its lipidated form (LC3-II), is a selective marker of APs that is subsequently degraded upon AP-LY fusion. An increased number of LC3-positive puncta in brain, detected immunocytochemically or after transgenic expression of LC3 tagged with a single label, is commonly considered a measure of autophagy activation and increased AP formation [1,6,7]. A limitation of this approach, however, is the highly efficient clearance of APs by LYs in healthy neurons [8], which underestimates autophagy activity (flux) when solely based on numbers of LC3-positive puncta. Conversely, an impairment of lysosomal function causes LC3-II to accumulate in ALs confounding the interpretation of AP number and the estimation of flux [9]. A battery of methods is, therefore, required to evaluate autophagy flux reliably, which is difficult to apply to the highly heterogeneous cell populations within brain tissue.
Given these potential limitations, a more advanced assay was developed to monitor cellular ALP in vitro based on expressing a tandem fluorescently tagged LC3 protein (mRFP-eGFP-LC3, tfLC3) [10]. The utility of this probe exploits the fluorescence quenching of eGFP at the acidic pH achieved after an AP fuses with an LY, whereas mRFP fluorescence remains stable at this lowered pH. Consequently, tfLC3 associated with APs appears as yellow (eGFP-mRFP) puncta but, upon fusion with an LY, the resultant AL progresses from orange to red as it achieves the highly acidic pH of the lysosome [11]. The pH-dependent ratiometric color change enables a more complete assessment of autophagy flux (AP formation and maturation through to AP clearance). Furthermore, as we show in this report, when immunohistochemistry using a LY marker is additionally applied, ALs can be further discriminated as mature ALs that have fully acidified or immature or defective ALs that are incompletely acidified. This provides a unique opportunity, in an in vivo context, to identify abnormalities of autolysosomal acidification and also to estimate the pool size of lysosomes not presently engaged in autophagy.
So far, use of tfLC3 or mCherry-GFP-LC3 has only been applied using transfection or viral transduction approaches in neuronal culture or mouse brain, respectively [12,13], wherein the level of expression of the probe may vary among different animals, and detailed information on autophagy in brain is lacking. A CAG-RFP-EGFP-Lc3 transgene has been used but only in a study of kidney [14] and is unsuited for the cell-heterogeneous brain, highlighting the need for a neuron-specific tfLC3 mouse model to research the healthy and diseased brain. The need for a useful probe for in vivo autophagy flux is particularly urgent in light of evidence for robust ALP pathology linked to genetic mutations causing multiple neurodegenerative diseases [3,4,15] and a dearth of ways to evaluate the target engagement and efficacy of ALP modulators in vivo in brain.
We have addressed these research needs by generating a novel neuron-specific autophagy reporter tfLC3 mouse, TRGL6 (Thy1 mRFP-eGFP-LC3, Line 6), and report here that TRGL6 mice exhibited the predicted autophagy flux and AL acidification abnormalities when LY proteolysis or pH is pharmacologically altered. In addition to validating the utility of TRGL6 mice, we provide novel insights into the patterns of AP maturation into lysosomes in different neuron populations in the intact adult brain in vivo and their response to experimental lysosomal perturbations that previously could only be tracked by growing cultured neurons in vitro.
Results
TRGL6 mice stably express tfLC3 widely in neuronal populations of the CNS
To enable sensitive in vivo autophagy monitoring, we generated neuron-specific reporter mice that express a tandem fluorescently tagged LC3 protein (tfLC3, mRFP-eGFP-LC3) [10] driven by the Thy1 promoter. We first cloned mRFP-eGFP-LC3 construct into a Thy1-expression construct as described previously [16] (Figure 1A). We identified the transgene founders with a forward primer in the Thy1 promoter and a reverse primer in the C-terminal region of the gene encoding mRFP to generate a transgene-specific 750-base pair PCR product (Figure 1B). The M6 line that had the best expression of mRFP-eGFP-LC3 in neurons were maintained in the C57BL background, hereafter termed TRGL6 (Thy1 mRFP-eGFP-LC3, Line 6) mice. In lysates of TRGL6 mouse brain and spinal cord, tfLC3 was detected at approximately 75 kDa by immunoblotting with either anti-RFP, -GFP, or -LC3 antibodies. Levels of tfLC3 expression in brain and spinal cord were similar to endogenous LC3, and, importantly, the expressed tfLC3 displayed minimal evidence of the truncation of the tandem (mRFP-eGFP) tag (Figure 1C, #2 lanes). The extra band seen in anti-RFP (brain) and anti-LC3 (spinal cord) is also observed in non-transgenic animals, indicating that this band is a nonspecific immunoreactive band rather than a breakdown product of tfLC3. The extra band seen with anti-GFP (brain sample lane) is also likely nonspecific. If eGFP were cleaved, an mRFP-only band (28–30 kDa) would also be expected by WB, because eGFP is located between mRFP and LC3; however, we did not detect anti-mRFP-positive products near 28 ~ 30 kDa. Nevertheless, we cannot exclude tfLC3 degradation because it is assumed to take place in autolysosomes/lysosomes as they degrade autophagic substrates, including LC3. An additional distinct advantage of the Thy1 promoter is its selective expression in neuronal cells and its developmental regulation, which programs the predominant increase in tfLC3 expression postnatally. Moreover, we found that tfLC3 expression was stable for at least 21 months – the oldest age so far examined.
Figure 1.
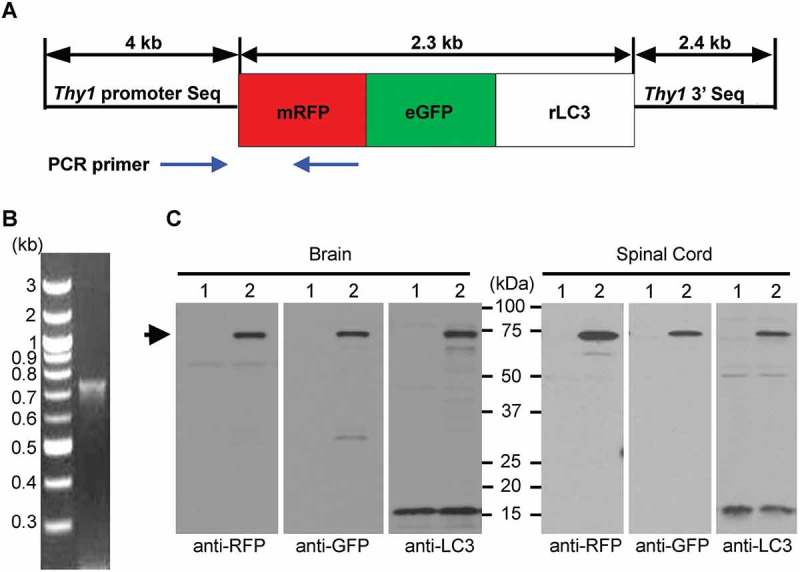
Design and expression of dually-tagged autophagy sensor in mouse brain. (A) Schematic representation of the dually-tagged autophagy sensor, mRFP-eGFP-LC3 (tfLC3) with the Thy1 promoter. (B) Identification of the transgene founders with a forward primer in the Thy1 promoter and a reverse primer in the C-terminal region of the RFP gene to generate a transgene-specific 750-base pair PCR product. (C) The tfLC3 expression was confirmed by immunoblotting with RFP, GFP, and LC3 antibodies in brain and spinal cord samples from 3-month-old TRGL6 mice. Lane 1: WT; Lane 2: TRGL6; the arrow indicates tfLC3.
We first examined tfLC3 expression by confocal imaging of sections of neocortex from 6-month-old TRGL6 and non-transgenic littermate mouse brains using an eGFP and mRFP filter set. These analyses revealed a basal neuronal autophagic level characterized by red (eGFP fluorescence quenched tfLC3) puncta mainly within the perikarya of neurons, which represented acidified ALs/LYs in their expected subcellular location [17]. By contrast, yellow puncta, representing APs, were rarely seen in the perikarya of normal TRGL6 mouse cortical neurons (Figure 2A), consistent with previous studies showing that AP clearance in healthy neurons is very efficient [8]. Diffuse cytosolic yellow color (unquenched eGFP and mRFP fluorescence) reflected the abundance of LC3-I in neurons [12]. Cytoplasmic LC3-I, which is not directly engaged in AP formation [9], produced a diffuse tfLC3 fluorescence signal in dendritic and axonal processes that partially obscured the occasional presence of pre-lysosomal autophagic vacuoles. Small numbers of yellow puncta were detectable in these neuronal compartments reflecting the expected presence of APs (Figure 2B, arrowhead) and documenting that both APs and ALs can be visualized in TRGL6 mice. The rare presence of yellow puncta in axons and distal dendritic branches confirms earlier studies showing that newly formed AP become fully acidified AL as they move in a retrograde direction and approach or enter the neuronal perikaryon [17–19].
Figure 2.
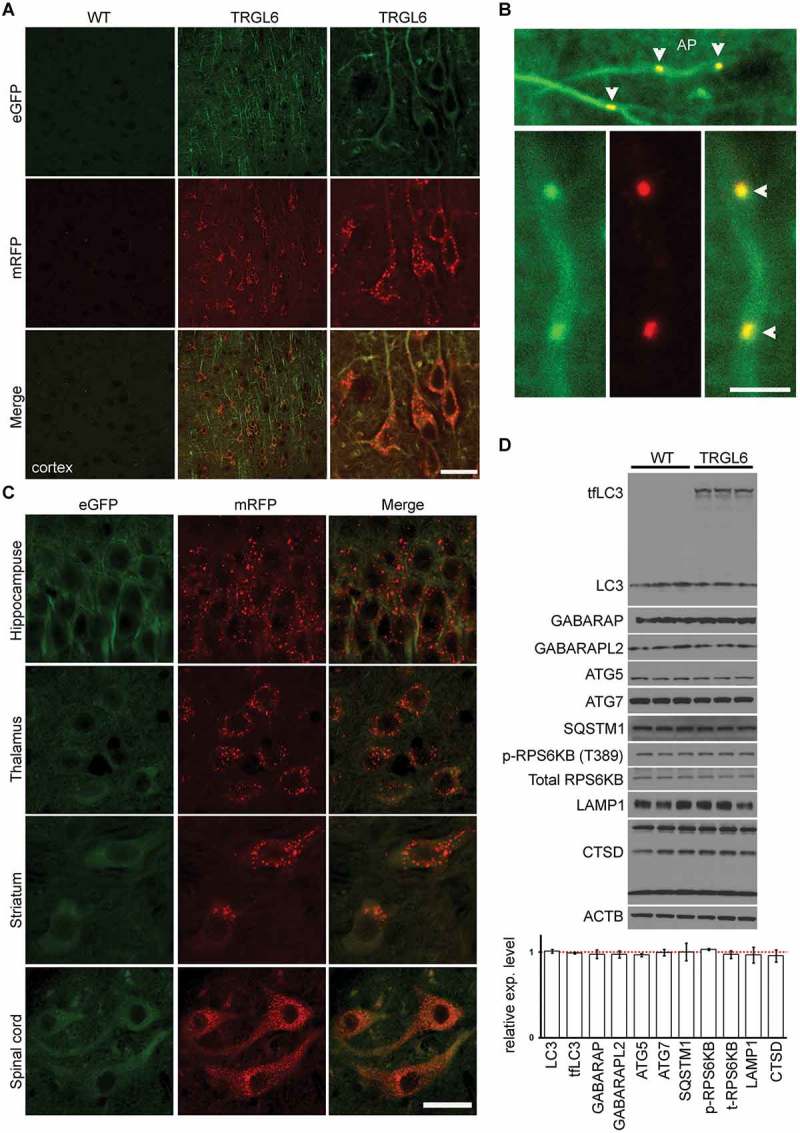
Thy1-mRFP-eGFP-LC3 expression in 6-month-old tfLC3 mouse brain. (A) Confocal fluorescence images show ubiquitous expression of tfLC3 in cortical neuronal populations of TRGL6 mice, compared to non-transgenic littermates. Scale bar: 20 μm. (B) Higher magnification images of the neurons of 6-month-old TRGL6 mice in neuronal processes; occasional yellow puncta (AP, arrowhead) appeared. Scale bar: 5 μm. (C) tfLC3 is also expressed in the hippocampus, thalamus, striatum, and spinal cord of TRGL6 mice. Scale bar: 50 μm. (D) The levels of autophagy-related proteins were not changed in the brain of 6-month-old TRGL6 mice. Quantitative data for each protein marker are relative to WT levels (red dotted line) and expressed as mean± SEM (n = 3/genotype). Red dotted line indicates the levels in WT mice.
In addition to cortical areas, we observed widespread expression of the tfLC3 protein in neuronal populations throughout the brain, including the hippocampus, thalamus, striatum, and spinal cord in TRGL6 mice. These patterns accord with established Thy1-mediated transgene expression and subcellular distribution of endogenous LC3, which comprises diffuse cytosolic LC3-I and vesicular compartments (puncta) reflecting AP-associated LC3-II [20]. Despite the overall similar expression levels of tfLC3 in CNS regions, we observed somewhat distinctive patterns of autophagy compartments, such as lysosomes exclusively in perikarya of certain neuronal populations (e.g., cortical and hippocampal pyramidal neurons) but the additional presence of immature AL and mature AL in striatal and spinal cord motor neurons (Figure 2C) suggesting varying rates of AL maturation in different neuronal populations [21,22].
Next, to investigate whether the tfLC3 transgene alters basal autophagy relative to that in wild-type (WT) mice, we analyzed various ALP marker proteins and established that levels of endogenous LC3 and 2 other mammalian homologs of yeast ATG8, GABARAP (gamma-aminobutyric acid receptor associated protein) and GABARAPL2/GATE16 (gamma-aminobutyric acid [GABA] receptor-associated protein-like 2) were not altered by the presence of the tfLC3 transgene. Also, there was no evident autophagy upregulation (ATG5, ATG7, p-RPS6KB, SQSTM1, LAMP1 and CTSD [cathepsin D]) in TRGL6 mice compared to age-matched WT littermates (Figure 2D).
Immunostaining for neuronal and glial markers confirmed that tfLC3 expression was restricted to neurons. Whereas 97.3% of the RBFOX3/NeuN-positive neurons were labeled by tfLC3 in the cortex (Figure 3A), none of the GFAP-positive astrocytes or IBA1-positive microglia exhibited tfLC3 fluorescence. The same specificity pattern was seen throughout the brain (such as hippocampus, thalamus, striatum), establishing therefore that expression of the tfLC3 construct is strictly neuron specific. We were able to distinguish AL compartments in different stages of maturation from APs by probing TRGL6 mouse brain sections with a third fluorescent label (far red wavelength, visualized with blue color) to identify compartments enriched in the lysosomal membrane markers LAMP2 or CTSD. As predicted, red tfLC3-positive compartments invariably contained LAMP2 or CTSD, generating a purple color (Figure 3B) identifying them unequivocally as ALs in the brain. Notably, neuronal perikarya also contained a population of blue LAMP2- or CTSD-positive compartments (0.2 ~ 1 μm diameter range) lacking LC3 substrate, which correspond to late endosomes or lysosomes that either have completely digested their autophagic cargoes or are not engaged in autophagy [23].
Figure 3.
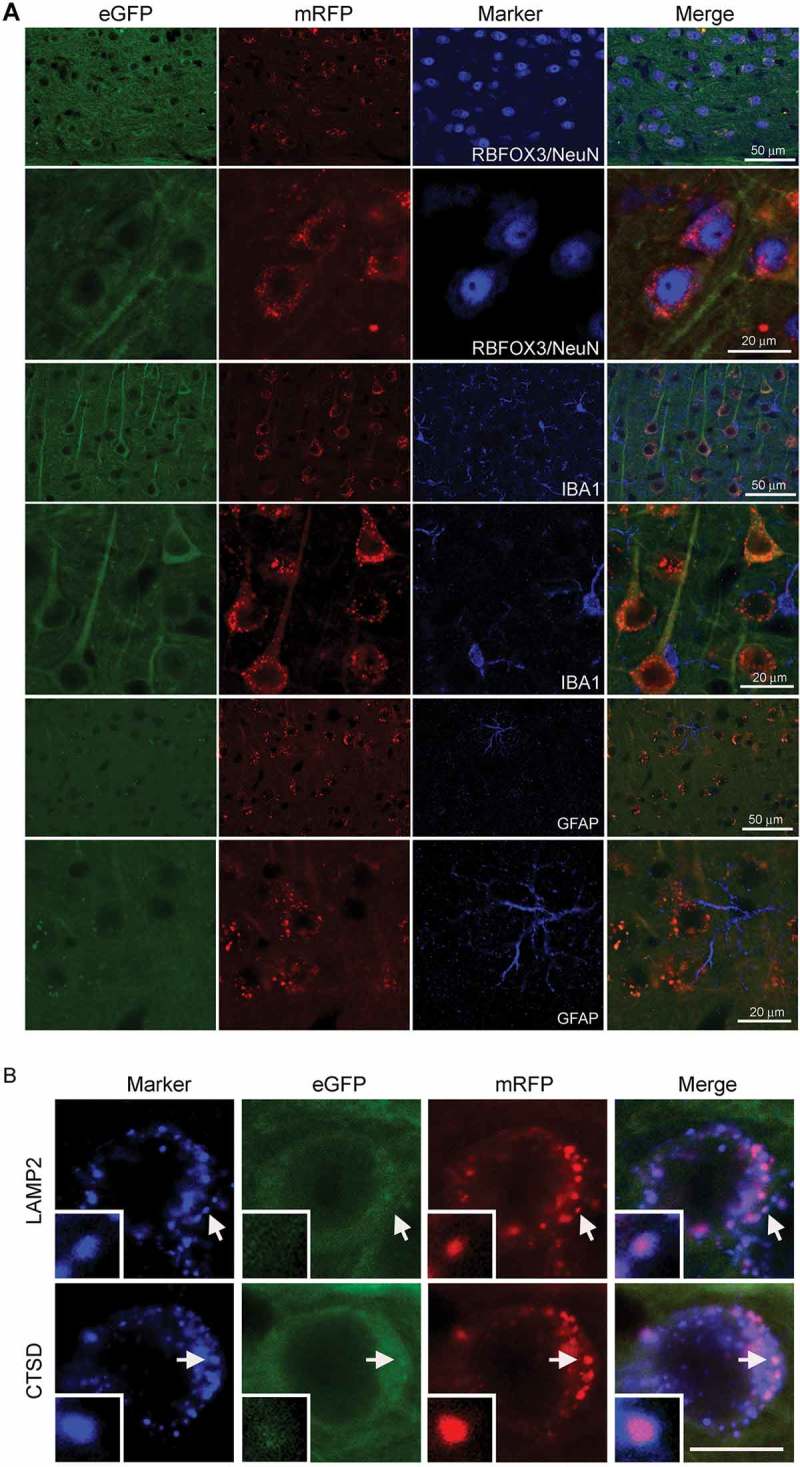
tfLC3 expression in the neurons of TRGL6 mouse. (A) Confocal images show that tfLC3 expression is restricted to RBFOX3/NeuN-positive neocortical neurons and absent in GFAP- or IBA1-positive glial cells. Scale bar: 20 μm. (B) Colabeling with a lysosomal marker (LAMP2 or CTSD) (blue), indicates that all red (mRFP)-positive compartments are also lysosomal marker positive and yield purple (red: mRFP + blue: LAMP2 or CTSD) signals in the neocortical neurons of 6-month-old TRGL6 mice. Lysosomes not engaged in autophagy (tfLC3 negative) remain blue. Inset: enlarged image of area indicated by an arrow. Scale bar: 20 μm.
Autophagy modulation in cultured TRGL6 mice neurons: unique detection of autolysosomal acidification failure
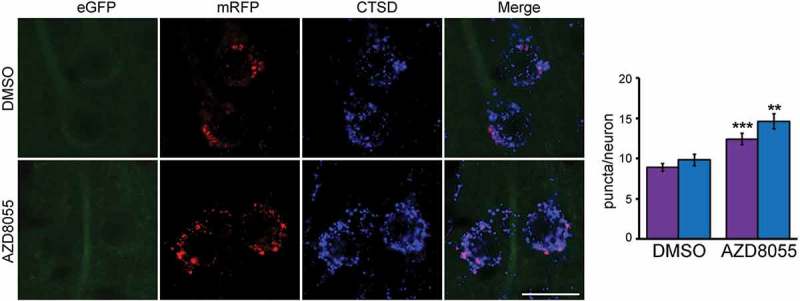
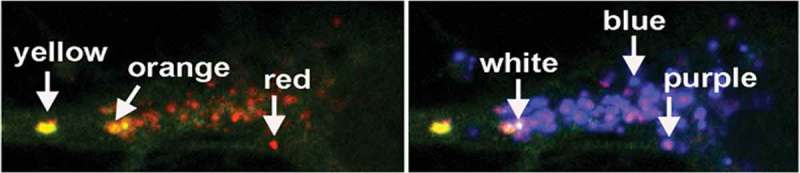
Introduction of the third fluorescence probe for CTSD enabled further discrimination of AL subtypes based on their acidification state established using an unbiased measurement of hue angle to assign the color of vesicles (Figure 4A and B). Although, ALs progress from orange to red after fusion with LYs has taken place, orange-colored vesicles are extremely rare in perikarya of TRGL6 mice due to the very efficient acidification of ALs in healthy neurons [8]. For this validation, we cultured TRGL6 mice neurons and pharmacologically modulated autophagy. As in vivo, the perikarya of unperturbed primary neurons 7 d in culture (DIV7) exhibited predominantly acidified ALs (red puncta). Additional immunofluorescence labeling of these neurons with CTSD antibody (blue) revealed that most CTSD puncta were LYs and that a minority of CTSD puncta still had undigested tfLC3 and were therefore AL (Figure 4C. top row and respective quantification). As predicted, autophagy induction with the pan-MTOR inhibitor AZD8055 (100 nM, 24 h) increased autophagy flux, yielding elevated numbers of acidified ALs (purple) (Figure 4C, middle row and respective quantification). Additionally, the number of lysosomes also increased in AZD8055-treated neurons, consistent with observations that MTOR inhibition upregulates lysosomal biogenesis [24–26]. In contrast to AZD8055 treatment, inhibiting autophagic flux by blocking lysosomal acidification with chloroquine (CQ; 100 μM, 3 h) greatly increased numbers of poorly acidified ALs, which appeared as white puncta (Figure 4C, bottom row and respective quantification).
Figure 4.
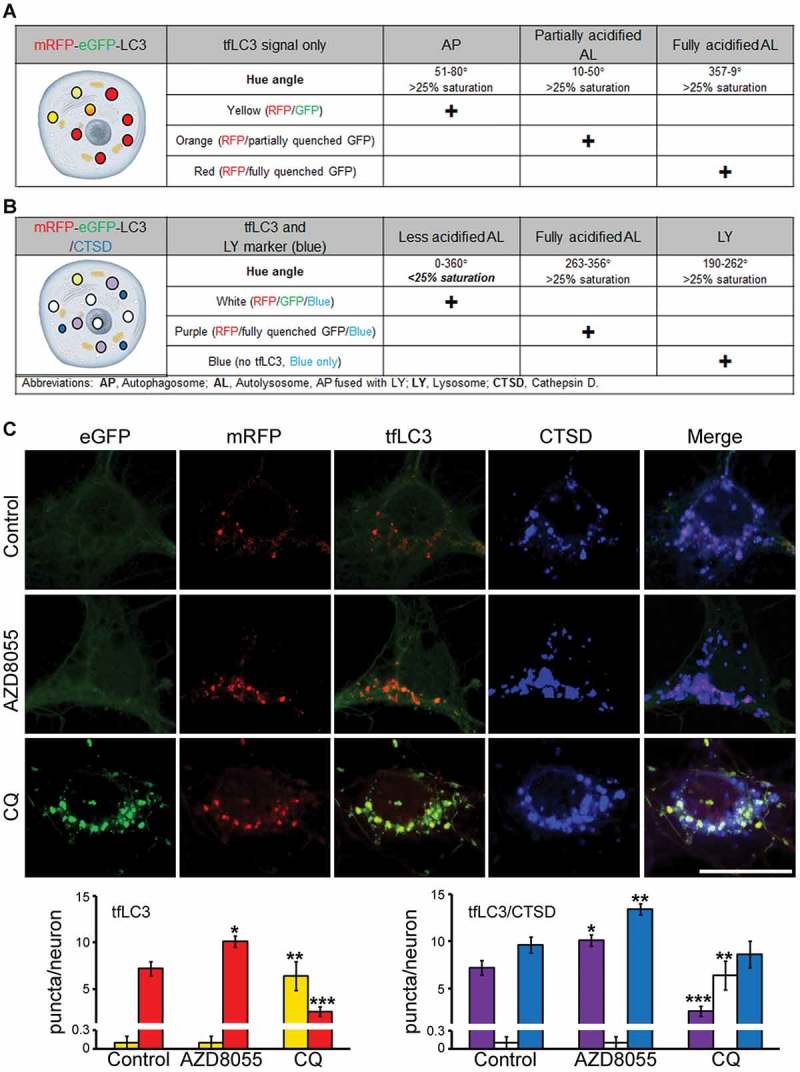
Dynamics of tfLC3 color change after pharmacological autophagy modulation in TRGL6 mouse neuronal cultures. (A) Expected outcomes of changes in fluorescence signals from TRGL6 mouse neurons. Without LY marker colabeling, red (mRFP only) identifies ALs that are normally acidified after AP-LY fusion and have not completely digested substrates. Yellow (hue°: 51–80) puncta indicate APs, orange (hue°: 10–50) puncta indicate poorly acidified ALs (i.e., immature (incompletely acidified) ALs or ALs that are pathologically deficient in acidification), and red (hue°: 357–9) puncta indicate fully acidified ALs. (B) Yellow or orange puncta can be further differentiated by ICC colabeling with a lysosomal marker (CTSD). Purple puncta (hue°: 263–356) are acidified ALs, white puncta (< 25% saturation) are ALs but are poorly acidified (eGFP not quenched), and blue puncta (hue°: 190–262) are LYs. (C) Representative fluorescence image of tfLC3 color changes, and respective quantification of puncta in perikarya, in DIV7 cortical neurons of TRGL6 mouse under ALP-modulated conditions. Scale bar: 20 μm. For data analysis, color change of tfLC3-positive vesicles was calculated without (left panel) or with (right panel) CTSD colabeling. Bar colors denote the colors of puncta; yellow bars indicate tfLC3, red bars indicate eGFP fluorescence quenched tfLC3, white bars indicate tfLC3 with CTSD (unacidified ALs, unquenched eGFP), purple bars indicate tfLC3 with CTSD (fully acidified ALs, quenched eGFP), blue bars indicate CTSD only (blue: nascent LY). For data analysis, average numbers of vesicles were calculated: Ctrl: Yellow, 0.1 ± 0.1; red, 7.2 ± 0. 8; purple, 7.2 ± 0.8; white, 0.1 ± 0.1; blue, 9.6 ± 0.8. AZD8055: Yellow, 0.1 ± 0.1; red: 10.1 ± 0.6; purple: 10.1 ± 0.6; white, 0.1 ± 0.1; blue, 13.4 ± 0.6. CQ: Yellow, 6.4 ± 1.5; red, 2.6 ± 0.5; purple, 2.6 ± 0.5; white, 6.4 ± 01.5; blue, 8.6 ± 1.4). n = 20; * P < 0.01, ** P < 0.001, *** P < 0.0001. Paired t-test, two-tailed P value as indicated.
In axons, AZD8055 induced the appearance of large APs, which is consistent with the expected induction of AP formation within axons [27]. The pattern also highlights the point that, due to the paucity of lysosomes in axons, APs remain relatively immature during their retrograde journey until they approach the perikaryon, where lysosomes become more numerous [17] (Figure 5, yellow arrowheads). In neurons treated with CQ compared with untreated neurons, large poorly acidified AL were more numerous especially near the cell body, reflecting continued AP-LY fusion but ineffective AL acidification. AP numbers also increased due in part to their impaired retrograde AV transport [17] and possibly to some degree of pH-related impairment of AP-LY fusion [28] (Figure 5).
Figure 5.
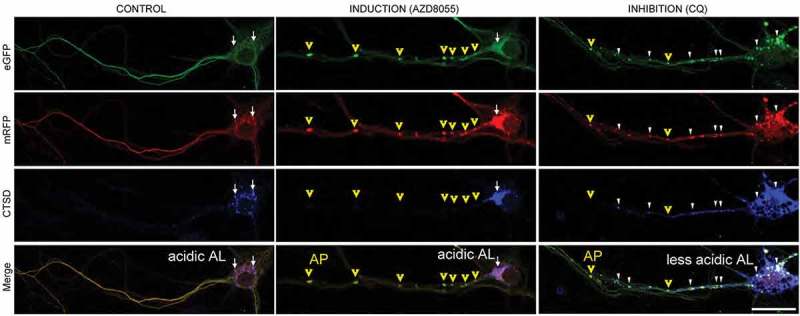
Fluorescence changes of tfLC3 in primary cortical neurons from TRGL6 mice under ALP-modulated conditions. Comparison of tfLC3 fluorescent changes under different ALP-modulated conditions in TRGL6 mouse neurons at DIV7, as also described in Figure 2. In control neurons, both AP and AL are rare in axonal areas. Only small numbers of acidic AL (white arrows; purple puncta, CTSD positive) were seen in perikarya. Autophagy induction by pan-MTOR inhibitor (AZD8055) increased formation of both large APs and acidic ALs compared to patterns in control neurons. Newly formed APs (yellow arrowheads; yellow puncta, CTSD negative) were seen in axonal areas, whereas fully acidified ALs (white arrow; purple puncta, CTSD positive) were predominantly located near or in the perikaryon. By contrast, lysosomal alkalinization by chloroquine (CQ) increases less acidic ALs (white arrowheads; white puncta, CTSD positive) in both the axon and perikaryon, and APs are also increased in number. Under lysosomal neutralization conditions, acidic ALs become less abundant in the perikaryon. Scale bar: 20 μm.
Collectively, these data show that our tfLC3 reporter, with the assistance of a far-red fluorescent LY marker, is able to discriminate AP, AL, and LY populations within individual neurons and their processes, and to detect alterations in the progression of autophagic flux, including the unique detection of impaired AL acidification.
Pharmacological modulation of neuronal autophagy in vivo: responses to an inhibition of cathepsins or of lysosomal acidification
Following a similar approach to neuronal culture conditions, we validated the sensitivity of tfLC3 for detecting autophagic flux alterations in vivo in the mouse brain. To activate autophagy induction, TRGL6 mice (6-months-old) were administered the pan-MTOR inhibitor AZD8055 (50 mg/kg/day) via intra-cerebroventricular (ICV) infusion for 5 d. Consistent with our in vitro results (Figure 4), the red-only (mRFP, quenched-eGFP) fluorescent AL compartments substantially increased in neuronal perikarya and strongly colabeled with a lysosome marker (CTSD with blue), indicating that they were fully acidified ALs (Figure 6 and respective quantification). As noted in the in vitro study, there was also an increase in lysosomal number (Figure 6, blue bar). These results indicate that in vivo induction of autophagy in TRGL6 mouse brain causes APs to fuse rapidly with lysosomes resulting in a rise in the number of CTSD-positive, fully acidified ALs.
Figure 6.
tfLC3 color change in vivo in the brain under autophagy induction. Representative fluorescence images of tfLC3 color change in neurons from pan-MTOR inhibitor AZD8055-infused TRGL6 mouse brain. Activation of autophagy induction by AZD8055 increases the number of red and blue puncta in perikarya. Scale bar: 20 μm. Quantitative data analysis shows that eGFP quenched tfLC3, acidified AL, and lysosome signals are increased in AZD8055 infused (5 d) TRGL6 mouse neurons compared to vehicle-only control. For data analysis, numbers of vesicles were calculated: (AL [purple]: DMSO, 8.9 ± 0.5; AZD8055, 12.4 ± 0.7. LY [blue]: DMSO, 9.9 ± 0.7; AZD8055, 14.6 ± 0.9). Error bars indicate ± SEM. n = 80, ** P < 0.001, *** P < 0.0001. Paired t-test, two-tailed P value as indicated.
We next validated the sensitivity of tfLC3 in detecting autophagic flux alterations in vivo in the mouse brain under lysosomal stress/dysfunction conditions. To mimic a pathological lysosomal state, TRGL6 mice (4-months-old) were administered the cysteine protease inhibitor leupeptin (Leup, 4 mg/kg/day) via ICV infusion for 7 d to impede lysosomal proteolysis. As expected from earlier studies [8], the numbers of yellow puncta increased, whereas red puncta declined in neuronal perikarya of Leup-treated mouse neurons (Figure 7A). Surprisingly, most of these yellow compartments strongly colabeled with CTSD antibody, indicating that they were poorly acidified ALs rather than APs (Figure 7B, and higher mag. insert). These results thus demonstrate the sensitive detection of lysosomal dysfunction by tfLC3 and show that inhibiting cysteine proteases in lysosomes not only blocks proteolysis by this class of proteases but also elevates lumenal pH, possibly via the build-up of neutral substrates, which in turn, inhibits activities of a broader range of acid hydrolases [29,30].
Figure 7.
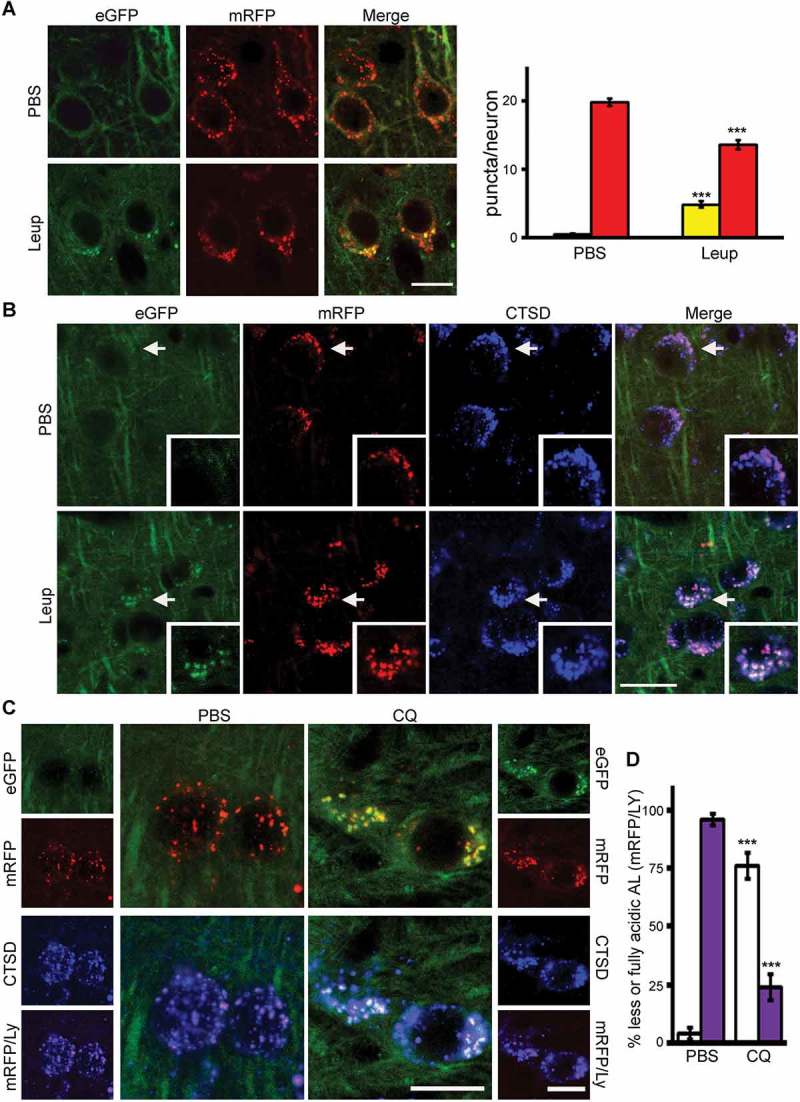
tfLC3 color change in vivo in the brain under lysosomal proteolysis inhibition. Representative fluorescence images of tfLC3 color change in neurons of TRGL6 mouse brain. (A) Inhibition of lysosomal proteolysis by leupeptin (Leup) increases the number of yellow puncta in perikarya. Quantitative data analysis shows that yellow signals are increased, and red signals are decreased in Leup-infused (7 d) TRGL6 mouse neurons. Scale bar: 20 μm. Bar colors denote the colors of puncta. n = 28, *** P < 0.0001. Paired t-test, two-tailed P value as indicated. (B) Colabeled with CTSD, tfLC3-positive compartments produce white signal after Leup infusion for 7 d, whereas AV puncta are purple in PBS-treated neurons of littermate controls. Inset: enlarged image of areas marked by arrows. Scale bar: 20 μm. (C) Representative fluorescence images of tfLC3 color change in neurons from chloroquine (CQ)-infused TRGL6 mouse brain. Scale bar: 20 μm. (D) Quantification of puncta presented in panel (C). For data analysis, the percent of incompletely acidified (white) and fully acidified (purple) AL were calculated (PBS: white, 4.46 ± 2.42; purple, 95.54 ± 2.42. CQ: white, 76.05 ± 5.58; purple, 23.95 ± 5.58). Error bars indicate ± SEM. n = PBS:93, CQ:95. *** P < 0.0001. Paired t-test, two-tailed P value as indicated.
To further validate the detection of less acidified ALs with tfLC3 in vivo, we elevated lysosomal pH by treating young adult (6-months-old) TRGL6 mice with CQ (5 mg/kg/day) by ICV infusion for 5 d. As seen earlier in vitro (Figure 4C), neuronal perikarya in brains of CQ-treated mice contained increased number of AVs nearly all of which were yellow but were also labeled strongly with CTSD antibody indicating that they were poorly acidified ALs rather than APs (Figure 7C).
Because tfLC3 allows for a ratiometric readout, we performed quantitative analysis on individual vesicles in single neurons using a hue angle-based color-coding procedure after incorporating a third fluorescence labeling of LY (blue) by CTSD immunohistochemistry (Figure 7D). Quenching of mRFP is negligible because it occurs only at an extreme pH range [11]. Therefore, ALs fluorescing in the purple to white range reflect progressive eGFP quenching by protonation due to an acidic environment. As predicted, acidified ALs were predominant in PBS-vehicle treated single neurons, with a low number of poorly acidified ALs (4.46 ± 2.42%), whereas CQ treatment increased the percentage of poorly acidified ALs (76.05 ± 5.58 %, p < 0.0001) (Figure 7D, graph). Vesicle alkalinization by CQ was evidenced by clearly increased proportions of poorly acidified ALs as compared to neurons in the PBS control mice. However, in contrast to the CQ-treated cortical neuron population in vitro, a given neuron within different neuronal populations in vivo displayed tfLC3-positive vesicles of varying color and extents of acidification in response to CQ treatment. Collectively, the Leup and CQ results validate the utility of TRGL6 mice to monitor changes in autophagic flux in vivo, while additionally and uniquely, to detect deficient autolysosomal/lysosomal acidification in neurons in vivo.
Discussion
Given the rapidly emerging pathogenic roles that disrupted ALP function plays in neurodegenerative diseases, there is an urgent need for research tools that enable impairment at different stages along the ALP pathway to be characterized in specific affected neuronal populations of the intact brain throughout the aging process. Equally important, the application of this probe provides a capability, needed and not currently available, to establish target engagement of administered drugs and putative autophagy modulators in brain in vivo as well as to evaluate their efficacy in therapeutically modulating ALP dysfunction in disease models. Promising targets for disease therapeutics are being identified along the ALP; however, preclinical evaluation of these ALP targets has been hampered by confounding factors such as brain cell heterogeneity and the dynamic nature of ALP, which requires the simultaneous assessment of multiple steps along the pathway (i.e., AP formation, maturation, and clearance) to evaluate autophagy flux reliably. Although numbers of LC3-positive puncta can be quantified at a single-cell level by conventional immunofluorescence methods, this steady state estimate of LC3-positive vesicles does not describe the turnover rate of this autophagy substrate (i.e., flux).
Expression of a tandem fluorescent mRFP- or mCherry-GFP-tagged LC3 construct has overcome certain barriers to autophagy flux assessment in intact cells and is widely used in analyses of in vitro systems [7,10,14,27,31,32]. In addition, the Mizushima group recently developed a GFP-LC3-RFP-LC3ΔG probe for autophagy flux analysis. Upon autophagy induction, this fusion protein is cleaved into GFP-LC3 and RFP-LC3ΔG. GFP-LC3 is degraded or quenched after fusion with lysosomes in stably transfected mouse embryonic fibroblasts, whereas RFP-LC3ΔG remains in the cytosol. The eGFP:mRFP ratio can be used as an index of autophagy flux; however, the sensitivity of this assay is not high enough to investigate certain steps of autophagy (e.g., AV formation, AL acidification). Moreover, the expression levels of GFP-LC3-RFP-LC3ΔG were sufficient only in the skeletal muscle of a mouse model injected with probe mRNA, indicating that the ability to monitor ALP dynamics in brain in vivo is limited by this method [33,34]. Another approach involving the delivery of an adeno-associated virus-mediated mCherry-GFP-LC3 reporter by ICV injection in newborn animals was recently described [13]. Although the reporter gene was strongly expressed in the CNS, the regional distribution and degree of transgene expression is heterogeneous and is difficult to compare quantitatively in neuron populations within the same or different mice [13].
Our data strongly validate the TRGL6 transgenic mouse as the first model that achieves stable expression of the tfLC3 probe in brain and is capable of reporting on the major events of autophagy pathway flux in different neuronal populations in vivo. We also showed that TRGL6 mice have important advantages over conventional immunofluorescence staining of LC3 and single-fluorescence tagging of LC3 in both in vitro and in vivo ALP dynamic studies in terms of detection sensitivity, neuronal specificity, and ability to evaluate autophagy flux rather than just steady-state numbers of LC3 puncta. Importantly, the Thy1 promoter used to drive expression of tfLC3 enables broad, highly reproducible, expression of the transgene specifically in neurons – an advantage not only for selectively monitoring autophagy in neurons but also for eliminating confounding influences of a strong ‘background’ fluorescence signal from glial cells, which is generated when a promoter that is not cell selective is used. The predominantly postnatal onset of Thy1-driven transgene expression reduces the possibility of untoward developmental effects of a tfLC3 construct.
A possible caveat of overexpressed LC3 is the potential to stimulate autophagy, reflecting, at least partly, the well-established property of strong protein overexpression to act as a general stress stimulus and inducer of autophagy. Potentially this effect could influence or even abrogate an ALP defect that may exist in a neurodegenerative disease mouse model. However, we were able to achieve strong fluorescence signals at a level of LC3 overexpression that was only 1-fold above endogenous LC3 levels, which avoided potential influences of high LC3 expression and, indeed, no adverse effects of this level of tfLC3 expression on basal autophagy, brain morphology, behavior, or longevity, were seen. Similar to our TRGL6 mice, another LC3 overexpression model (GFP-LC3 mice) expressing GFP-LC3 at levels comparable to endogenous LC3 also did not affect the endogenous autophagic process in the brain [35,36].
Notably, tfLC3 revealed that AP are rarely detected in axons and dendrites as well as perikarya of most types of neurons in adult mouse brain in vivo. This finding is similar to those in human brain where AVs are uncommon in processes of neocortical neurons in individuals without pathological evidence of AD [37], confirming the very efficient maturation of APs in neurons. By comparison, the higher rate of AP formation seen in growing (immature) neurons in in vitro culture conditions [38,39] may reflect the extensive structural remodeling ongoing during active process outgrowth and retraction. These developmental differences underscore the importance of having an available model enabling autophagy dynamics to be studied in intact adult and aging brain. Additionally, the somewhat distinctive patterns of AV maturation seen in different neuronal populations suggest that autophagic responses to the same disease insult or injury may differ and provide unique insight into the disease mechanism.
This TRGL6 mouse model is likely to have unique value in assessing changes along the ALP in specific neuronal populations under a variety of physiological and disease conditions, as strongly supported by our emerging studies in AD models [40]. Equally important, the application of this probe enables an opportunity, urgently needed and not currently available, to reliably establish target engagement of administered drugs and putative autophagy modulators in brain in vivo as well as to evaluate their efficacy as therapeutic modulators of ALP dysfunction in disease models. TRGL6 mice can detect alterations of autophagy flux ranging from impaired AP retrograde transport and AP-LY fusion to failure of AL maturation and LY function. We documented strong parallels between in vivo and in vitro responses to pharmacological perturbations of autophagy flux in neurons expressing tfLC3. In most autophagy-related studies, it is necessary to distinguish whether AV accumulation is due to autophagy induction (AP formation) or alternatively to a block or slow-down in AV maturation and clearance.
To assign color and AV identity in an unbiased quantitative manner, we defined color of tfLC3 vesicles based on an objective determination of hue angle (color appearance parameter, range 0–360°, https://en.wikipedia.org/wiki/Hue). Hue objectively represents the color tone expressed as an angular value and has been previously used to monitor the color changes in a pH-sensitive sensor [41]. Perception of color among different individuals, however, is variable especially when viewed on computer monitors of varying quality. Combining hue angle-based color coding with immunofluorescence labeling (i.e., CTSD for LY) of tfLC3-expressing brains enabled us to distinguish, for the first time in vivo, normally acidified ALs from less/poorly acidified ALs, and thus identify a deficit in efficient acidification after fusion with lysosomes. This premise is based on our previous findings in neurons [8,17] that AL acidification is rapid after fusion with lysosomes and that the proportion of ALs in perikarya of healthy neurons that are incompletely acidified are very low. Given the emerging appreciation of deficient vesicle acidification as a basis for neurodegeneration in various neurological diseases [3,42], the ability to identify AL with altered/impaired acidification in neuronal populations in mouse models of neurological disease will contribute to a clearer signature of lysosomal dysfunction for better understanding of disease progression. Beyond the level of discrimination of acidity demonstrated in this report, the potential exists to use the ratiometric capability of the mRFP-eGFP-LC3 (tfLC3) biosensor to parse finer hue angle gradations of ALs that correlate with graded pH changes measured directly as reported in cell systems in vitro [11].
In summary, our new TRGL6 mice can clearly visualize altered ALP dynamics and AL acidification status in vivo in single neurons when ALP is altered pharmacologically. ALP abnormalities have been implicated in major neurodegenerative diseases, including AD [43,44], PD [45,46], and frontotemporal dementia [47]. In many familial forms of these diseases, the causative gene encodes a protein that regulates or supports ALP function [3,48]. Autolysosomal dysfunction and substrate accumulation are especially prominent in AD pathogenesis and APP, PSENs/presenilins, and APOE/ApoE4 have substantial proximal effects on the ALP [49] that both promote amyloidosis and global impairment of cellular clearance of damaged and toxic proteins. Consistent with this growing evidence, TRGL6 mice should also be sensitive to ALP changes described in animal models of many neurodegenerative diseases across the entire age spectrum and will be an invaluable tool to assess the action and efficacy of autophagy-lysosome modulators as therapeutic agents in these diseases.
Methods
Mouse lines and animal care
The TRGL6 (Thy1 mRFP eGFP LC3-line 6) mice generation, targeting vector for tfLC3 was constructed by insertion of tfLC3 into a Thy1 expression cassette [16]. After testing the construct in N2a cells to drive the expression of mRFP-eGFP-LC3 specifically in neurons, we released the transgene fragment by digestion with NotI and PvuI enzymes to cut off the vector sequences. The transgene fragment was gel purified using the QIAEX II Gel Extraction kit (QIAGEN, 20,021). After purification, the Thy1-mRFP-eGFP-Lc3 fragment was microinjected into fertilized C57BL/6xCBA mouse embryos in 3 pseudo-pregnant mothers (#945, 946 and 947) to produce transgenic mice at the Washington University in St. Louis Transgenic facility. Genotyping of mice by PCR was performed using the following primers: forward primer in the Thy1 promoter (5ʹ-CTT TCC CCA CCA CAG AAT CCA AGT CGG AAC-3ʹ) and a reverse primer in the C-terminal region of mRFP (5ʹ-GCA CGA ATT CGG GCG CCG GTG GAG TGG CGG-3ʹ) to generate a transgene-specific 750-base pair PCR product. We obtained a total of 9 founders for the Thy1-mRFP-eGFP-Lc3 transgene and bred these founders at 2-months of age with C57BL/6J mice to establish stable lines. The M6 line that had the best expression of mRFP-eGFP-LC3 in neurons were maintained in a C57BL background, hereafter termed TRGL6 (Thy1 mRFP-eGFP-LC3, Line 6) mice. TRGL6 mice were bred with C57BL/6 and maintained. For TRGL6 mouse studies, at least 3 pairs of WT and TRGL6 littermates at each age group (3 and 6 months) were used for western blot and/or immunofluorescence studies. For preparing neuronal cultures, 3 TRGL6 embryonic mice (sex: random) were used in 3 independent experiments. For in vivo autophagy modulation, 3 pairs of vehicle-only treated mice or autophagy modulator (leupeptin [Peptide Institute Inc, 4041] or chloroquine [Sigma, C6618]/AZD8055 [Selleckchem, S1555])-treated male TRGL6 mice, 4- and 6-months-old respectively, were used. The mice were maintained in the Nathan Kline Institute (NKI) animal facility and housed in a 12-h light/dark cycle. All animal experiments were performed according to ‘Principles of Animal Care’ [50] and approved by the Institutional Animal Care and Use Committee at the NKI.
Primary neuron cultures
Primary cortical neuronal cultures were derived from E17-stage TRGL6 mouse pups and cultured on poly-D-lysine (100 mg/ml; Sigma, P7886)-coated plates with Neurobasal (Thermo Fisher Scientific, 21,103–049) medium containing B27 (Thermo Fisher Scientific,17,504,044), 0.5 mM GlutaMax (Thermo Fisher Scientific, 35,050,061) and 50 units/ml of penicillin-streptomycin (Thermo Fisher Scientific, 15,140,122). Neurons were fed every 3 d by aspirating half the medium and replacing it with the same amount of neuronal feeding medium.
Reagents and antibodies
The tfLC3 (mRFP-eGFP-LC3 rat) construct was provided by Dr. Tamotsu Yoshimori (Osaka University, Japan). The following antibodies were used: Anti-LC3 rabbit polyclonal antibody (pAb) (Novus Biologicals, 100–2220; 1:1000). Guinea-pig anti-SQSTM1/p62 (Progen Biotechnik GmbH, p62-C; 1:1000). Anti-GFAP antibody (Sigma, G9269; 1:200). Anti-RFP rabbit pAb (Abcam, ab62341; 1:1000). Anti-IBA1 antibody (Wako, 019–19,741; 1:200). Rabbit anti-CTSD/cathepsin D pAb (1:5000) [51] was generated in house. Anti-murine LAMP2 (ABL93, 1:100) monoclonal antibody and LAMP1 (1D4B, 1:200 WB) were purchased from the Developmental Studies Hybridoma Bank. Rabbit anti-GABARAPL2/GATE16 (ABC24, 1:1000) and RBFOX3/NeuN (MAB377, 1:250) were from EMD Millipore. Anti-GFP rabbit pAb (2956, 1:1000), anti-ATG5 (12,994, 1:1000), anti-ATG7 (8558, 1:1000), anti-GABARAP (13,733, 1:1000), anti-phospho-RPS6KB (9205, 1:1000), and anti-RPS6KB (2708, 1:1000) were from Cell Signaling Technology. HRP-linked rabbit IgG (711–035-152, 1:5000), mouse IgG (711–035-150, 1:5000), rat IgG (712–035-150), and guinea pig IgG (706–035-148) secondary antibody were from Jackson ImmunoResearch. AZD8055 (Selleckchem, S1555). Chloroquine (Sigma, C6618). Leupeptin (Peptide Institute Inc, 4041). Prolong Diamond Antifade Mount (P36961), goat anti-mouse Alexa Fluor 647 conjugated secondary antibody (A21235), goat anti-rat Alexa Fluor 647 conjugated secondary antibody (A21247), and goat anti-rabbit (A21245) Alexa Fluor 647 secondary antibodies were from Thermo Fisher Scientific. Mouse on Mouse (M.O.M) detection kit (BMK-2201) and normal-goat (S-100) serum blocking solution were from Vector Lab.
Gel electrophoresis and immunoblotting
Cells used for western blot analysis were lysed in buffer containing 50 mM Tris, pH 7.4, 150 mM NaCl, 1 mM EDTA (Sigma, E5791), 1 mM EGTA (Sigma, E3889), 1% Triton X-100 (Sigma, T9284), 0.5% Tween-20 (Sigma, P9416) with protease (Roche Diagnostics, 10,276,200) and phosphatase (Roche Diagnostics, 04906837001) inhibitors. Samples were mixed with 2x SDS sample buffer and incubated 5 min at 100°C. Following electrophoresis on 4 −20% gradient Tris-glycine gel (Thermo Fisher Scientific, WT4202BOX), proteins were transferred onto 0.45-µm PVDF membranes (Millipore, IPVH00010) and the membrane was incubated overnight in primary antibody then incubated with HRP-conjugated secondary antibody. The blot was developed using an ECL-kit (Invitrogen, WP20005).
In vitro ALP modulations
DIV7 neurons were treated with AZD8055 (final 100 nM, 24 h) or chloroquine (CQ, final 120 μM, 3 h; Sigma, C6618). Neurons were fixed for image analyses by removing culture medium, washing (3 times) in cold TBS, and adding 4% paraformaldehyde-5% sucrose (Electron Microscopy Science, 15,714) in TBS (50 mM Tris-Cl, 150 mM NaCl, pH 7.5), pH 7.4 for 15 min at 25°C. Samples were mounted onto microscope slides with Prolong Diamond Antifade Mount (Thermo Fisher Scientific, P36961) and visualized using a Zeiss confocal microscope.
In vivo ALP modulations
For in vivo modulations of the ALP, TRGL6 mice received intracerebroventricular infusion of either AZD8055 (21 mg/ml in vehicle solution: 4% DMSO [Sigma, D2650], 30% PEG-400 [Sigma, 91,893] in PBS [Thermo Fisher Scientific, 10,010,023]) or leupeptin (10 mg/ml in HEPES) or chloroquine (12.5 mg/ml in PBS) loaded in an Alzet minipump 1007D (delivery rate 0.5 µl/h, total 12 µl/day). The mice were anaesthetized with an intraperitoneal injection of a mixture of ketamine-xylazine (150 and 10 mg/kg respectively, 26 g needle, volume: 1% body weight, i.e., 300 µl/30 g BW). The implantation of the minipump was performed following a procedure described previously [52] with the following coordinates for the cannula placement in the lateral ventricle: AP – 0.3 mm to bregma, ML 1.0 mm to bregma, and DV 2.5 mm to cranium. Mice were infused with AZD8055 (50 mg/kg/day) for 5 d, leupeptin for 7 d (4 mg/kg/day) or chloroquine for 5 d (5 mg/kg/day).
Fluorescence imaging
Immunohistochemistry was performed as previously described [51]. Animals were anesthetized and intracardially perfused with Perfusion Wash Super Reagent (Electron Microscopy Sciences, 1222SK) followed by Perfusion Fixative Super Reagent (Electron Microscopy Sciences, 1223SK). Brains were dissected and immersed in the same fixative for 24 h and then 40-µm sagittal sections were made using a vibratome. Immediately after sectioning, sections were immunolabeled with the indicated antibodies overnight and then visualized with Alexa Fluor conjugated secondary antibodies. Imaging was performed using a plan-Apochromat 20x or 40x/1.4 oil objective lens on a LSM880 laser scanning confocal microscope with the following setups: eGFP (ex: 488, em: 490–560 with MBS 488), mRFP (ex: 561, em: 582–640 with MBS 458/561), and Alexafluor 647 (ex: 633, em: 640–710 with MBS 488/561/633) with separate scanning tracks for each excitation and emission set, ‘best signal scanning mode’, to exclude crosstalk between each fluorophore signal. The resolution of 40x confocal images was 1024 × 1024 pixels (corresponding to an area of 212.34 × 212.34 μm2), recorded with an 8-bit pixel depth with a zoom value of one, and the resolution of 3x zoomed images was also 1024 × 1024 pixels (corresponding to an area of 70.78 × 70.78 μm2). As a preliminary image scan, we used the ‘continuous scanning mode’ with scan speed 10 to find the area of interest, adjust focusing, and optimize the gain setting of image acquisition as described below. Once parameter settings were finalized, each image was collected using the ‘frame scanning mode’ with the final image corresponding to an average of 4 line-scans with scan speed 6. In their monomeric state, eGFP is brighter than mRFP. When mRFP accumulates in vesicular structures, however, it becomes multimeric and produces much brighter signal than in its monomeric state, therefore yielding vesicle signal intensities that are higher than the ‘background’ of cytosolic mRFP monomer. This is not the case for eGFP. For this reason, gain is adjusted separately for each fluorophore and may be adjusted differently for optimal appreciation of AVs in soma versus the cell processes.
Gain settings were based on vesicular tfLC3 in the soma and remain constant across neuronal populations in a given mouse brain. These standard gain settings were also applied to the axon and dendrite areas, unless otherwise described. For quantification, gain settings were optimized by taking the average gain of 10 cells for each channel where signal is maximized below saturation and the offset does not undersaturate based on the ‘gain/offset histogram’ tool in Zen Black such that the mRFP signal in the perikaryon would show unsaturated separated puncta, and the intensity of eGFP fluorescence was then set to highlight any puncta (LC3-II) and reduce diffuse LC3-I. Under these conditions, most of the tfLC3 fluorescence in neuronal processes appeared as diffuse yellow, instead of the pure yellow color that would be expected from unquenched colocalization. In a few images, we slightly increased the eGFP signal to visualize the confines of the neuron, which is noted in the figure legend. CTSD gains and offset were set in the same way as applicable. Each image is representative of at least 3 animals.
Vesicle quantification
High resolution images were acquired on a Zeiss LSM880 confocal microscope with Airway scanning using a Plan-Apochromat 40x/1.4 oil DIC M27 objective. LC3 and CTSD puncta were analyzed with the Zen Blue Image Analysis Module from Carl Zeiss Microscopy. Thresholds were set by taking the average intensity value based on 10 neuronal perikarya for each of the 3 color channels (RGB; red, green, blue). The signal was segmented into discrete puncta by using the automatic watershed function to separate clumped vesicles into individual puncta. Background signal was eliminated using the size exclusion function of the Zen Blue software. The R, G and B intensity values of each vesicle were calculated using the profile function of Zen. Using a published online formula (https://www. mrexcel.com/forum/excel-questions/559852-rgb-hue-formula.html) optimized for Excel, the RGB ratio of each vesicle was converted into a hue angle and saturation range by entering the values of R, G, and B for a given puncta into the formula, as follows: Hue° = IF(180/PI()*ATAN2(2*R-G-B,SQRT(3)*(G-B))< 0,180/PI()*ATAN2(2*R-G-B,SQRT(3) *(G-B)) + 360,180/PI()*ATAN2(2*R-G-B,SQRT(3)*(G-B))). Saturation percent of the hue angle was calculated by entering the values of R, G, and B for a given puncta into the following formula = (MAX(RGB)-MIN(RGB))/SUM(MAX(RGB)+ MIN(RGB))*100 (www.workwithcolor.com), provided diagram A and B lightness is less than 1, which is the usual case for our data. Hue angle was converted to color using the Hue color wheel (shown in the diagram as a linearized version of the scale from the color wheel).
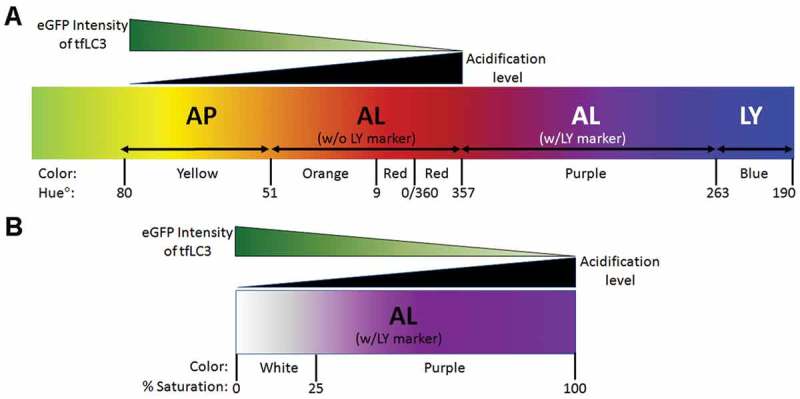
Hue is the attribute of a color discerned as red, green, blue, which is dependent on its dominant wavelength and independent of intensity (www.workwithcolor.com). Hue angles are normally represented as an angle on a circle, but here we linearized the scale to reflect the maturation process from AP to LY as detected by mRFP-eGFP-LC3 in the green-red portion of the spectrum (diagram A). A range of hue angles was assigned to each vesicle subtype of the ALP as well as to designate a relative acidity to different populations of AL. If the hue angle saturation is less than 25%, we considered the color to be unsaturated and therefore white (diagram B). In conjunction with CTSD labeling by in vivo or in vitro immunocytochemistry and visualized as blue fluorescence, we could then identify and count the numbers of each type of vesicle (i.e., AP, AL, or LY) as well as its relative acidification state, based on the parameters of hue and saturation derived from analysis of the full spectrum. See below examples of the application of this procedure for specific combinations of RGB values. The range of values of R, G, or B that specify the entire range for a given color is indicated in diagrams A and B as hue angles and saturation % numbered in the diagram.
| R | G | B | Hue° | Saturation % | Color | eGFP quenching | Saturation % |
|---|---|---|---|---|---|---|---|
| tfLC3 only | |||||||
| 75 | 74 | 6 | 59 | 85 | Yellow | no quenching | > 25% |
| 75 | 50 | 6 | 38 | 85 | Orange | partial quenching | > 25% |
| 75 | 7 | 6 | 1 | 85 | Red | full quenching | > 25% |
| tfLC3+ CTSD (blue) | |||||||
| 75 | 74 | 75 | 300 | 0.7 | White | no quenching | < 25% |
| 75 | 50 | 75 | 300 | 20 | White | partial quenching | < 25% |
| 75 | 7 | 75 | 300 | 83 | Purple | full quenching | > 25% |
| 7 | 7 | 75 | 240 | 83 | Blue | n/a | > 25% |
Quantification and statistical analysis
Statistical parameters including the definitions and value of sample size (n), deviations and p values are reported in the figures and corresponding figure legends. Statistical analyses using Prism 7 (Graphpad Software) were conducted on data originating from at least 3 independent experimental replicates. Statistical analyses between 2 groups were performed by a paired t-test. Data are expressed as mean ± SEM. Differences were considered significant with two-tailed p value as indicated p < 0.05.
Funding Statement
This work was supported by the National Institute on Aging [P01AG017617]; New York Community Trust [none];Litwin Foundation [none]; Takeda Pharmaceuticals U.S.A. [none].
Acknowledgments
This work was supported by NIH P01AG017617, Takeda Pharmaceutical Company Ltd., New York Community Trust, and Litwin Foundation, Inc to R.A.N.
Disclosure statement
No potential conflict of interest was reported by the authors.
References
- [1].Klionsky DJ, Abdalla FC, Abeliovich H, et al. Guidelines for the use and interpretation of assays for monitoring autophagy. Autophagy. 2012. April 1;8(4):445–544. PubMed PMID: 22966490; eng. [DOI] [PMC free article] [PubMed] [Google Scholar]
- [2].Nixon RA, Yang DS.. Autophagy and neuronal cell death in neurological disorders. Cold Spring Harb Perspect Biol. 2012;4(10):a008839 . PubMed PMID: 22983160; eng. [DOI] [PMC free article] [PubMed] [Google Scholar]
- [3].Nixon RA. The role of autophagy in neurodegenerative disease. Nat Med. 2013;19(8):983–997. [DOI] [PubMed] [Google Scholar]
- [4].Menzies FM, Fleming A, Rubinsztein DC. Compromised autophagy and neurodegenerative diseases. Nat Rev Neurosci. 2015;16(6):345–357. [DOI] [PubMed] [Google Scholar]
- [5].Cuervo AM. Autophagy: in sickness and in health. Trends Cell Biol. 2004. February;14(2):70–77. PubMed PMID: 15102438. [DOI] [PubMed] [Google Scholar]
- [6].Mizushima N, Yamamoto A, Matsui M, et al. In vivo analysis of autophagy in response to nutrient starvation using transgenic mice expressing a fluorescent autophagosome marker. Mol Biol Cell. 2004. March;15(3):1101–1111. PubMed PMID: 14699058. [DOI] [PMC free article] [PubMed] [Google Scholar]
- [7].Mizushima N, Kuma A. Autophagosomes in GFP-LC3 transgenic mice. Methods Mol Biol. 2008;445:119–124. [DOI] [PubMed] [Google Scholar]
- [8].Boland B, Kumar A, Lee S, et al. Autophagy induction and autophagosome clearance in neurons: relationship to autophagic pathology in Alzheimer’s disease. J Neurosci. 2008. July 2;28(27):6926–6937. . [DOI] [PMC free article] [PubMed] [Google Scholar]
- [9].Kabeya Y, Mizushima N, Ueno T, et al. LC3, a mammalian homologue of yeast Apg8p, is localized in autophagosome membranes after processing. Embo J. 2000. November 1;19(21):5720–5728. PubMed PMID: 11060023. [DOI] [PMC free article] [PubMed] [Google Scholar]
- [10].Kimura S, Noda T, Yoshimori T. Dissection of the autophagosome maturation process by a novel reporter protein, tandem fluorescent-tagged LC3. Autophagy. 2007. Sep-Oct;3(5):452–460. PubMed PMID: 17534139; eng. [DOI] [PubMed] [Google Scholar]
- [11].Maulucci G, Chiarpotto M, Papi M, et al. Quantitative analysis of autophagic flux by confocal pH-imaging of autophagic intermediates. Autophagy. 2015;11(10):1905–1916. [DOI] [PMC free article] [PubMed] [Google Scholar]
- [12].Mizushima N, Yoshimori T, Levine B. Methods in mammalian autophagy research. Cell. 2010;140(3):313–326. PubMed PMID: S0092-8674(10)00063-2. [DOI] [PMC free article] [PubMed] [Google Scholar]
- [13].Castillo K, Valenzuela V, Matus S, et al. Measurement of autophagy flux in the nervous system in vivo. Cell Death Dis. 2013;4:e917. [DOI] [PMC free article] [PubMed] [Google Scholar]
- [14].Li L, Wang ZV, Hill JA, et al. New autophagy reporter mice reveal dynamics of proximal tubular autophagy. J Am Soc Nephrol. 2014. February;25(2):305–315. PubMed PMID: 24179166; eng. [DOI] [PMC free article] [PubMed] [Google Scholar]
- [15].Schneider JL, Cuervo AM. Autophagy and human disease: emerging themes. Curr Opin Genet Dev. 2014;26:16–23. [DOI] [PMC free article] [PubMed] [Google Scholar]
- [16].Rao MV, Mohan PS, Peterhoff CM, et al. Marked calpastatin (CAST) depletion in Alzheimer’s disease accelerates cytoskeleton disruption and neurodegeneration: neuroprotection by CAST overexpression. J Neurosci. 2008. November 19;28(47):12241–12254. PubMed PMID: 19020018; eng. [DOI] [PMC free article] [PubMed] [Google Scholar]
- [17].Lee S, Sato Y, Nixon RA. Lysosomal proteolysis inhibition selectively disrupts axonal transport of degradative organelles and causes an Alzheimer’s-like axonal dystrophy. J Neurosci. 2011. May 25;31(21):7817–7830. . [DOI] [PMC free article] [PubMed] [Google Scholar]
- [18].Maday S, Wallace KE, Holzbaur ELF. Autophagosomes initiate distally and mature during transport toward the cell soma in primary neurons. J Cell Biol. 2012. February 13; 2012. doi: 10.1083/jcb.201106120. [DOI] [PMC free article] [PubMed] [Google Scholar]
- [19].Pankiv S, Alemu EA, Brech A, et al. FYCO1 is a Rab7 effector that binds to LC3 and PI3P to mediate microtubule plus end-directed vesicle transport. J Cell Biol. 2010. January 25;188(2):253–269. . [DOI] [PMC free article] [PubMed] [Google Scholar]
- [20].Mizushima N. Methods for monitoring autophagy. Int J Biochem Cell Biol. 2004. 2004/12;36(12):2491–2502. [DOI] [PubMed] [Google Scholar]
- [21].Le Grand JN, Bon K, Fraichard A, et al. Specific distribution of the autophagic protein GABARAPL1/GEC1 in the developing and adult mouse brain and identification of neuronal populations expressing GABARAPL1/GEC1. PLoS ONE. 2012;8(5):e63133. [DOI] [PMC free article] [PubMed] [Google Scholar]
- [22].Swart C, Khoza A, Khan K, et al. Investigating basal autophagic activity in brain regions associated with neurodegeneration using in vivo and ex vivo models. J Alzheimers Dis Parkinsonism. 2017;7(4):337. [Google Scholar]
- [23].Huotari J, Helenius A. Endosome maturation. Embo J. 2011;30(17):3481–3500. [DOI] [PMC free article] [PubMed] [Google Scholar]
- [24].Sardiello M, Palmieri M, di Ronza A, et al. A gene network regulating lysosomal biogenesis and function. Science. 2009. June 25;325(5939):473–477. . [DOI] [PubMed] [Google Scholar]
- [25].Settembre C, Zoncu R, Medina DL, et al. A lysosome-to-nucleus signalling mechanism senses and regulates the lysosome via mTOR and TFEB. Embo J. 2012;31(5):1095–1108. [DOI] [PMC free article] [PubMed] [Google Scholar]
- [26].Zhou J, Tan S-H, Nicolas V, et al. Activation of lysosomal function in the course of autophagy via mTORC1 suppression and autophagosome-lysosome fusion. Cell Res. 2013;23(4):508–523. [DOI] [PMC free article] [PubMed] [Google Scholar]
- [27].Fu MM, Nirschl JJ, Holzbaur ELF. LC3 binding to the scaffolding protein JIP1 regulates processive dynein-driven transport of autophagosomes. Dev Cell. 2014. June 9;29(5):577–590. . PubMed PMID: 24914561; eng. [DOI] [PMC free article] [PubMed] [Google Scholar]
- [28].Vakifahmetoglu-Norberg H, Xia H-G, Yuan J. Pharmacologic agents targeting autophagy. J Clin Invest. 2014;125(1):5–13. [DOI] [PMC free article] [PubMed] [Google Scholar]
- [29].Yang DS, Stavrides P, Mohan PS, et al. Reversal of autophagy dysfunction in the TgCRND8 mouse model of Alzheimer’s disease ameliorates amyloid pathologies and memory deficits. Brain. 2011. January;134(Pt 1):258–277. PubMed PMID: 21186265; eng. [DOI] [PMC free article] [PubMed] [Google Scholar]
- [30].Yang DS, Stavrides P, Saito M, et al. Defective macroautophagic turnover of brain lipids in the TgCRND8 Alzheimer mouse model: prevention by correcting lysosomal proteolytic deficits. Brain. 2014. December;137(Pt 12):3300–3318. PubMed PMID: 25270989; eng. [DOI] [PMC free article] [PubMed] [Google Scholar]
- [31].Pankiv S, Clausen TH, Lamark T, et al. p62/SQSTM1 binds directly to Atg8/LC3 to facilitate degradation of ubiquitinated protein aggregates by autophagy. J Biol Chem. 2007. August 17;282(33):24131–24145. [DOI] [PubMed] [Google Scholar]
- [32].Wang T, Martin S, Papadopulos A, et al. Control of autophagosome axonal retrograde flux by presynaptic activity unveiled using botulinum neurotoxin type a. J Neurosci. 2015. April 15;35(15):6179–6194. PubMed PMID: 25878289; eng. [DOI] [PMC free article] [PubMed] [Google Scholar]
- [33].Kaizuka T, Morishita H, Hama Y, et al. An autophagic flux probe that releases an internal control. Mol Cell. 2016. doi: 10.1016/j.molcel.2016.09.037. [DOI] [PubMed] [Google Scholar]
- [34].Geng J, Klionsky DJ. Direct quantification of autophagic flux by a single molecule-based probe. Autophagy. 2017;13(4):639–641. [DOI] [PMC free article] [PubMed] [Google Scholar]
- [35].Mizushima N. Chapter 2 methods for monitoring autophagy using GFP-LC3 transgenic mice In: Daniel JK, editor. Methods in enzymology. Vol. 452 USA: Academic Press; 2009. p. 13–23. [DOI] [PubMed] [Google Scholar]
- [36].Moulis M, Vindis C. Methods for measuring autophagy in mice. Cells. 2017. June 08;6(2). PubMed PMID: 28594368; eng. doi: 10.3390/cells6020014. [DOI] [PMC free article] [PubMed] [Google Scholar]
- [37].Nixon RA, Wegiel J, Kumar A, et al. Extensive involvement of autophagy in Alzheimer disease: an immuno-electron microscopy study. J Neuropathol Exp Neurol. 2005. February;64(2):113–122. PubMed PMID: 15751225. [DOI] [PubMed] [Google Scholar]
- [38].Maday S, Holzbaur Erika LF. Autophagosome biogenesis in primary neurons follows an ordered and spatially regulated pathway. Dev Cell. 2014;30(1):71–85. [DOI] [PMC free article] [PubMed] [Google Scholar]
- [39].Hollenbeck PJ. Products of endocytosis and autophagy are retrieved from axons by regulated retrograde organelle transport. J Cell Biol. 1993. April;121(2):305–315. PubMed PMID: 7682217. [DOI] [PMC free article] [PubMed] [Google Scholar]
- [40].Cataldo AM, Hamilton DJ, Barnett JL, et al. Abnormalities of the endosomal-lysosomal system in Alzheimer’s disease: relationship to disease pathogenesis. Adv Exp Med Biol. 1996;389:271–280. PubMed PMID: 8861021. [PubMed] [Google Scholar]
- [41].Hakonen A, Beves JE, Stromberg N. Digital colour tone for fluorescence sensing: a direct comparison of intensity, ratiometric and hue based quantification. Analyst. 2014. July 21;139(14):3524–3527. . PubMed PMID: 24603672; eng. [DOI] [PubMed] [Google Scholar]
- [42].Colacurcio DJ, Nixon RA. Disorders of lysosomal acidification-The emerging role of v-ATPase in aging and neurodegenerative disease. Ageing Res Rev. 2016. December;32:75–88. PubMed PMID: 27197071; eng. [DOI] [PMC free article] [PubMed] [Google Scholar]
- [43].Nixon RA, Cataldo AM. Lysosomal system pathways: genes to neurodegeneration in Alzheimer’s disease. J Alzheimers Dis. 2006;9(3 Suppl):277–289. PubMed PMID: 16914867. [DOI] [PubMed] [Google Scholar]
- [44].Nixon RA, Cataldo AM, Mathews PM. The endosomal-lysosomal system of neurons in Alzheimer’s disease pathogenesis: A review. Neurochem Res. 2000;25(9):1161–1172. [DOI] [PubMed] [Google Scholar]
- [45].Dehay B, Bove J, Rodriguez-Muela N, et al. Pathogenic lysosomal depletion in Parkinson’s disease. J Neurosci. 2010. September 15;30(37):12535–12544. . [DOI] [PMC free article] [PubMed] [Google Scholar]
- [46].Cuervo AM, Stefanis L, Fredenburg R, et al. Impaired degradation of mutant a-synuclein by chaperone-mediated autophagy. Science. 2004. August 27;305(5688):1292–1295. PubMed PMID: 15333840. [DOI] [PubMed] [Google Scholar]
- [47].Clayton EL, Mizielinska S, Edgar JR, et al. Frontotemporal dementia caused by CHMP2B mutation is characterised by neuronal lysosomal storage pathology. Acta Neuropathol. 2015. October;130(4):511–523. PubMed PMID: 26358247; eng. [DOI] [PMC free article] [PubMed] [Google Scholar]
- [48].Ballabio A. Disease pathogenesis explained by basic science: lysosomal storage diseases as autophagocytic disorders. Int J Clin Pharmacol Ther. 2009;47(Suppl 1):S34–8. PubMed PMID: 20040309; eng. [DOI] [PubMed] [Google Scholar]
- [49].Nixon RA. Amyloid precursor protein and endosomal-lysosomal dysfunction in Alzheimer’s disease: inseparable partners in a multifactorial disease. FASEB J. 2017. July;31(7):2729–2743. .PubMed PMID: 28663518; eng. [DOI] [PMC free article] [PubMed] [Google Scholar]
- [50].NIH Laboratory animal welfare; U.S. government principles for the utilization and care of vertebrate animals used in testing, research and training; notice. Fed Regist. 1985. May 20;50(97):20864–20865. PubMed PMID: 11655791; eng. [PubMed] [Google Scholar]
- [51].Lee J-H, Yu WH, Kumar A, et al. Lysosomal proteolysis and autophagy require presenilin 1 and are disrupted by Alzheimer-related PS1 mutations. Cell. 2010;141(7):1146–1158. [DOI] [PMC free article] [PubMed] [Google Scholar]
- [52].Yang DS, Kumar A, Stavrides P, et al. Neuronal apoptosis and autophagy cross talk in aging PS/APP mice, a model of Alzheimer’s disease. Am J Pathol. 2008. September;173(3):665–681. PubMed PMID: 18688038; eng. [DOI] [PMC free article] [PubMed] [Google Scholar]