

Abstract
Objectives
The combination of high YKL-40 (a glial inflammatory marker) and low sAPPβ (a soluble β fragment of amyloid precursor protein) in cerebrospinal fluid (CSF) has been associated with frontotemporal lobar degeneration (FTLD) in clinical series. We investigate these biomarkers in a neuropathologically confirmed cohort of patients with FTLD.
Methods
CSF samples were selected from the Penn FTD Center (University of Pennsylvania). Participants were followed to autopsy and had a neuropathological diagnosis of FTLD-Tau (n=24), transactive response DNA-binding protein with 43 kDa (FTLD-TDP) (n=25) or Alzheimer’s disease (AD, n=97). We compared levels of YKL-40 and sAPPβ between groups and with cognitively normal controls (n=77), and assessed their diagnostic utility using receiver operating characteristic curves. We also investigated the effect of AD copathology and the correlation between these CSF markers and tau burden at autopsy.
Results
Both FTLD groups had lower levels of sAPPβ, higher levels of YKL-40 and lower sAPPβ:YKL-40 ratio in CSF compared with controls. The group of pure FTLD-Tau (without AD copathology) showed higher levels of YKL-40 than AD and than pure FTLD-TDP. YKL-40 levels correlated with pathological tau burden. The sAPPβ:YKL-40 ratio had an area under the curve (AUC) of 0.91 (95% CI 0.86 to 0.96) to distinguish subjects with FTLD from controls, but lower values to distinguish FTLD from AD (AUC 0.70; 95% CI 0.61 to 0.79) and to discriminate FTLD-Tau from FTLD-TDP (AUC 0.67; 95% CI 0.51 to 0.82).
Conclusions
Our study provides pathological confirmation that the combination of low sAPPβ and high YKL-40 in CSF is associated with FTLD. These biomarkers could be useful in particular clinical settings when FTLD is suspected.
INTRODUCTION
Frontotemporal lobar degeneration (FTLD) is a pathological and genetically heterogeneous disorder that leads to neurodegeneration in frontal and temporal regions. Patients with FTLD can present different clinical syndromes typically affecting language and/or behaviour. Patients with FTLD harbour either deposits of tau, TDP-43 or fused in sarcoma (FUS),1–3 but in most cases the specific underlying proteinopathy cannot be ascertained in vivo. Thus, patients with different clinical syndromes may show identical neuropathological findings, and in turn a specific clinical syndrome can be the expression of more than one proteinopathy.2 The challenges in predicting the underlying proteinopathy are an important limitation for achieving an accurate diagnosis and for the development of protein-specific therapeutic approaches. In addition, some patients with FTLD might present with subtle or very slowly progressive behavioural symptoms.2,4 The development of biomarkers to distinguish these patients from others with psychiatric non-neurodegenerative conditions is a relevant area of research.
Cerebrospinal fluid (CSF) biomarkers provide an opportunity to measure changes in vivo that may reflect pathophysiological events in the brain. In Alzheimer’s disease (AD), the use of CSF biomarkers has dramatically improved the accuracy of the diagnosis.5,6 In FTLD, however, there is a lack of well-established diagnostic markers in CSF.7 Core AD biomarkers (Aβ42, t-tau and p-tau) are being used in FTLD-related syndromes to exclude AD8, but specific markers of FTLD are also needed. Unfortunately, many biomarker studies in FTLD-related syndromes may be confounded by co-occurring secondary AD pathology, and the impact of this concomitant pathology on biomarker levels is not usually assessed.9 Neurofilament light levels have been shown to be increased in FTLD but also in AD, indicating lack of disease specificity. Levels in CSF of the astroglial marker of inflammation YKL-40 are higher in different neurodegenerative diseases than in controls, without disease specificity.10–12 Other studies have described low CSF levels of markers of the amyloid precursor protein (APP) processing in patients with FTLD compared with those of patients with AD and controls.10,13–16 In previous studies, we found that the combination of sAPPβ (the soluble β fragment of APP) and YKL-40 was consistently associated with FTLD-related clinical syndromes in a clinical cohort.10,16 In the present study, we investigate this biomarker profile in antemortem CSF samples obtained from a neuropathologically confirmed cohort of patients with FTLD accounting for the presence of comorbid AD pathology.
METHODS
CSF samples
A total of 223 antemortem CSF samples obtained between 1992 and 2015 were selected from the Penn FTD Center at the University of Pennsylvania (Philadelphia, USA).17,18 Preanalytical processing details can be found elsewhere.17 Subjects were followed to autopsy and had a neuropathological diagnosis of FTLD-Tau (n=24), FTLD-TDP (n=25) or AD (n=97) ( figure1). We also analysed CSF samples from 77 cognitively normal controls that were recruited from the community and were screened by obtaining medical history and reviewing their medications. Cognitively normal controls self-reported a negative neurological and psychiatric history and were screened to have cognition within normal limits (Mini-Mental State Examination >27). CSF samples from patients and controls were processed in the same way.
Figure 1.
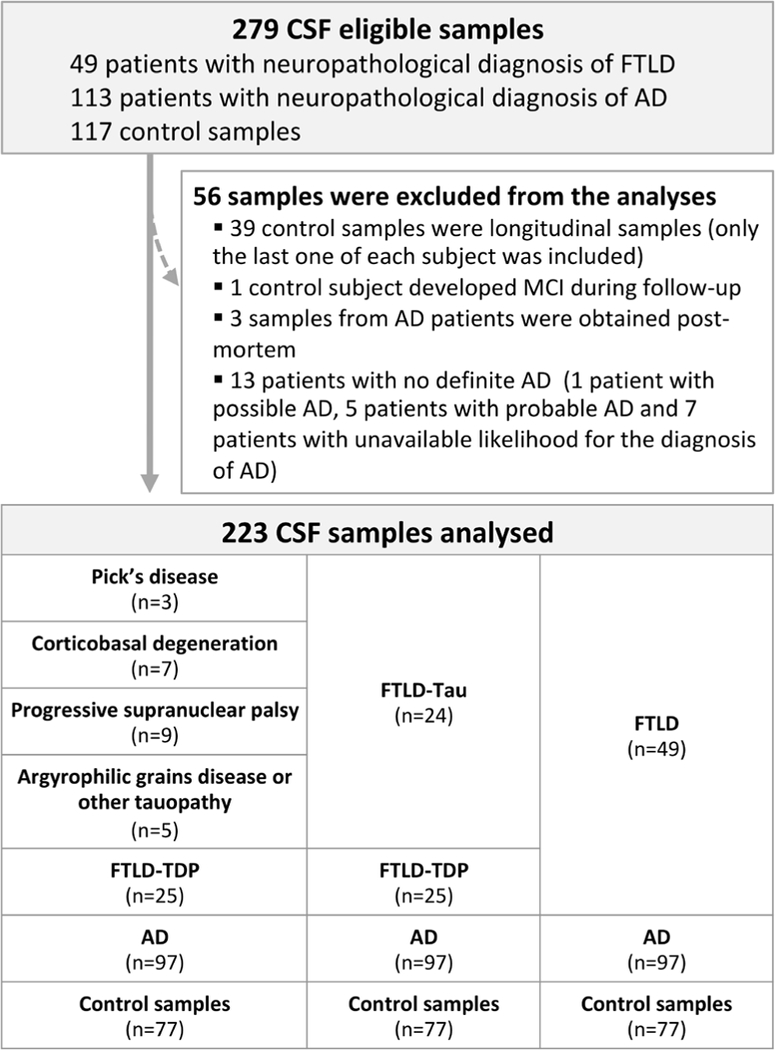
Flow chart of participants and samples included in the study. AD, Alzheimer’s disease; CSF, cerebrospinal fluid; FTLD, frontotemporal lobar degeneration; MCI, mild cognitive impairment.
Neuropathological classification and quantification of tau burden
Neuropathological diagnosis was established following previously described methods and international published criteria.18–22 Patients with a primary neuropathological diagnosis of Pick’s disease, corticobasal degeneration, progressive supranuclear palsy, argyrophilic grain disease or non-classifiable non-AD tauopathies were classified as FTLD-Tau. Tau burden was measured digitally and in a validated parametric manner in grey and white matter of three different areas (mid-frontal cortex, angular gyrus and anterior cingulate gyrus) as the percentage of area that contained tau deposits, as previously described.18,20 A global measure of tau burden was obtained as the sum of these three values. Patients with FTLD with TDP-43 inclusions were classified as FTLD-TDP According to the location and type of TDP-43 inclusions, these patients were subsequently classified as type A, B or C, following consensus criteria.23
A subset of patients with FTLD-Tau (n=20/24) and FTLD-TDP (n = 18/25) had a neurofibrillary tangle score of B0 or B1 in the National Institute on Aging-Alzheimer’s Association (NIA-AA) classification,18,24 and therefore had no evidence of significant AD copathology. This subset of patients was analysed independently in order to examine the levels of CSF biomarkers in cases with pure FTLD pathology excluding the effects of comorbid AD pathology. All patients with a neuropathological diagnosis of AD had scores of B2 or B3 in the NIA-AA classification.
CSF analysis
We analysed CSF levels of sAPPβ and YKL-40 at Hospital Sant Pau using commercially available ELISA kits (Human sAPPβ-w highly sensitive, IBL, Gunma, Japan; and MicroVue, Quidel, San Diego, California, USA, respectively) and following previously reported methods.10,16,25 Samples were randomised according to diagnosis across plates to minimise the effects of run-to-run variation. Samples were analysed in duplicates in a total of seven plates for each assay. Mean intra-assay and interassay coefficients of variation were 3.7% and 4.3% for sAPPβ and 3.1% and 6.9% for YKL-40, respectively.
Statistical analysis
We assessed normality of the variables using the Kolmogorov-Smirnov test. sAPPβ and the sAPPβ :YKL-40 ratio were log-transformed to achieve a normal distribution for further bivariate and multivariate analyses. We used the χ2 test to assess differences in sex, and analysis of variance for age, education, age at death, time interval from symptom onset to CSF collection and time interval from symptom onset to death. To minimise the influence of possible outliers and heterogeneity of variances, we used robust linear models followed by weighted least squares analysis of covariance, including age and sex as covariates. All p values were corrected for multiple comparisons using Tukey’s ‘Honest Significant Differences’ post-hoc test. We assessed the diagnostic utility of CSF biomarkers using receiver operating characteristic (ROC) curves. We used the ‘DeLong’ method to compare ROC curves. We used ‘MASS’ and ‘pROC’ packages from the R statistical software (V3.3.2) for statistical analyses.
RESULTS
Demographics and clinical data
Table 1 shows the demographic and clinical data of the subjects according to their final neuropathological diagnosis. The FTLD-Tau group had higher proportion of male (p = 0.004). There were differences between groups in age at death, time interval from symptom onset to death, and time interval between CSF sampling and death. Therefore, sex and age at CSF collection were included as covariates in all biomarker statistical analysis.
Table 1.
Demographics, clinical, pathological and CSF data
| FTLD-Tau | ftld-tdp | AD | Control | P values* | |
|---|---|---|---|---|---|
| n | 24 | 25 | 97 | 77 | |
| Age at CSF collection (years) | 66.9 (11.3) | 66.4 (8.7) | 71 (10.6) | 68.2 (9) | 0.06 |
| Female, n (%) | 6 (25) | 13 (52) | 45 (46) | 50 (65) | 0.004 |
| Education (years) | 15.6 (3.5) | 15.1 (2.7) | 14.8 (3.1) | 16.2 (3.2) | 0.05 |
| Age at death (years) | 71.4 (12.6) | 70 (9.5) | 76.6 (10.6) | NA | 0.008 |
| Participants with no AD pathology (NIA-AA stage ≤B1), n (%) | 20 (83) | 18 (72) | 0 | NA | 0.003 |
| Time interval, onset-CSF (years) | 3.8 (2.7) | 3.7 (2.7) | 4.3 (2.6) | NA | 0.521 |
| Time interval, CSF-death (years) | 4.5 (3.6) | 3.6 (3) | 5.6 (3.6) | NA | 0.029 |
| Total disease duration, onset-death (years) | 8.5 (4.6) | 7.2 (3.3) | 9.8 (4.1) | NA | 0.013 |
| sAPPβ (ng/mL) | 477.5 (120) | 544.9 (239.4) | 717.1 (441.6) | 848.4 (381.9) | <0.001 |
| YKL-40 (ng/mL) | 299.8 (69.1) | 265.6 (48.5) | 268.2 (77.2) | 210.3 (55.1) | <0.001 |
| sAPPβ:YKL-40 ratio | 1.67 (0.56) | 2.07 (0.78) | 2.77 (1.5) | 4.19 (1.89) | <0.001 |
Unless otherwise specified, results are expressed as mean (SD).
P values were obtained by comparing the groups of FTLD-Tau, FTLD-TDP, AD and control. Tukey’s honest significant differences post-hoc comparisons are detailed in figure 2. AD, Alzheimer’s disease; CSF, cerebrospinal fluid; FTLD, frontotemporal lobar degeneration; NA, not applicable; NIA-AA, National Institute on Aging-Alzheimer’s Association; sAPPβ, soluble β fragment of amyloid precursor protein
In the FTLD group, there was no association between CSF biomarkers and time interval between onset and CSF sampling, or between CSF sampling and death. In the AD group, we found small yet significant direct associations of sAPPβ levels and of the sAPPβ:YKL-40 ratio with the time interval between onset and CSF sampling (adjusted r2 = 0.05, p = 0.06 and adjusted r2 = 0.11, p = 0.002, respectively) and with time from CSF sampling to death (adjusted r2 = 0.17, p = 0.013 and adjusted r2 = 0.20, p = 0.002, respectively).
Patients with FTLD have lower levels of sAPPβ and higher levels of YKL-40 in CsF than controls
As displayed in figure 2, there were differences in the levels of sAPPp (F(3,217) = 6.73; p<0.001), YKL-40 (F(3,217) = 18.12; p<0.001) and the sAPPβ:YKL-40 ratio (F3,217)=24.74; p<0.001) between groups. In the post-hoc analysis, patients with FTLD-Tau and FTLD-TDP showed lower levels of sAPPβ, and each patient group (FTLD-Tau, FTLD-TDP and AD) showed higher levels of YKL-40 and lower sAPPβ:YKL-40 ratios compared with controls. The levels of YKL-40 in the FTLD-Tau group were higher than those in AD, but no significant differences were found between the FTLD-TDP and AD groups or between FTLD-Tau and FTLD-TDP groups. The sAPPβ:YKL-40 ratio was lower in both FTLD groups compared with controls and compared with the AD group. We found no differences in the levels of sAPPβ, YKL-40 or their ratio between TDP subtypes or between tau subtypes (table 2). We did not find differences in any biomarker between patients with mutations and patients without mutations (data not shown).
Figure 2.
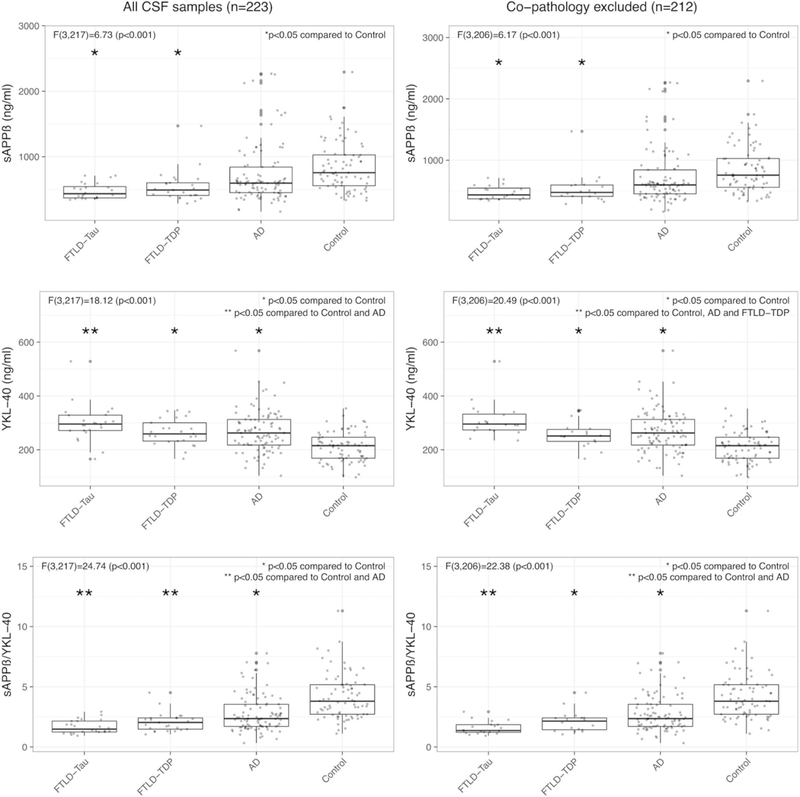
Levels of sAPPβ, YKL–40 and the sAPPβ:YKL–40 ratio in cearbrospinal fluid across pathological diagnostic groups. Only statistically significant differences are displayed (analysis of covariance and post-hoc Tukey’s honest significant differences). All results were adjusted for age and sex, and correction for multiple comparisons was applied. AD, Alzheimer’s disease; FTLD-Tau, frontotemporal lobar degeneration-Tau; FTLD-TDP, frontotemporal lobar degeneration-TDP, sAPPβ, soluble β fragment of amyloid precursor protein.
Table 2.
Demographics, clinical, pathological and CSF data in FTLD-Tau and FTLD-TDP subgroups
| FTLD-Tau |
FTLD-TDP |
|||||||||
|---|---|---|---|---|---|---|---|---|---|---|
| Pick’s disease | CBD | PSP | Other Tauopathy |
P values | A | B | C | Non-specified | P values | |
| n | 3 | 7 | 9 | 5 | NA | 1 | 11 | 8 | 5 | NA |
| Age at CSF collection (years) | 58.3(5.8) | 57.6(8.2) | 73.8(7.3) | 72.6(12.4) | 0.01 | 73(NA) | 65.1(8.7) | 70.3(9.8) | 62(4.2) | 0.32 |
| Sex (% female) | 33.3 | 42.9 | 22.2 | 0.0 | 0.39 | 100.0 | 54.6 | 50.0 | 50.0 | 0.82 |
| Education (years) | 16.7(2.3) | 15.5(3.1) | 16.1(2.9) | 14(5.4) | 0.88 | 14(NA) | 14.4(2.3) | 16.5(3.2) | 16.5(2.1) | 0.43 |
| Age at death (years) | 63.3(6.8) | 60.1(9) | 76.7(8.6) | 82.4(11.5) | <0.01 | 75(NA) | 68(10.3) | 74.4(9.9) | 63(2.8) | 0.32 |
| % with no AD pathology (NIA-AA stage ≤B1) | 100 | 100 | 78 | 60 | 0.25 | 100 | 56 | 100 | 80 | 0.11 |
| Time interval, onset-CSF (years) | 4.3(3.1) | 2.5(1) | 4.3(3.5) | 4.2(2.7) | 0.48 | 1(NA) | 4.5(3.3) | 3.6(1.8) | 2(1.4) | 0.36 |
| Time interval, CSF-death (years) | 5(1.7) | 2.6(1.5) | 2.9(2.1) | 9.8(3.3) | 0.01 | 2(NA) | 2.9(2.9) | 4.1(2.2) | 1(1.4) | 0.26 |
| Total disease duration, onset-death (years) | 9.3(4.7) | 5.3(1.4) | 7.2(4.7) | 14(1) | 0.02 | 3(NA) | 7.4(3.1) | 7.8(3) | 3 | 0.19 |
| sAPPβ (ng/mL) | 518.3(141.9) | 452.2(120.6) | 487.4(112.9) | 470.7(150.8) | 0.86 | 415(NA) | 533.9(179.9) | 525.8(121) | 441.2(24.6) | 0.76 |
| YKL-40 (ng/mL) | 269.3(3.6) | 314.6(57.7) | 314.4(90.2) | 271(59.6) | 0.24 | 280.3(NA) | 280.3(48.6) | 251.2(48.7) | 228.8(54.9) | 0.54 |
| sAPPβ:YKL-40 ratio | 1.92(0.51) | 1.54(0.71) | 1.63(0.55) | 1.77(0.49) | 0.47 | 1.48(NA) | 1.9(0.51) | 2.21(0.8) | 2(0.59) | 0.69 |
Unless Otherwise specified, the results are expressed as mean (SD). Differences between subtypes were assessed by Kruskal-Wallis rank-sum test for numeric quantitative variables and χ2 test for categorical variables. AD, Alzheimer’s disease; CBD, corticobasal degeneration; CSF, cerebrospinal fluid; FTLD, frontotemporal lobar degeneration; NA, not applicable; NIA-AA, National Institute on Aging and Alzheimer’s Association; PSP, progressive supranuclear palsy; Tauopathy, argyrophilic grain disease (n=4) and unclassifiable tauopathy (n=1); sAPPβ, soluble β fragment of amyloid precursor protein.
Relationship of sAPPβ and YKL-40 with tau protein aggregates in FTLD
In the FTLD group, after adjusting by age and sex, YKL-40 levels in CSF (but not sAPPβ or the sAPPβ:YKL-40 ratio) showed a weak direct correlation with pathological tau burden in the mid-frontal cortex (r2 = 0.18; p = 0.02), angular gyrus (r2 = 0.19; p = 0.02), anterior cingulate gyrus (r2 = 0.15; p = 0.05) and the global measure of tau burden (r2 = 0.18; p = 0.03;). These results did not change significantly after excluding one high value of YKL-40 that could be considered an outlier. These correlations were non-significant when FTLD-TDP and FTLD-Tau were analysed separately.
Influence of Ad copathology
To explore the effects of incidental AD copathology on biomarker results, we repeated the analysis in the subgroup of patients with FTLD who had no significant AD pathology, defined by a neuro fibrillary tangle score of B0 or B1 in the NIA-AA classification (figure 2). Similar to the results found in the whole sample, there were differences in the levels of sAPPβ (F(3,206) = 6.17; p<0.001), YKL-40 (F(3,206)=20.49; p<0.001) and the sAPPβ:YKL-40 ratio (F(3,206)=22.38; p<0.001) between groups. The groups of patients with pure FTLD-Tau and pure FTLD-TDP showed lower levels of sAPPβ compared with controls. The group of pure FTLD-Tau showed higher levels of YKL-40, compared with AD and compared with the group of pure FTLD-TDP. Both FTLD-Tau and FTLD-TDP groups had lower sAPPβ:YKL-40 ratios compared with controls, and in this subset only those with FTLD-Tau were significantly lower than those in the AD group.
Diagnostic value of CSF sAPPβ and YKL-40 in FTLD
The ROC curve analyses are displayed in figure 3. Both sAPPβ and YKL-40 had an area under the curve (AUC) above 0.80 and the sAPPβ:YKL-40 ratio had an AUC of 0.91 (95% CI 0.86 to 0.96) to distinguish patients with FTLD from controls. Similar results were found in the subgroup with no AD copathology (table 3). An optimal cut-off point for sAPPp:YKL-40 ratio of 2.45 had a sensitivity and specificity above 85% to discriminate FTLD from controls.
Figure 3.
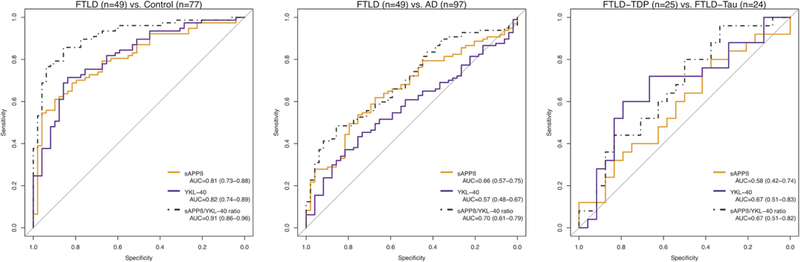
Receiver operating characteristic curves for the analysis of cerebrospinal fluid biomarkers’ diagnostic utility. All participants were included in these analyses. Values are expressed as AUC (95% CI). AD, Alzheimer’s disease; AUC, area under the curve; FTLD, frontotemporal lobar degeneration; sAPPβ, soluble β fragment of amyloid precursor protein
Table 3.
Cut-off values for sAPPβ and YKL-40 to discriminate between FTLD and cognitively normal controls and between FTLD and AD
| FTLD vs CN | ||||||||
|---|---|---|---|---|---|---|---|---|
| All participants 49 FTLD vs 77 CN |
No copathology 38 FTLD vs 77 CN |
|||||||
| AUC (95% CI) | Best-fit cut-off | Se (%) | Sp (%) | AUC (95% CI) | Best-fit cut-off | Se (%) | Sp (%) | |
| sAPPβ | 0.81 (0.73 to 0.88) | 463 ng/mL | 86 | 51 | 0.82 (0.74 to 0.90) | 463 ng/mL | 86 | 53 |
| YKL-40 | 0.82 (0.74 to 0.89) | 278 ng/mL | 86 | 53 | 0.83 (0.75 to 0.90) | 278 ng/mL | 87 | 50 |
| sAPPβ:YKL-40 ratio | 0.91 (0.86 to 0.96) | 2.45 | 86 | 86 | 0.91 (0.86 to 0.97) | 2.45 | 86 | 87 |
| FTLD vs AD | ||||||||
|
All participants
49 FTLD vs 97 AD |
No copathology
38 FTLD vs 97 AD |
|||||||
| AUC (95% CI) | Best-fit cut-off | Se (%) | Sp (%) | AUC (95% CI) | Best-fit cut-off | Se (%) | Sp (%) | |
| sAPPβ | 0.66 (0.57 to 0.75) | 393 ng/mL | 85 | 27 | 0.68 (0.58 to 0.77) | 393 ng/mL | 85 | 29 |
| YKL-40 | 0.57 (0.48 to 0.67) | 336 ng/mL | 85 | 16 | 0.58 (0.49 to 0.68) | 339 ng/mL | 87 | 18 |
| sAPPβ:YKL-40 ratio | 0.70 (0.61 to 0.79) | 1.51 | 86 | 39 | 0.71 (0.62 to 0.81) | 1.51 | 86 | 55 |
|
FTLD-Tau vs FTLD-TDP | ||||||||
|
All participants
24 FTLD-Tau vs 25 FTLD-TDP |
No copathology
20 FTLD-Tau vs 18 FTLD-TDP |
|||||||
| AUC (95% CI) | Best-fit cut-off | Se (%) | Sp (%) | AUC (95% CI) | Best-fit cut-off | Se (%) | Sp (%) | |
| sAPPβ | 0.58 (0.42 to 0.74) | 393 ng/mL | 85 | 27 | 0.58 (0.39 to 0.76) | 364 ng/mL | 89 | 20 |
| YKL-40 | 0.67 (0.51 to 0.83) | 336 ng/mL | 85 | 16 | 0.79 (0.63 to 0.94) | 328 ng/mL | 89 | 30 |
| sAPPβ:YKL-40 ratio | 0.67 (0.51 to 0.82) | 1.51 | 86 | 39 | 0.71 (0.54 to 0.88) | 1.28 | 89 | 35 |
Best-fit cut-off values were obtained for sAPPβ, YKL-40 and the sAPPβ:YKL-40. Specificity was optimised for a sensitivity level of at least 85%. AD, Alzheimer’s disease; AUC, area under the curve; CN, cognitively normal control; FTLD, frontotemporal lobar degeneration; Se, sensitivity; Sp, specificity; sAPPβ, soluble ®fragment of amyloid precursor protein.
The overall diagnostic accuracy of the sAPPβ :YKL-40 ratio was lower to distinguish patients with FTLD from patients with AD (AUC 0.70; 95% CI 0.61 to 0.79) and to distinguish patients with FTLD-Tau from those with FTLD-TDP pathology (AUC 0.67; 95% CI 0.51 to 0.82). In the subgroup with no comorbid AD pathology, the sAPPβ:YKL-40 ratio had an AUC of 0.71 (95% CI 0.54 to 0.88) to discriminate between FTLD-Tau and FTLD-TDP In this subgroup, the AUC of YKL-40 to distinguish patients with FTLD-Tau from controls (AUC 0.91; 95% CI 0.85 to 0.97) was significantly higher compared with that to discriminate FTLD-TDP from controls (AUC 0.74; 95% CI 0.62 to 0.85) (D=−2.58; p = 0.01; online supplementary material 1).
DISCUSSION
The main finding of this study is that patients with pathologically confirmed FTLD have higher levels of YKL-40 and lower levels of sAPPβ in CSF compared with controls. The combination of these biomarkers (sAPPβ :YKL-40 ratio) provides high diagnostic accuracy to distinguish patients with FTLD from controls. This appears to be due largely to the group with FTLD-Tau, where we found that CSF YKL-40 levels in patients without AD copathology are elevated compared with patients with FTLD-TDP and with those with AD, and that CSF YKL-40 levels correlate with tau burden in FTLD.
In our previous study of these CSF analytes in clinically diagnosed patients,16 we did not detect differences between patients with high likelihood of FTLD-Tau and patients with high likelihood of FTLD-TDP The present study examines these analytes in patients with neuropathological confirmation. It is important to note here that, in the pure FTLD group (after excluding patients with AD copathology), we found higher levels of YKL-40 in FTLD-Tau compared with FTLD-TDP This reinforces the notion that coincident pathologies, comorbid AD in this case, have an impact on CSF biomarkers.9,18,26 We also found that, in agreement with another study,27 YKL-40 in FTLD-Tau is elevated compared with AD and controls.
Although YKL-40 lacks disease specificity, this marker could provide some in vivo information about the underlying pathology. High levels of YKL-40 might be due to the activation of inflammatory pathways associated to neurodegeneration.11,28–30 Previous evidence supports this hypothesis. In human brain, YKL-40 immunoreactivity is detected in a subset of reactive astrocytes.28 It is also worth mentioning that YKL-40 immunoreactivity correlates with tau deposits in different tauopathies.28 FTLD-Tau is associated with significantly greater independent grey matter pathology in astrocytes and grey/white matter pathology oligodendrocytes.31 In the present study, we expand these data by showing a relationship between levels of YKL-40 in CSF and FTLD-Tau pathology. We found a mild, yet significant, correlation between levels of YKL-40 in CSF and the amount of regional and global tau pathology. The relationship between tau pathology and CSF YKL-40 is also supported by our observation that patients with FTLD-Tau without AD copathology had higher levels of YKL-40 in CSF than patients with FTLD-TDP and than patients with AD. Taken together, these findings support the idea that although the pathway mediated by YKL-40 is activated in different neurodegenerative conditions, it is particularly sensitive to tau aggregation.28
Likewise, low levels of sAPPβ may be informative. This could be the result of reduced overall APP processing or availability due to accelerated atrophy and neuronal loss in frontotemporal regions, which are characteristic of FTLD but also present to some extent in other neurodegenerative diseases such as advanced or atypical AD.13,16
Our previous study reported that the combination of CSF sAPPβ with YKL-40 in clinically defined patients had a good diagnostic performance in a clinical setting to distinguish frontotemporal dementia from AD and cognitively normal controls.16 The present study extends these findings to patients with neuropathological confirmation. We confirm differences in levels of sAPPβ, YKL-40 and the sAPPP:YKL-40 ratio in CSF between patients with FTLD and controls. However, diagnostic accuracy of the sAPPβ:YKL-40 ratio was lower to distinguish patients with FTLD from patients with AD (AUC 0.70) than in our previous study.16
The results of this study have clinical implications. Although the sAPPβ:YKL-40 ratio does not appear to be useful to distinguish TDP-43 from tau proteinopathies or to discriminate between patients with FTLD and AD, this marker could be useful in combination with AD biomarkers in patients with atypical or mild symptoms of frontotemporal dementia. For instance, patients with behavioural symptoms and normal AD biomarkers that have low sAPPβ:YKL-40 ratio in CSF would likely have FTLD pathology, whereas those with high sAPPβ :YKL-40 ratio would more likely correspond to psychiatric non-neurodegenerative conditions.16
We acknowledge that our study has some limitations. First, although CSF analytes in well-annotated autopsy cases of these uncommon conditions are rare, we were able to analyse only very small groups of patients. Second, the time between CSF acquisition and death (and therefore neuropathological confirmation) is variable and reaches up to 10 years in some cases. This variability might underestimate the relationship between participants’ CSF biochemical signature and their final neuropathological findings. Finally, our control participants lack neuropathological confirmation. However, complete clinical and neuropsychological evaluations were performed to exclude significant medical (and specifically neurological) conditions in these participants.
In summary, the results of this study provide pathological confirmation of a CSF biomarker profile found in patients with FTLD that consists of high levels of YKL-40, low levels of sAPPβ and low sAPPβ:YKL-40 ratio. Although this profile is not specific of the underlying proteinopathy, the findings suggest that the inflammatory marker YKL-40 may be particularly associated with FTLD-Tau pathology, and these analytes could be clinically useful in particular clinical settings in combination with AD biomarkers.
Supplementary Material
Acknowledgements
We would like to thank all the participants who agreed to take part in this study and all the members of the clinical teams involved in the selection and assessment.
Funding This work was supported by CIBERNED and Instituto de Salud Carlos III (PI1 1/02425 and PI14/01126 to JF, PI13/01 532 to RB, PI15/00026 to JC, and PI14/01561 to AL), jointly funded by Fondo Europeo de Desarrollo Regional (FEDER), Unión Europea, ‘Una manera de hacer Europa’. This work was also supported in part by Generalitat de Catalunya (2014SGR-0235), PERIS grants (SLT002/16/00408 and SLT006/17/125), and ‘Marató TV3’ grants 201412 10 to JF and 201426 10 to AL. II-G was supported by an i-PFIS grant (IF15/00060) from the Fondo de Investigación en Salud, Instituto de Salud Carlos III. This study was also supported by grants AG010124, AG032953, AG043503,NS088341, AG017586, NS053488, AG052943 and AG038490 from the National Institute of Health, and the Wyncote Foundation, Dana Foundation, BrightFocus Foundation, Penn Institute on Aging, Newhouse Foundation and Arking Family Foundation. The study sponsors had no role in the design of the study, in the collection, analysis and interpretation of data, in the writing of the report, or in the decision to submit the paper for publication. The corresponding author had full access to all the data in the study and had final responsibility for the decision to submit for publication.
Footnotes
Competing interests None declared.
Ethics approval The Institutional Review Board at the University of Pennsylvania approved the study.
Provenance and peer review Not commissioned; externally peer reviewed.
Data sharing statement To request any specific data, please contact the corresponding author (alleo@santpau.es).
REFERENCES
- 1.Irwin DJ, Cairns NJ, Grossman M, et al. Frontotemporal lobar degeneration: defining phenotypic diversity through personalized medicine. Acta Neuropathol 2015;129:469–91. [DOI] [PMC free article] [PubMed] [Google Scholar]
- 2.Elahi FM, Miller BL. A clinicopathological approach to the diagnosis of dementia. Nat Rev Neurol 2017;13:457–76. [DOI] [PMC free article] [PubMed] [Google Scholar]
- 3.Josephs KA, Hodges JR, Snowden JS, et al. Neuropathological background of phenotypical variability in frontotemporal dementia. Acta Neuropathol 2011;122:137–53. [DOI] [PMC free article] [PubMed] [Google Scholar]
- 4.Khan BK, Yokoyama JS, Takada LT, et al. Atypical, slowly progressive behavioural variant frontotemporal dementia associated with C9ORF72 hexanucleotide expansion. JNeurolNeurosurg Psychiatry 2012;83:358–64. [DOI] [PMC free article] [PubMed] [Google Scholar]
- 5.Olsson B, Lautner R, Andreasson U, et al. CSF and blood biomarkers for the diagnosis of Alzheimer’s disease: a systematic review and meta-analysis. Lancet Neurol 2016;15:673–84. [DOI] [PubMed] [Google Scholar]
- 6.Lleó A, Cavedo E, Parnetti L, et al. Cerebrospinal fluid biomarkers in trials for Alzheimer and Parkinson diseases. Nat Rev Neurol 2015;11:41–55. [DOI] [PubMed] [Google Scholar]
- 7.Irwin DJ, Trojanowski JQ, Grossman M. Cerebrospinal fluid biomarkers for differentiation of frontotemporal lobar degeneration from Alzheimer’s disease. Front Aging Neurosci 2013;5:6. [DOI] [PMC free article] [PubMed] [Google Scholar]
- 8.Bian H, Van Swieten JC, Leight S, et al. CSF biomarkers in frontotemporal lobar degeneration with known pathology. Neurology 2008;70(19 Pt 2):1827–35. [DOI] [PMC free article] [PubMed] [Google Scholar]
- 9.Toledo JB, Brettschneider J, Grossman M, et al. CSF biomarkers cutoffs: the importance of coincident neuropathological diseases. Acta Neuropathol 2012;124:23–35. [DOI] [PMC free article] [PubMed] [Google Scholar]
- 10.Alcolea D, Carmona-Iragui M, Suarez-Calvet M, et al. Relationship between β-Secretase, inflammation and core cerebrospinal fluid biomarkers for Alzheimer’s disease. JAlzheimers Dis 2014;42:157–67. [DOI] [PubMed] [Google Scholar]
- 11.Craig-Schapiro R, Perrin RJ, Roe CM, et al. YKL-40: a novel prognostic fluid biomarker for preclinical Alzheimer’s disease. Biol Psychiatry 2010;68:903–12. [DOI] [PMC free article] [PubMed] [Google Scholar]
- 12.Janelidze S, Hertze J, Zetterberg H, et al. Cerebrospinal fluid neurogranin and YKL-40 as biomarkers of Alzheimer’s disease. Ann Clin Transl Neurol 2016;3:12–20. [DOI] [PMC free article] [PubMed] [Google Scholar]
- 13.Gabelle A, Roche S, Gény C, et al. Decreased sAβPPβ, Aβ38, and Aβ40 cerebrospinal fluid levels in frontotemporal dementia. J Alzheimers Dis 2011;26:553–63. [DOI] [PubMed] [Google Scholar]
- 14.Struyfs H, Van Broeck B, Timmers M. Diagnostic accuracy of cerebrospinal fluid amyloid-β isoforms for early and differential dementia diagnosis. J Alzheimers Dis 2015;45:813–22. [DOI] [PubMed] [Google Scholar]
- 15.Alexopoulos P, Guo LH, Tsolakidou A, et al. Interrelations between CSF soluble AβPPβ, amyloid-β 1–42, SORL1, and tau levels in Alzheimer’s disease. J Alzheimers Dis 2012;28:543–52. [DOI] [PubMed] [Google Scholar]
- 16.Alcolea D, Vilaplana E, Suarez-Calvet M, et al. CSF sAPPβ, YKL-40, and neurofilament light in frontotemporal lobar degeneration. Neurology 2017;89:178–88. [DOI] [PubMed] [Google Scholar]
- 17.Irwin DJ, McMillan CT, Toledo JB, et al. Comparison of cerebrospinal fluid levels of tau and Aβ 1–42 in Alzheimer disease and frontotemporal degeneration using 2 analytical platforms. Arch Neurol 2012;69:1018–25. [DOI] [PMC free article] [PubMed] [Google Scholar]
- 18.Irwin DJ, Lleó A, Xie SX, et al. Ante mortem cerebrospinal fluid tau levels correlate with postmortem tau pathology in frontotemporal lobar degeneration. Ann Neurol 2017;82:247–58. [DOI] [PMC free article] [PubMed] [Google Scholar]
- 19.Toledo JB, Van Deerlin VM, Lee EB, et al. A platform for discovery: the university of pennsylvania integrated neurodegenerative disease biobank. Alzheimers Dement 2014;10:1–9. [DOI] [PMC free article] [PubMed] [Google Scholar]
- 20.Irwin DJ, Byrne MD, McMillan CT, et al. Semi-Automated Digital Image Analysis of Pick’s Disease and TDP-43 Proteinopathy. JHistochem Cytochem 2016;64:54–66. [DOI] [PMC free article] [PubMed] [Google Scholar]
- 21.Brettschneider J, Del Tredici K, Irwin DJ, et al. Sequential distribution of pTDP-43 pathology in behavioral variant frontotemporal dementia (bvFTD). Acta Neuropathol 2014;127:423–39. [DOI] [PMC free article] [PubMed] [Google Scholar]
- 22.Irwin DJ, Brettschneider J, McMillan CT, et al. Deep clinical and neuropathological phenotyping of Pick disease. Ann Neurol 2016;79:272–87. [DOI] [PMC free article] [PubMed] [Google Scholar]
- 23.Mackenzie IR, Neumann M, Baborie A, et al. A harmonized classification system for FTLD-TDP pathology. Acta Neuropathol 2011;122:111–3. [DOI] [PMC free article] [PubMed] [Google Scholar]
- 24.Hyman BT, Phelps CH, Beach TG, et al. National Institute on Aging-Alzheimer’s Association guidelines for the neuropathologic assessment of Alzheimer’s disease. Alzheimers Dement 2012;8:1–13. [DOI] [PMC free article] [PubMed] [Google Scholar]
- 25.Alcolea D, Martinez-Lage P, Sanchez-Juan P, et al. Amyloid precursor protein metabolism and inflammation markers in preclinical Alzheimer disease. Neurology 2015;85:626–33. [DOI] [PubMed] [Google Scholar]
- 26.Lleó A, Irwin DJ, Illán-Gala I, et al. A 2-Step Cerebrospinal Algorithm for the Selection of Frontotemporal Lobar Degeneration Subtypes. JAMA Neurol 2018;75:738–45. [DOI] [PMC free article] [PubMed] [Google Scholar]
- 27.Teunissen CE, Elias N, Koel-Simmelink MJ, et al. Novel diagnostic cerebrospinal fluid biomarkers for pathologic subtypes of frontotemporal dementia identified by proteomics. Alzheimers Dement (Amst) 2016;2:86–94. [DOI] [PMC free article] [PubMed] [Google Scholar]
- 28.Querol-Vilaseca M, Colom-Cadena M, Pegueroles J, et al. YKL-40 (Chitinase 3-like I) is expressed in a subset of astrocytes in Alzheimer’s disease and other tauopathies. J Neuroinflammation 2017;14:118. [DOI] [PMC free article] [PubMed] [Google Scholar]
- 29.Alcolea D, Vilaplana E, Pegueroles J, et al. Relationship between cortical thickness and cerebrospinal fluid YKL-40 in predementia stages of Alzheimer’s disease. Neurobiol Aging 2015;36:2018–23. [DOI] [PubMed] [Google Scholar]
- 30.Thompson AG, Gray E, Thézénas ML, et al. Cerebrospinal fluid macrophage biomarkers in amyotrophic lateral sclerosis. Ann Neurol 2018;83:258–68. [DOI] [PubMed] [Google Scholar]
- 31.Irwin DJ, McMillan CT, Xie SX, et al. Asymmetiy of post-mortem neuropathology in behavioural-variant frontotemporal dementia. Brain 2018;141:288–301. [DOI] [PMC free article] [PubMed] [Google Scholar]
Associated Data
This section collects any data citations, data availability statements, or supplementary materials included in this article.