

Abstract
Background:
The US lung allocation system prioritizes allocation based upon medical urgency and benefit but does not address a federal mandate for broader geographic organ sharing. Whether broader geographic sharing of donor lungs would improve lung transplant waitlist outcomes is unknown.
Methods:
A discrete event microsimulation model simulated donor lung allocation according to different geographic lung sharing policies, including the historic local donor service area (DSA) based policy and hypothetical policies that prioritize candidates to donors within 500 mile or 1,000 mile geographic radii. Candidate waitlist mortality, number of transplants, and one-year survival were compared across organ allocation policies. Waitlist mortality rates were further stratified by diagnosis, LAS threshold, ABO blood type, and region.
Results:
Under broader geographic lung sharing the proportion of chronic obstructive pulmonary disease transplant recipients decreased while the proportion of pulmonary fibrosis recipients increased. Waitlist mortality decreased with broader geographic lung sharing with a 21.3% decrease in waitlist mortality with 500 mile lung sharing and a 31.8% decrease in waitlist mortality with 1,000 mile lung sharing. The decrease in waitlist deaths occured across all US geographic regions and was greatest in candidates with pulmonary fibrosis and/or high medical urgency.
Conclusion:
Broader geographic sharing of donor lungs could reduce waitlist mortality, particularly amongst pulmonary fibrosis and high medical urgency candidates.
Introduction
Patients with end-stage lung disease who undergo lung transplant have prolonged survival and improved quality of life. Given that access to transplant is limited by the supply of donor lungs, donor lungs are distributed according to national organ allocation policies.(1) In 2000, the United States Department of Health and Human Services (DHHS) mandated that cadaveric organ allocation within the United States occur by medical urgency while minimizing the effect of geography.(2) The lung allocation score (LAS) was subsequently introduced in May 2005, which changed candidate prioritization for donor lungs from accumulated waitlist time to a numerical score based upon the candidate’s medical urgency and expected benefit.(3) However, this policy change did not address the geographic constraints of donor lung allocation as candidates in the same local area as a donor (donor service area, DSA) continued to receive priority over non-local DSA candidates with greater medical urgency.(4)
While an initial improvement in waiting list mortality was reported after implementation of the LAS, the US waiting list mortality rate has increased since 2007 with studies supporting that local DSA prioritized allocation has contributed to waitlist mortality disparities.(1, 5–7) Despite low waitlist mortality and smaller net survival gains for candidates with low medical urgency, low medical urgency candidates matched to a local DSA donor comprise the majority of lung transplants within the US.(7, 8) This local DSA based prioritization of donors to candidates within the same DSA has resulted in transplantation of less medically urgent candidates within a local DSA while more urgent candidates within a neighboring DSA waited and frequently died.(6) Accordingly, the historic lung allocation policy that prioritizes by DSA rather than by a broader geographic area has been targeted as arbitrary and discriminatory in a lawsuit against the United States DHHS.(9, 10) This lawsuit prompted an emergency review of lung allocation policy and implementation in November 2017 of a new allocation policy adopting a 250 mile radius from donor to candidate as the first sequence of lung allocation. The choice for a 250 mile sharing radius in allocation policy rather than broader sharing within a traditional zone A (500 mile) or zone B (1000 mile) radius has been scrutinized by the lung transplant community.(10) However, broader policy changes to a 500 mile or 1000 mile prioritized policy was deferred pending further examination of the impact of broader geographic lung sharing.(11)
We hypothesize that broader geographic sharing of donor lungs would reduce waitlist mortality and minimize geographic disparities by prioritizing transplant access to candidates with the greatest medical need without undue geographic limitation. We use a discrete event microsimulation model to assess the hypothesis that a lung allocation system that allows broader geographic lung sharing would reduce waitlist mortality. Understanding how potential organ allocation strategies impact waitlist and posttransplant outcomes can inform lung organ allocation policy decisions aimed at prioritizing lung transplant access to candidates with the greatest medical need.
Methods
This study used data from the Scientific Registry of Transplant Recipients (SRTR). The SRTR data system includes data on all donor, waitlisted candidates, and transplant recipients in the United States, submitted by the members of the Organ Procurement and Transplantation Network (OPTN). The Health Resources and Services Administration (HRSA), U.S. Department of Health and Human Services provides oversight to the activities of the OPTN and SRTR contractors.
Lung Allocation Policy Models
Proposed lung allocation policies were evaluated using the Thoracic Simulated Allocation Model (TSAM), a discrete event microsimulation model originally developed by the SRTR and modified for purposes of this study.(12) The allocation rules of the simulated lung allocation policies are described in detail in eMethods and Table E1 in the online data supplement. In brief, we compared local DSA based allocation rules that first prioritize adult donors to adult and adolescent candidates within the same DSA against allocation rules that first prioritize adult donors to all adult and adolescent candidates within 500 or 1000 mile radii. The models allocated adolescent and pediatric donor lungs in broader geographic sharing models according to recently suggested allocation rules for this population.(13) Additional allocation models that prioritized 500 or 1000 mile donor lung sharing only to adult or adolescent candidates with high medical urgency, as defined by a LAS≥50, were performed and compared to the other allocation models within the online data supplement.
Study Population and Microsimulation Model
Candidates on the waitlist and all deceased donors between July 1, 2009 and June 30, 2011 were imputed into the discrete event microsimulation model and maintained in a time-ordered queue that reflected the historical candidates listing date. Donor and candidate matching occurred by the allocation rules specified in eMethods and Table E1 in the online data supplement. Acceptance of donor-candidate matches was based upon a predictive model of historic donor lung acceptance constructed on donor characteristics, recipient-donor match characteristics, and use of a random number generator. A random number was produced between 0 and 1 and compared to the expected probability of lung acceptance, with a lower random number resulting in donor lung acceptance. Candidates who became active on the waitlist had either an actual historic time to death or waitlist removal or for candidates who had historically undergone lung transplant an estimated time to waitlist death or removal was calculated. The time to waitlist death or removal was estimated by matching the candidate to another candidate with similar baseline listing characteristics and a nontransplant removal event. A multivariable cox proportional hazard model was used to estimate one-year post-transplant survival for each transplant candidate. Historical donors within this time period were offered in 10 varying orders, the original order and 9 other random orders to simulate the real-world variation in donor arrival. We performed a total of 100 model simulations, 10 iterations of each of the 10 donor orders, to assess the robustness of each allocation model given the expected real-world variations in donors, organ acceptance, and expected survival.
We calculated candidate waitlist deaths, transplants, and mortality rate for each of the 100 model iterations and reported the median and interquartile range (IQR) of each lung allocation model. We calculated waitlist mortality rate by dividing the number of estimated deaths by the cumulative waitlist time of all candidates. We further stratified waitlist mortality rates by candidate diagnosis, lung allocation score threshold, ABO blood type, and region for each allocation model. We compared expected one-year survival across the allocation models. Similar to previous TSAM methodology, formal testing of the statistical significance between model outcomes was not performed due to the presence of the same candidates within each lung allocation model and within multiple model iterations.(13)
We compared simulated model events to historic waitlist events by computing the actual waitlist mortality rate and transplant recipient characteristics from July 1, 2009 to June 30, 2011 using the SRTR standard analysis files. Actual candidates on the lung transplant waitlist during this period were identified, waitlist time calculated, and their waitlist outcome including death or transplant recorded. We excluded candidates listed for re-transplant or multi-organ transplant.
Results
Recipient characteristics
There were a total of 6,538 candidates actively listed for lung transplant between July 1, 2009 and June 30, 2011. Transplant recipient characteristics by historic cohort and by each simulated allocation model are shown in Table 1 and Table E2. As compared to the DSA based allocation system, allocation models with broader geographic lung sharing had a smaller proportion of chronic obstructive pulmonary disease (Group A) recipients and a larger proportion of pulmonary fibrosis (Group D) recipients. Pulmonary hypertension (Group B) and cystic fibrosis (Group C) recipients increased slightly under overall broader geographic lung sharing. Recipient LAS at transplant and the proportion of recipients hospitalized or on mechanical ventilation or extracorporeal membrane oxygenation life support prior to transplant increased with broader geographic lung sharing. There was an increase in the number of children and adolescents transplanted with broader geographic lung sharing. The distance between the recipient and donor and the proportion of non-local donors increased with broader geographic lung sharing, but less so with broader geographic lung sharing based on LAS threshold (Table E2).
Table 1.
Recipient Characteristics by Historic and Simulated Donor Lung Allocation Models.
| Historic Cohort n = 3,482 |
Donor Service Area Based Lung Sharing n = 347,843* |
500 Mile Lung Sharing n = 350,208* |
1000 Mile Lung Sharing n = 348,060* |
|
|---|---|---|---|---|
| Age, mean (SD) | 53.3 ±15.5 | 53.3 ±15.6 | 52.8 ±16.2 | 52.7 ±16.3 |
| Male Gender | 2,034 (58.4%) | 192,393 (55.3%) | 194,724 (55.6%) |
194,023 (55.5%) |
| Child | 44 (1.3%) | 5,667 (1.6%) | 6,210 (1.8%) | 6,186 (1.8%) |
| Adolescent | 67 (1.9%) | 8568 (2.5%) | 10,769 (3.1%) | 10,850 (3.1%) |
| Adult | 3,371 (96.8%) | 333,608 (95.9%) | 333,229 (95.2%) | 332,844 (95.1%) |
| Race / Ethnicity | ||||
| Non-Hispanic White | 2,903 (83.4%) | 282,940 (82.0%) | 281,202 (80.9%) |
279,162 (80.4%) |
| Non-Hispanic Black | 295 (8.5%) | 34,147 (9.9%) | 34,961 (10.1%) | 35,142 (10.1%) |
| Hispanic | 201 (5.8%) | 21,622 (6.3%) | 24,129 (6.9%) | 24,934 (7.2%) |
| Asian | 52 (1.5%) | 6,526 (1.9%) | 7,255 (2.1%) | 7,867 (2.3%) |
| Lung Disease Type† | ||||
| Group A | 990 (28.5%) | 97,257 (28.0%) | 70,697 (20.2%) | 61,956 (17.7%) |
| Group B | 157 (4.5%) | 16,302 (4.7%) | 19,572 (5.6%) | 19,806 (5.7%) |
| Group C | 458 (13.2%) | 46,421 (13.4%) | 51,206 (14.6%) | 51,804 (14.8%) |
| Group D | 1867 (53.8%) | 182,196 (52.4%) | 202,523 (57.8%) |
210,128 (60.1%) |
| Pre-Transplant Condition | ||||
| Hospitalized | 419 (14.4%) | 39,950 (11.5%) | 45,841 (13.1%) | 48,909 (14.0%) |
| Ventilator Use | 130 (3.7%) | 16273 (4.7%) | 20,189 (5.8%) | 22,314 (6.4%) |
| ECMO use | 22 (0.6%) | 1750 (0.5%) | 2,044 (0.6%) | 2,158 (0.6%) |
| Lung Allocation Score, mean (SD) | 47.7 ±17.9 | 46.8 ±16.5 | 48.9 ±16.3 | 49.9 ±16.4 |
| Geographic Miles between Donor and Recipient, mean (SD) | -- | 202.9 ±276.8 | 321.3 ±251.1 | 542.1 ±302.4 |
| Geographic Zone of Donor and Recipient | ||||
| Local DSA | -- | 208,097 (59.82) | 45,873 (13.10) | 20,696 (5.92) |
| 500 miles | -- | 117,254 (33.71) | 276,258 (78.88) | 133,716 (38.22) |
| 1000 miles | -- | 15,282 (4.39) | 4,892 (1.40) | 189,210 (54.08) |
Represents the total number of recipients from all 100 model iterations
Group A represents candidates with obstructive lung disease, Group B represents candidates with pulmonary vascular disease, Group C represents candidates with cystic fibrosis or bronchiectasis, and Group D represents candidates with pulmonary fibrosis or restrictive lung disease.
Waitlist Deaths and Transplants
The number of waitlist candidate deaths decreased by 20–30% with broader geographic sharing of donor lungs (Table 2). The estimated median number of waitlist deaths was 588 (IQR 581–596) under the DSA-based allocation rules with a 21.3% decrease in waitlist deaths with 500 mile lung sharing (462 deaths, IQR 457–468) and a 31.8% decrease in waitlist deaths with 1000 mile lung sharing (402 deaths, IQR 396–406). As compared to the 500 and 1000 mile lung sharing models, the allocation models allowing 500 mile or 1000 mile lung sharing only within LAS≥50 candidates estimated a comparable decrease in waitlist deaths (Table E3). The median (IQR) number of transplant recipients under DSA-based lung sharing was 3,479 (IQR 3,472–3,487) with a similar number of transplants with broader lung sharing. There were 3,502 recipients (IQR 3,496–3,509) under 500 mile lung sharing and 3,499 recipients (IQR 3,494–3,504) under 1000 mile lung sharing (Table 2).
Table 2.
Waitlist and Transplant Outcomes by Simulated Donor Lung Allocation Models,
| Donor Service Area Based Lung Sharing |
500 Mile Lung Sharing |
1000 Mile Lung Lung Sharing |
|
|---|---|---|---|
| Waitlist Deaths * | 588 (581–596) | 462 (457–468) | 402 (396–406) |
| Relative % change in deaths | Reference | −21.3% | −31.8% |
| Waitlist Mortality Rate† | 17.1 (16.8–17.3) | 12.9 (12.7–13.1) | 11.0 (10.9–11.1) |
| Transplant Recipients* | 3479 (3472–3487) | 3502 (3496–3509) | 3499 (3494–3504) |
| Disease Specific Waitlist | |||
| Mortality Rates†‡ | |||
| Group A | 9.0 (8.7–9.1) | 8.1 (8. 0–8.2) | 7.6 (7. 5–7.8) |
| Group B | 18.6 (18.0–19.2) | 16.7 (16.1–17.1) | 16.5 (16.1–17.0) |
| Group C | 20.7 (19.8–21.3) | 14.6 (14.1–15.6) | 11.9 (11.5–12.4) |
| Group D | 28.8 (28.1–29.5) | 21.1 (20.5–22.0) | 15.9 (15.5–16.4) |
| Lung Allocation Score (LAS) Waitlist Mortality Rates † | |||
| LAS <35 | 8.8 (8.6–8.9) | 8.1 (8.0–8.1) | 7.8 (7.8–7.9) |
| LAS 35–39 | 12.4 (11.9–12.8) | 12.9 (12.6–13.3) | 13.5 (13.2–13.8) |
| LAS 40–49 | 18.7 (18.0–19.3) | 13.4 (12.6–14.1) | 11.0 (10.5–11.5) |
| LAS ≥50 | 93.8 (89.4–98.5) | 77.0 (72.5–80.4) | 51.5 (48.2–54.7) |
| ABO Blood Type Waitlist | |||
| Mortality Rates† | |||
| Blood Type A | 16.5 (16.1–16.9) | 12.0 (11.7–12.3) | 10.0 (9.8–10.2) |
| Blood Type B | 20.9 (20.1–21.7) | 17.1 (16.3–17.9) | 13.5 (12.7–14.1) |
| Blood Type AB | 29.6 (27.8–31.9) | 26.4 (24.7–28.8) | 21.8 (20.4–23.6) |
| Blood Type O | 16.0 (15.7–16.3) | 11.9 (11.8–12.2) | 10.5 (10.3–10.7) |
| Post-Transplant Survival* | |||
| Predicted 30-Day Survival | 95.4% (95.2–95.6%) | 95.2% (95.0–95.4%) | 95.2% (95.0–95.4%) |
| Predicted 1-Year Survival | 82.2% (81.8–82.6%) | 81.4% (81.1–82.0%) | 81.0% (80.6–81.4%) |
Reported as median (Interquartile Range)
Rates reported as median deaths per 100 waitlist years (Interquartile Range)
Group A represents candidates with obstructive lung disease, Group B represents candidates with pulmonary vascular disease, Group C represents candidates with cystic fibrosis or bronchiectasis, and Group D represents candidates with pulmonary fibrosis or restrictive lung disease
Waitlist Mortality Rate
The actual historic waitlist mortality rate from the study period was 16.4 deaths per 100 waitlist years. The estimated waitlist mortality rate under the DSA based allocation rules was 17.1 deaths per 100 waitlist years (IQR 16.8–17.3) with a decrease to 12.9 deaths per 100 waitlist years (IQR 12.7–13.1) with 500 mile lung sharing and 11.0 deaths per 100 waitlist years (IQR 10.9–11.1) with 1000 mile lung sharing (Figure 1). Similarly, there were an estimated 13.0 deaths per 100 waitlist year (IQR 12.8–13.1) with 500 mile lung sharing for LAS≥50 candidates and 11.5 deaths per 100 waitlist years (IQR 11.411.7) with 1000 mile lung sharing for LAS≥50 candidates (Figure E1 of online data supplement).
Figure 1. Waitlist Mortality Rate.
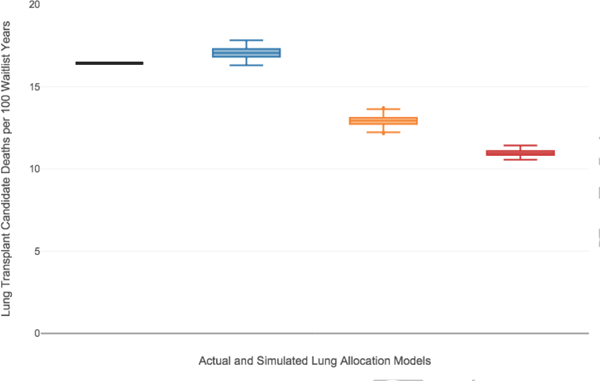
Box and whisker plots of the estimated waitlist mortality rate (deaths per 100 waitlist years) for the DSA based allocation model (blue box plot), 500 mile lung sharing model (orange box plot), and the 1000 mile lung sharing model (red box plot) as compared to the historical waitlist mortality rate (black line). The horizontal line within the box indicates the median, the box signifies the interquartile range (IQR), whiskers identify the lowest and highest data within 1.5 times the IQR, and dots identify any outliers.
The impact of broader geographic sharing of lungs on waitlist mortality varied by a candidate’s lung diagnosis, however as compared to DSA based donor lung sharing, candidates of all disease groups had a decrease in waitlist mortality with broader donor lung sharing (Figure 2, Table 2, Figure E2, Table E3). The greatest difference in waitlist mortality rate was seen within pulmonary fibrosis candidates. The waitlist mortality rate decreased the most in candidates with the greatest medical urgency, as defined by a LAS≥50 (Figure 3, Table 2, Figure E3, Table E3). The waitlist mortality rate decreased across all ABO blood types (Table 2, Table E3). Waitlist mortality rates decreased in all OPTN regions with broader geographic lung sharing (Table E4) with absolute decreases in regional waitlist mortality rates, as compared to the DSA-based allocation policy, of 0.1 to 7.1 deaths per 100 waitlist years with 500 mile lung sharing and of 3.3 to 9.2 deaths per 100 waitlist years with 1000 mile lung sharing (Figure 4).
Figure 2. Waitlist Mortality Rate by Lung Diagnosis.
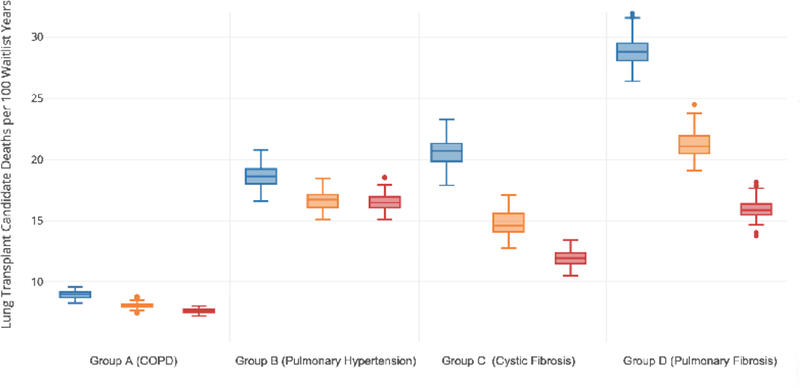
Box and whisker plots of the estimated waitlist mortality rate (deaths per 100 waitlist years) by candidate lung diagnosis for the DSA based allocation model (blue box plot), 500 mile lung sharing model (orange box plot), and the 1000 mile lung sharing model (red box plot). The horizontal line within the box indicates the median, the box signifies the interquartile range (IQR), whiskers identify the lowest and highest data within 1.5 times the IQR, and dots identify any outliers.
Figure 3. Waitlist Mortality Rate by Lung Allocation Score (LAS).
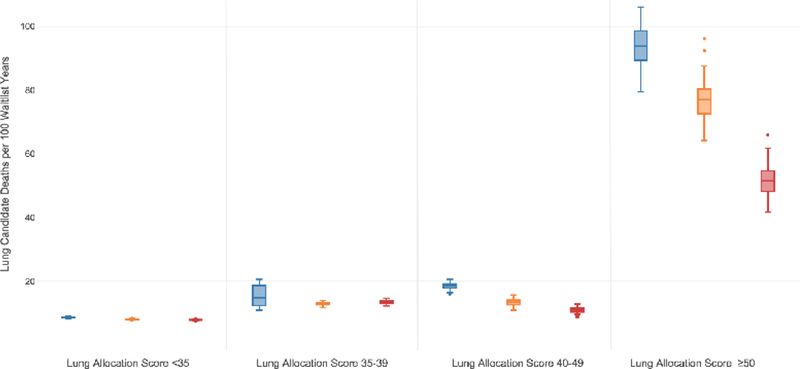
Box and whisker plots of the estimated waitlist mortality rate (deaths per 100 waitlist years) by candidate LAS threshold for the DSA based allocation model (blue box plot), 500 mile lung sharing model (orange box plot), and the 1000 mile lung sharing model (red box plot). The horizontal line within the box indicates the median, the box signifies the interquartile range (IQR), whiskers identify the lowest and highest data within 1.5 times the IQR, and dots identify any outliers.
Figure 4. Waitlist Mortality Rate Change Within Each Organ Procurement and Transplantation Network (OPTN) Region.
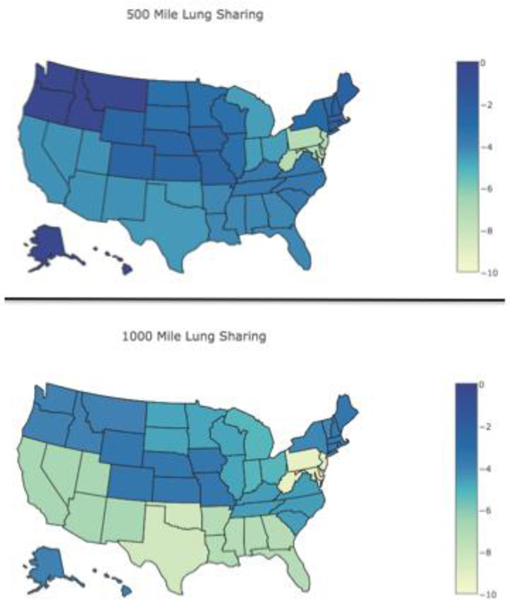
A choropleth map of individual states displays the absolute reduction in waitlist mortality rate (deaths per 100 waitlist years) by OPTN region under each broader geographic sharing model as compared to the local donor service area based model. Individual states were given the overall change seen within their assigned OPTN region.
Post-transplant Survival
There was a slight difference in early and one-year post-transplant survival with broader geographic lung sharing (Table 2). The estimated median (IQR) 30-day survival was 95.4% (95.2–95.6%) under DSA-based allocation rules, 95.2% (95.0–95.4%) under 500 mile lung sharing rules, and 95.2% (95.0–95.4%) under 1000 mile lung sharing rules. The estimated median (IQR) one-year survival was 82.2% (81.8–82.6%) under DSAbased allocation rules, 81.4% (81.1–82.0%) under 500 mile lung sharing rules, and 81.0% (80.6–81.4%) under 1000 mile lung sharing rules. The estimated median (IQR) 30-day and one-year survival under the 500 mile lung sharing for LAS≥50 candidates and 1000 mile lung sharing for LAS≥50 candidates are shown in Table E3.
Discussion
Broader geographic lung sharing could decrease waitlist mortality across all candidate diagnoses and US transplant regions without impacting the number of transplants performed. Broader geographic lung sharing could increase the proportion of pulmonary fibrosis transplant recipients, and reduce the high waitlist mortality rate for candidates with pulmonary fibrosis to a rate similar to other advanced lung disease diagnoses. Patients with a high LAS threshold, which indicates a greater transplant urgency, would receive the greatest reduction in waitlist mortality under broader geographic lung sharing. These finding are in concordance with the DHHS final rule to allocate donor lungs to those of greatest medical urgency while minimizing the effect of geography.(2) Within US solid organ transplant allocation policy, there has been a shift towards broader geographic sharing of donor organs to candidates with greater medical urgency. Liver and heart allocation rules have adopted broader geographic sharing of donor organs to candidates with higher illness severity in attempts to reduce waitlist deaths.(4) A 2006 change in heart allocation policy that involved regional sharing of heart organs to candidates with the greatest level of medical urgency successfully decreased waitlist mortality and resulted in more medically urgent candidates receiving heart transplant without worsening one-year post-transplant survival.(14, 15) In June 2013, the Share 35 policy was implemented for US liver allocation, which broadened donor liver prioritization to all regional candidates with a model for end-stage liver disease (MELD) score of 35 or higher. This policy resulted in decreased waitlist mortality, particularly amongst those with a high MELD score, without changing early post-transplant survival.(16, 17) Similarly, our results suggest that a policy of broader donor lung sharing by any of the simulated models would decrease waitlist mortality, particularly waitlist mortality for candidates with a high LAS.
The arguments against broader lung sharing include the concern for increased lung ischemia time with longer travel distances, increased transplant of more medically urgent patients resulting in worse post-transplant survival, economic implications, and apprehension from community organizations and/or transplant programs regarding its effect on community donation and individual center volume.(18) While the acceptable duration of donor lung ischemia remains controversial, two recent US transplant registry analyses demonstrate no association between prolonged ischemia times, as defined as greater than 6 hours, with primary graft dysfunction or survival, particularly at highvolume centers.(19, 20) The distance between the donor and transplant center increased with modeling broader geographic lung sharing, likely resulting in an increase in ischemia time, however the geographic sharing radii of 500 miles and 1000 miles would allow for generally acceptable ischemia times. Importantly, the lung allocation models that simulated broader lung sharing only for candidates with high medical urgency (LAS≥50) had a less significant impact on travel distance or proportion of imported donors, while having a comparable effect on reducing waitlist mortality.
We demonstrate that broader geographic lung sharing could increase the overall illness severity of lung transplant candidates and may influence one-year post-transplant survival. Given the small magnitude of predicted change in post-transplant survival, the clinical significance of these changes is unclear. Using the model outputs, we performed “back of the envelope” calculations of the number of lives saved on the waiting list and number of lives lost one-year post transplant; these calculations suggest approximately 95 net lives saved under the 500 mile lung sharing models and 130–140 net lives saved under 1000 mile lung sharing models. As these calculations are based on the models prediction of both waitlist deaths and one-year post-transplant deaths, they may be influenced by the model limitations noted below. It is noteworthy that despite an increase in candidate illness severity following a previous revision in lung allocation policy the overall early or one-year post-transplant survival did not change.(21–23) As previous allocation policy changes have been associated with increased posttransplant healthcare resource use, the economic implications of broader geographic lung sharing deserve further attention.(24) These economic analyses should account for the impact of longer travel distances and organ import and export costs in addition to potential cost-savings from reducing the considerable pre-transplant cost of some high illness severity candidates. Modeling of the economic impact of broader liver sharing has suggested overall cost effectiveness, although it did not include increases in import and export organ procurement costs.(25, 26)
Like preceding allocation models, our model has several limitations. The model is built and simulated upon historic lung transplant data from 2009 to 2011, and given continued changes in the lung transplant candidate population, allocation policy changes may have different effects on waitlist candidates and recipients in the present era. For instance, registry reports demonstrate that from 2011 to 2016 the proportion of waitlisted candidates age 65 or older has increased from 17.6% to 23.9% and group D candidates increased from 31.8% to 37.9%.(27) Additionally, there has been a revision to LAS calculation in 2015 which may impact specific diagnosis groups, such as pulmonary hypertension. Secondly, the model does not allow for center-level variation in the likelihood of donor acceptance and recipient survival. It assumes similar lung acceptance thresholds across all transplant centers. Due to this limitation and the relatively small number of candidates at some centers, the model does not reliably measure the individual center-level impact of broader geographic lung sharing. Finally, the TSAM allows for simulation of organ sharing within historical geographic thresholds of 500, 1000, 1500, 2500, and >2500 miles but does not support simulation using smaller geographic distances such as the recently instituted 250 mile threshold. Despite the above model limitations there is a precedent for the use of similar simulated allocation models within liver, kidney, heart, and pediatric lung transplant to guide organ allocation policy decisions.(12) The SRTR liver simulated allocation model has been used to study the effect of geographic re-districting and regional sharing allocation policies on geographic disparity and waitlist mortality within liver transplant.(28, 29) Within pediatric lung transplant, the TSAM was used to simulate different allocation strategies that improve pediatric access to lung transplant.(13)
In conclusion, the lung allocation system that prioritizes lung allocation to a recipient within the same donor service area (DSA) contributes to geographic waitlist disparities and is inconsistent with the DHHS final rule to prioritize donor organs to those of greatest medical urgency while minimizing the effect of geography. Lung allocation policies that allow broader geographic lung sharing would likely decrease waitlist mortality without impacting the number of transplants performed. The reduction in waitlist mortality with broader geographic lung sharing would be seen across the United States and would have the greatest impact on candidates with high medical urgency.
Supplementary Material
Acknowledgments
The data reported here have been supplied by the Minneapolis Medical Research Foundation (MMRF) as the contractor for the Scientific Registry of Transplant Recipients (SRTR). The interpretation and reporting of these data are the responsibility of the author(s) and in no way should be seen as an official policy or interpretation by the SRTR or the U.S. Government.
Grant Support
Dr. Mooney acknowledges support from a KL2 Mentored Career Development Award of the Stanford Clinical and Translational Science Award to Spectrum, NIH KL2 TR 001083. Dr. Bhattacharya acknowledges support from the National Institute of Aging grant P30 AG17253 and R37 AG036791.
Footnotes
Disclosures
The authors of this manuscript have no relevant conflicts of interest to disclose.
Publisher's Disclaimer: This is a PDF file of an unedited manuscript that has been accepted for publication. As a service to our customers we are providing this early version of the manuscript. The manuscript will undergo copyediting, typesetting, and review of the resulting proof before it is published in its final citable form. Please note that during the production process errors may be discovered which could affect the content, and all legal disclaimers that apply to the journal pertain.
References
- 1.Valapour M, Skeans MA, Smith JM, Edwards LB, Cherikh WS, Callahan ER, Israni AK, Snyder JJ, Kasiske BL. Lung. American journal of transplantation : official journal of the American Society of Transplantation and the American Society of Transplant Surgeons 2016; 16 Suppl 2: 141–168. [DOI] [PubMed] [Google Scholar]
- 2.Department of Health and Human Services. Organ Procurement and Transplantation Network; Final Rule. Federal Register 42 CFR, Part 121 1999; 64: 56650–56661. [PubMed] [Google Scholar]
- 3.Egan TM, Murray S, Bustami RT, Shearon TH, McCullough KP, Edwards LB, Coke MA, Garrity ER, Sweet SC, Heiney DA, Grover FL. Development of the new lung allocation system in the United States. American journal of transplantation : official journal of the American Society of Transplantation and the American Society of Transplant Surgeons 2006; 6: 1212–1227. [DOI] [PubMed] [Google Scholar]
- 4.Colvin-Adams M, Valapour M, Hertz M, Heubner B, Paulson K, Dhungel V, Skeans MA, Edwards L, Ghimire V, Waller C, Cherikh WS, Kasiske BL, Snyder JJ, Israni AK. Lung and heart allocation in the United States. American journal of transplantation : official journal of the American Society of Transplantation and the American Society of Transplant Surgeons 2012; 12: 3213–3234. [DOI] [PubMed] [Google Scholar]
- 5.Benvenuto LJ, Anderson DR, Kim HP, Hook JL, Shah L, Robbins HY, D’Ovidio F, Bacchetta M, Sonett JR, Arcasoy SM. Geographic disparities in donor lung supply and lung transplant waitlist outcomes: A Cohort Study. American journal of transplantation : official journal of the American Society of Transplantation and the American Society of Transplant Surgeons 2017. [DOI] [PubMed] [Google Scholar]
- 6.Russo MJ, Meltzer D, Merlo A, Johnson E, Shariati NM, Sonett JR, Gibbons R. Local allocation of lung donors results in transplanting lungs in lower priority transplant recipients. The Annals of thoracic surgery 2013; 95: 1231–1234; discussion 1234–1235. [DOI] [PubMed] [Google Scholar]
- 7.Iribarne A, Meltzer DO, Chauhan D, Sonett JR, Gibbons RD, Vigneswaran W, Russo MJ. Distribution of Donor Lungs in the United States: A Case for Broader Geographic Sharing. Clinical transplantation 2016. [DOI] [PubMed] [Google Scholar]
- 8.Russo MJ, Worku B, Iribarne A, Hong KN, Yang JA, Vigneswaran W, Sonett JR. Does lung allocation score maximize survival benefit from lung transplantation? The Journal of thoracic and cardiovascular surgery 2011; 141: 1270–1277. [DOI] [PubMed] [Google Scholar]
- 9.HHS Adopts New Transplant Policy After Patient Desperate for Lung Sues. 2017 December 4, 2017]. Available from: https://www.law.com/newyorklawjournal/sites/newyorklawjournal/2017/11/29/hhsadopts-new-transplant-policy-after-patient-desperate-for-lung-sues/.
- 10.Egan TM. From 6 years to 5 days for organ allocation policy change. The Journal of Heart and Lung Transplantation 2018; 37: 675–677. [DOI] [PubMed] [Google Scholar]
- 11.Organ Procurement and Transplantation Network (OPTN) Executive Committee. Broader Sharing of Adult Donor Lungs. [cited 2017 December 4, 2017]. Available from: https://optn.transplant.hrsa.gov/media/2314/broader_sharing_lungs_20171124.pdf.
- 12.Thompson D, Waisanen L, Wolfe R, Merion RM, McCullough K, Rodgers A. Simulating the Allocation of Organs for Transplantation. Health Care Management Science 2004; 7: 331–338. [DOI] [PubMed] [Google Scholar]
- 13.Tsuang WM, Chan KM, Skeans MA, Pyke J, Hertz MI, Israni AJ, Robbins-Callahan L, Visner G, Wang X, Wozniak TC, Valapour M. Broader Geographic Sharing of Pediatric Donor Lungs Improves Pediatric Access to Transplant. American journal of transplantation : official journal of the American Society of Transplantation and the American Society of Transplant Surgeons 2016; 16: 930–937. [DOI] [PubMed] [Google Scholar]
- 14.Schulze PC, Kitada S, Clerkin K, Jin Z, Mancini DM. Regional differences in recipient waitlist time and pre- and post-transplant mortality after the 2006 United Network for Organ Sharing policy changes in the donor heart allocation algorithm. JACC Heart Fail 2014; 2: 166–177. [DOI] [PMC free article] [PubMed] [Google Scholar]
- 15.Singh TP, Almond CS, Taylor DO, Graham DA. Decline in heart transplant wait list mortality in the United States following broader regional sharing of donor hearts. Circ Heart Fail 2012; 5: 249–258. [DOI] [PubMed] [Google Scholar]
- 16.Massie AB, Chow EKH, Wickliffe CE, Luo X, Gentry SE, Mulligan DC, Segev DL. Early Changes in Liver Distribution Following Implementation of Share 35. American Journal of Transplantation 2015; 15: 659–667. [DOI] [PMC free article] [PubMed] [Google Scholar]
- 17.Edwards EB, Harper AM, Hirose R, Mulligan DC. The impact of broader regional sharing of livers: 2-year results of “Share 35”. Liver transplantation : official publication of the American Association for the Study of Liver Diseases and the International Liver Transplantation Society 2016; 22: 399–409. [DOI] [PubMed] [Google Scholar]
- 18.Ubel PA. Transplantation Traffic — Geography as Destiny for Transplant Candidates. New England Journal of Medicine 2014; 371: 2450–2452. [DOI] [PubMed] [Google Scholar]
- 19.Grimm JC, Valero V 3rd, Kilic A, Magruder JT, Merlo CA, Shah PD, Shah AS. Association Between Prolonged Graft Ischemia and Primary Graft Failure or Survival Following Lung Transplantation. JAMA surgery 2015; 150: 547–553. [DOI] [PubMed] [Google Scholar]
- 20.Hayes D Jr., Hartwig MG, Tobias JD, Tumin D. Lung Transplant Center Volume Ameliorates Adverse Influence of Prolonged Ischemic Time on Mortality. American journal of transplantation : official journal of the American Society of Transplantation and the American Society of Transplant Surgeons 2017; 17: 218–226. [DOI] [PMC free article] [PubMed] [Google Scholar]
- 21.McCue JD, Mooney J, Quail J, Arrington A, Herrington C, Dahlberg PS. Ninety-day mortality and major complications are not affected by use of lung allocation score. The Journal of heart and lung transplantation : the official publication of the International Society for Heart Transplantation 2008; 27: 192–196. [DOI] [PubMed] [Google Scholar]
- 22.Merlo CA, Weiss ES, Orens JB, Borja MC, Diener-West M, Conte JV, Shah AS. Impact of U.S. Lung Allocation Score on survival after lung transplantation. The Journal of heart and lung transplantation : the official publication of the International Society for Heart Transplantation 2009; 28: 769–775. [DOI] [PubMed] [Google Scholar]
- 23.Maxwell BG, Levitt JE, Goldstein BA, Mooney JJ, Nicolls MR, Zamora M, Valentine V, Weill D, Dhillon GS. Impact of the lung allocation score on survival beyond 1 year. American journal of transplantation : official journal of the American Society of Transplantation and the American Society of Transplant Surgeons 2014; 14: 2288–2294. [DOI] [PMC free article] [PubMed] [Google Scholar]
- 24.Maxwell BG, Mooney JJ, Lee PH, Levitt JE, Chhatwani L, Nicolls MR, Zamora MR, Valentine V, Weill D, Dhillon GS. Increased Resource Utilization in Lung Transplant Admissions in the Lung Allocation Score Era. American journal of respiratory and critical care medicine 2014. [DOI] [PMC free article] [PubMed] [Google Scholar]
- 25.Fernandez H, Weber J, Barnes K, Wright L, Levy M. Financial Impact of Liver Sharing and Organ Procurement Organizations’ Experience With Share 35: Implications for National Broader Sharing. American journal of transplantation : official journal of the American Society of Transplantation and the American Society of Transplant Surgeons 2016; 16: 287–291. [DOI] [PubMed] [Google Scholar]
- 26.Axelrod DA, Gheorghian A, Schnitzler MA, Dzebisashvili N, Salvalaggio PR, TuttleNewhall J, Segev DL, Gentry S, Hohmann S, Merion RM, Lentine KL. The economic implications of broader sharing of liver allografts. American journal of transplantation : official journal of the American Society of Transplantation and the American Society of Transplant Surgeons 2011; 11: 798–807. [DOI] [PubMed] [Google Scholar]
- 27.Valapour M, Lehr CJ, Skeans MA, Smith JM, Carrico R, Uccellini K, Lehman R, Robinson A, Israni AK, Snyder JJ, Kasiske BL. OPTN/SRTR 2016 Annual Data Report: Lung. American Journal of Transplantation 2018; 18: 363–433. [DOI] [PubMed] [Google Scholar]
- 28.Gentry SE, Chow EK, Dzebisashvili N, Schnitzler MA, Lentine KL, Wickliffe CE, Shteyn E, Pyke J, Israni A, Kasiske B, Segev DL, Axelrod DA. The Impact of Redistricting Proposals on Health Care Expenditures for Liver Transplant Candidates and Recipients. American journal of transplantation : official journal of the American Society of Transplantation and the American Society of Transplant Surgeons 2016. [DOI] [PMC free article] [PubMed] [Google Scholar]
- 29.Washburn K, Pomfret E, Roberts J. Liver allocation and distribution: possible next steps. Liver transplantation : official publication of the American Association for the Study of Liver Diseases and the International Liver Transplantation Society 2011; 17: 1005–1012. [DOI] [PubMed] [Google Scholar]
Associated Data
This section collects any data citations, data availability statements, or supplementary materials included in this article.