

Abstract
Bicycle lanes reduce real and perceived risks for bicycle vs. motor vehicle crashes, reducing the burden of traffic injuries and contributing to greater cycling participation. Previous research indicates that the effectiveness of bicycle lanes differs according to roadway characteristics, and that bicycle lane types are differentially associated with reduced crash risks. The aim of this study is to combine these perspectives and identify the types of on-road bicycle lanes that are associated with the greatest reductions in bicycle crashes given the presence of specific roadway characteristics. We compiled a cross sectional spatial dataset consisting of 32,444 intersection polygons and 57,285 street segment polygons representing the roadway network for inner Melbourne, Australia. The dependent measure was a dichotomous indicator for any bicycle crash (2014-2017). Independent measures were bicycle lanes (exclusive bicycle lanes, shared bicycle and parking lanes, marked wide kerbside lanes, and kerbside bicycle lanes) and other roadway characteristics (speed limit, bus routes, tram routes, bridges, one-way flow, traffic lane width). In Bayesian conditional autoregressive logit models, bicycle lanes of all types were associated with decreased crash odds where speeds were greater, bus routes and tram stops were present, and traffic lanes were narrower. Only exclusive bicycle lanes were associated with reduced crash odds (compared to the expected odds given the presence of the bicycle lane and the roadway conditions) in all these setting. The extent to which on-road bicycle lanes reduce crash risks depends on the bicycle lane type, the roadway conditions, and the combination of these two factors. Bicycle lanes that provide greater separation between cyclists and vehicular traffic are most consistently protective.
Keywords: bicycle, bicycle lane, crash, built environment, spatial analysis, Bayesian
1. INTRODUCTION
Bicycle travel has myriad benefits for individual cyclists and for the broader population (Teschke et al., 2012). Cyclists benefit from improved mental health, improved metabolic and physical functioning, and decreased risks for obesity and resultant problems (de Hartog et al., 2010; Gotschi et al., 2016; Hamer and Chida, 2008). Communities benefit from less air and noise pollution, less traffic congestion, and fewer public health costs associated with residents’ physical inactivity (Katzmarzyk and Janssen, 2004; Ming Wen and Rissel, 2008). Many municipalities therefore promote bicycle use as a mode of transport (City of Helsinki Traffic Planning Division, 2015; Gotschi et al., 2016). Nevertheless, perceived risks for crashing with a motor vehicle is a considerable barrier to increased participation (Apasnore et al., 2017; Fishman et al., 2012) and cycling rates remain low in many countries (Teschke et al., 2012). Bicycle transit facilities are an effective, low-cost solution that can reduce crash incidence, improve perceived safety, and lead to increases in bicycle travel (Buehler and Dill, 2016; Gu et al., 2017).
Bicycle facilities are commonly classified into 3 groups: bicycle paths, which follow different routes to roadways and are exclusively for bicycle and pedestrian use; bicycle tracks, which are adjacent to roadways, are physically separated from vehicular traffic (e.g. by bollards, median strips), and are exclusively for bicycle use; and bicycle lanes, which are on-road space intended for bicycle use and indicated by painted markings (Schepers et al., 2011). Bicycle lanes are the commonest bicycle facility in many cities (Alliance for Biking and Walking, 2016) because bicycle paths and bicycle tracks are often impractical in dense urban settings due to land scarcity. Few experimental studies have considered the effects of bicycle facilities on bicycle vs. motor vehicle crashes (hereafter “bicycle crashes”) (Mulvaney et al., 2015), however evidence from observational ecological studies suggests all 3 bicycle facilities are protective for cyclists. Bicycle paths and bicycle tracks are associated with the most substantial benefits (Kaplan and Giacomo Prato, 2015; Lusk et al., 2011; Schepers et al., 2011; Wall et al., 2016) and are most attractive to cyclists (Schepers et al., 2017), but bicycle lanes also have a significant public health impact (Hamann and Peek-Asa, 2013; Marqués and Hernândez-Herrador, 2017). Individual-level analyses find crash risks for cyclists are up to 25% lower on roadway segments with bicycle lanes compared to those without (Lusk et al., 2011; Wall et al., 2016).
A recent systematic review emphasizes two critical findings regarding bicycle lanes and bicycle crashes (Thomas and DeRobertis, 2013). First, bicycle lanes can have many different configurations, and these configurations are not equally beneficial. For example, “sharrows” (painted arrows indicating shared bicycle and motor vehicle use) are less effective than bicycle lanes marked with painted lines (Wall et al., 2016). Second, the effectiveness of bicycle lanes differs according to other roadway conditions. For example, bicycle lanes offer greater protection where there is a greater speed differential between cyclists and motor vehicles (Kaplan and Giacomo Prato, 2015). It follows that different bicycle lane types will be differentially associated with bicycle crash risks in different roadway conditions. Some configurations may be well suited to certain roadway conditions, but poorly suited to others. This is an important research question because, although the relative risks for bicycle crashes are lower in bicycle lanes, the large volume of cyclists who use these lanes means the absolute burden of bicycle crashes within bicycle lanes remains high. In our region of Melbourne, Australia, nearly 25% of on-road crashes occur in bicycle lanes (Beck et al., 2017), and other studies find bicycle crash injuries that occur within bicycle lanes are more severe than those that occur in other roadway sections (Wall et al., 2016).
The aim of this study is to identify the bicycle lane types that are associated with the greatest reductions in bicycle crashes given the presence of specific roadway characteristics. Our study location is Melbourne, which has a wide range of bicycle lane types and where mortality and hospitalization due to major injury for bicycle crashes increased 8% per year from 2007-2015 (Beck et al., 2017). An essential methodological consideration for studies of bicycle lanes and bicycle crashes is that the volume of bicycle traffic through roadway sections is often unknown (DiGioia et al., 2017), yet this exposure drives much of the observed variation in crash incidence. Bicycle volume data were not available for Melbourne; however, we addressed this denominator problem by using interaction terms in regression analyses, an approach we have previously implemented in Philadelphia, PA (Kondo et al., 2018).
2. MATERIAL AND METHODS
2.1. Study Sample
The study region was 13 contiguous Local Government Areas in inner metropolitan Melbourne in the Australian state of Victoria (Figure 1). The region includes a land area of 544.9 km2, a 2016 population of 1.6 million (26.2% of the state total), 393.8 kilometres (18.1%) of bicycle lanes, and 3,765 (64.7%) bicycle crashes from 2014 to 2017. The spatial units of analysis were polygons representing sections of the roadway network within the study region. A street centerline file from March 2017, accessed from the Victorian Department of Environment, Land, Water and Planning, classifies roadway sections according to class codes. We excluded freeways (class code = 0), exclusive pedestrian paths (class code = 11), and exclusive bicycle paths (class code = 12) because bicycles and/or motor vehicles are excluded from these roadway sections. For the remaining roadway sections, we specified the points at which any two or more roadways met as intersections (nodes), and the street segments that connected them as links. Taking a 5 metre buffer around the links and a 7.2 metre circular buffer (the hypotenuse) around the nodes produced a polygon file composed of 87,729 spatial units, including 32,444 intersections and 57,285 street segments (Figure 2). Buffered links were clipped using the buffered nodes, such that the polygon file was contiguous and the polygons did not overlap. We selected these buffer sizes based on visual inspection compared to satellite photographs as the best uniform buffer sizes to represent the Melbourne roadway. We emphasize that the crash and roadway characteristics were snapped to street centerlines, so the size of the polygon buffers did not materially affect the analyses.
Figure 1.
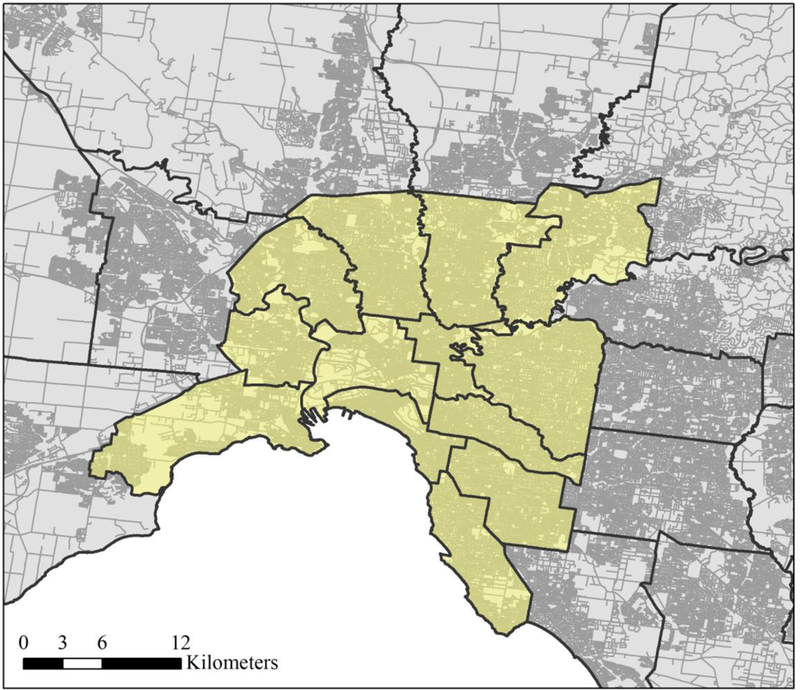
Study region
Figure 2.
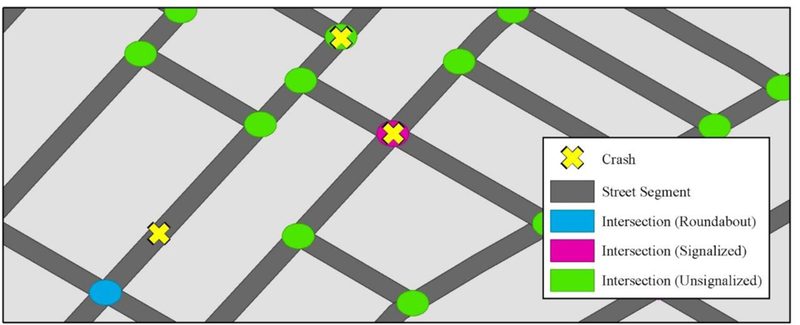
Spatial structure
2.2. Data
Data for this study was sourced through the open data websites for VicRoads (the statutory road and traffic authority for Victoria) and the Victorian Department of Environment, Land, Water and Planning. Crashes occurring between 2014 and 2017 were included when 1) a bicycle crashed with a vehicle, 2) the crash was reported to police, and 3) any person was injured requiring medical treatment.
VicRoads geocodes crashes to intersections where police reports indicate the crash occurred at an intersection, and otherwise to a point location along the street center line file (Figure 2). Because there were very few spatial units with multiple crashes (n = 324 [0.4%]), we calculated a dichotomous measure indicating the presence or absence of any crash.
The primary independent measure was a dichotomous indicator for the presence of any bicycle lane. Using a VicRoads line file representing the state’s primary bicycle network, we selected all on-road bicycle lanes (i.e. excluding bicycle paths and bicycle tracks). We spatially joined the selected lanes to the roadway sections to identify the intersections in which any adjacent street had a bicycle lane, and street segments in which there was at least 1 bicycle lane. Bicycle lanes in Melbourne do not continue through intersections. Bicycle lanes were categorized according to VicRoads’ taxonomy (Figure 3). Exclusive bicycle lanes (OBL) are dedicated on-road lanes for cyclists and are typically placed on the far side of a section for parked motor vehicles. Shared bicycle and parking lanes (SBL) are a separated on-road cycling lane in which motorists can also park their vehicle. Marked wide kerbside lanes (MKL) are lanes that can be used by both motorists and cyclists and are commonly advisory-only lanes, rather than a dedicated space for cyclists. Kerbside bicycle lanes (KBL) are dedicated on-road lanes for cyclists that are located adjacent to the kerb, but, in some cases, motor vehicles may be allowed to park in these lanes (VicRoads, 2016). To allow for locations where there were multiple bicycle lane types within a spatial unit (i.e. of different types entering an intersection, or on either side of a street segment), the roadway type variables were not mutually exclusive. Note that vehicles drive on the left in Australia.
Figure 3.
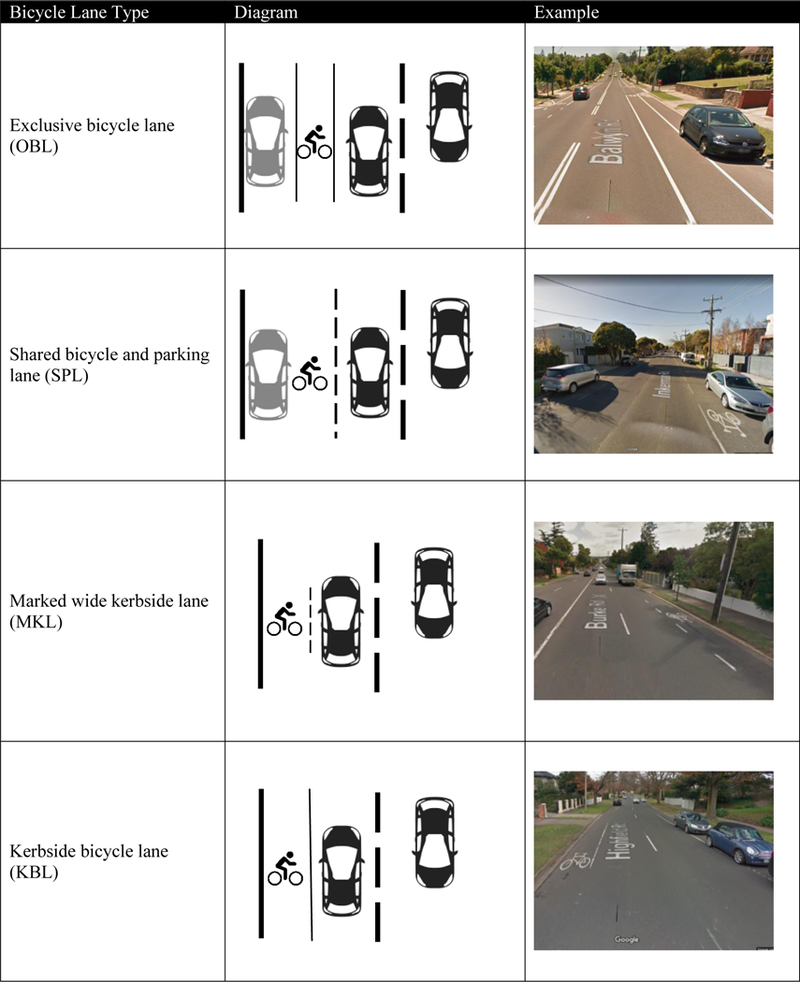
Bicycle lane types Nb. Grey vehicle images denote parked vehicles; black vehicle image denotes moving vehicles. Travel on Australian roads in on the left side of the road. Vehicle images retrieved from iconfinder.com (Stawarz, n.d.). Street images retrieved from Google Streetview.
We further characterized roadway sections using binary indicators for characteristics that may affect relationships between bicycle lanes and bicycle crashes (Figure 4). Intersections were categorized according to their type (roundabout, signalized, and other) and the maximum signed speed limit through the intersection (< 50 kilometres per hour [km/h], 50 km/h, 60 km/h, and > 60 km/h), converted to dummy variables. Dichotomous measures also identified whether bus routes or tram routes traversed the intersections. Street segments were characterized according to traffic flow (one way vs. dual carriageway), bridge crossings, or the presence of a pedestrian crossing. Bus and tram routes on street segments were also identified using dichotomous indicators, and bus and tram stops along those routes were identified with separate dichotomous indicators, such that bus and tram stops were a subset of bus and tram routes. Roadway width and number of traffic lanes were available for 8,254 street segments, including 2,320 (49.7%) segments with bicycle lanes. Because roadway width and the number of traffic lanes were highly correlated with signed speed limits (r > 0.9), we calculated the roadway seal width per traffic lane. Missing roadway width data were mostly for collector roads (class code 4: 10.0%) and local roads (class code 5: 82.9%). We imputed mean values for these street segments. Finally, dummy variables assessed the signed speed through the street segments within the same categories used for intersections. Supplementary Table S1 and S2 are matrices of tetrachoric correlations stratified by intersections and street segments. No two independent measures were correlated at r > 0.7, which is commonly used as a threshold for unacceptable collinearity in ecological studies (Dormann et al., 2012).
Figure 4.
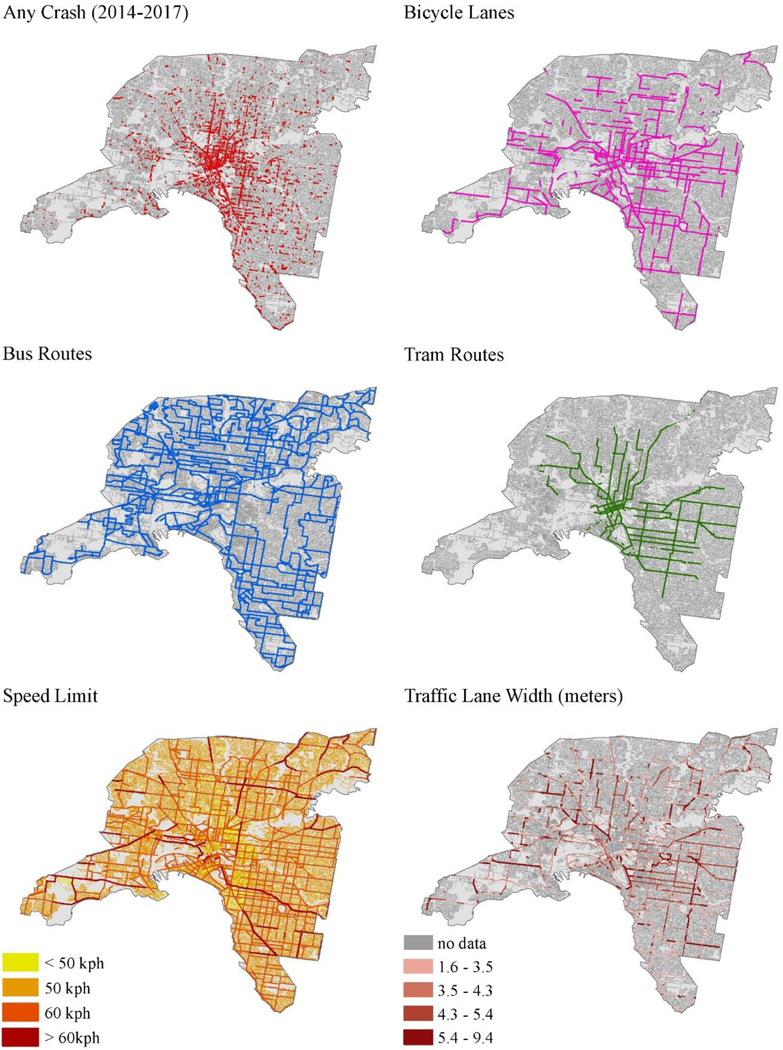
Characteristics of roadway segments in 13 inner Melbourne LGAs; n = 89,729
2.3. Statistical Analysis
We used Bayesian conditional autoregressive logit models to estimate the odds of observing a crash within the 89,729 spatial units according to the presence of bicycle lanes and the other roadway characteristics. Models were specified as:
where πi is the probability of observing a crash within spatial unit i, and X’ is a matrix of independent variables, excluding bicycle lanes. The coefficient β1 is a vector of independent coefficients estimating the relationship (slope) between independent variables X’ and crashes, β2 is a fixed effect estimating the relationship between bicycle lanes and crashes, and β3 is an interaction term estimating the change in the predicted odds in addition to the effect of independent variables X’ and bicycle lanes. By this approach, β1and β2 address the unknown denominator problem by estimating the expected risk given the independent associations between crashes and roadway characteristic X and bicycle lanes, leaving β3 to estimate the additional observed risk or benefit given both the presence of a bicycle lane and characteristic X. We interpret exp(β3) < 0 as evidence that bicycle lanes are associated with fewer crashes compared to the expected incidence given the presence of a both a bicycle lane and characteristic X.
The parameter α is an intercept term, and θi is a random effect that estimates the spatially unstructured error and accounts for over-dispersion of the dependent variable. A conditional autoregressive (CAR) random effect, φi, captures the spatially structured error. This CAR term controls for the loss of unit independence due to spatial autocorrelation, and addresses the small area problem by borrowing strength from adjacent polygons (Lord et al., 2005; Waller and Gotway, 2004). We used an adjacency matrix for queens contiguity based on the polygon file representing the roadway segments and intersections. Models were estimated using WinBUGS v1.4.3 (Lunn et al., 2000). We specified non-informative priors for two chains, which returns similar point estimates to comparable frequentist methods but the Bayesian framework provides a more statistically efficient approach to fitting the conditional autoregressive term (Waller and Gotway, 2004). We allowed the models to burn in over 150,000 Markov Chain Monte Carlo iterations, before sampling a further 50,000 iterations to obtain posterior estimates.
We specified two versions of the Bayesian spatial model. The first (Model 1) used all bicycle lanes combined, and the second (Model 2) disaggregated by bicycle lane type. To avoid problems related to small numbers, and in the interest of parsimony, Model 2 included only the roadway characteristics for which the interaction terms were associated with crashes in Model 1. We also further simplified the speed limit variables to < 60 km/h and ≥ 60 km/h. Due to concerns about missing data we conducted a sensitivity analysis in which we omitted the traffic lane width variable and specified a non-spatial model in which roadway segments with missing traffic lane width data were omitted.
3. RESULTS
There were 3,749 bicycle vs. motor vehicle crashes that occurred in the 13 selected Local Government Areas between 2014-2017. Eleven (0.3%) were fatalities, and 1,408 (37.6%) were geocoded to street segments rather than intersections, including 614 (16.4%) that were on street segments with bicycle lanes (Table 1). Aggregating within 89,729 roadway segments, the included crashes occurred on 2,611 (2.9%) of these spatial units, including on 1,578 of 32,444 (4.9%) intersections and 1,033 of 57,285 (1.8%) street segments. Table 2 presents further descriptive statistics for dichotomous variables describing intersections and street segments. Bicycle lanes were present in 8,797 (9.8%) roadway sections, including 4,133 (12.7%) intersections and 4,664 (8.1%) street segments. Exclusive bicycle lanes (OBL) were the commonest lane type, followed by shared bicycle and parking lanes (SPL) and kerbside bicycle lanes (KBL). There were 307 (0.9%) intersections and 547 (0.9%) street segments that had bicycle lanes, but the bicycle lane type was not indicated. Mean seal width per traffic lane was 4.0 metres (SD = 0.9), and mean segment length was 70.3 metres (SD = 87.9).
Table 1.
Descriptive statistics for bicycle crashes occurring in 13 Local Government Areas, inner Melbourne; 2014-2017 (n = 3,749)
| Variable | n | % | |
|---|---|---|---|
| Fatality | 11 | 0.3% | |
| Day of Week | |||
| Monday | 541 | 14.4% | |
| Tuesday | 635 | 16.9% | |
| Wednesday | 679 | 18.1% | |
| Thursday | 652 | 17.4% | |
| Friday | 578 | 15.4% | |
| Saturday | 383 | 10.2% | |
| Sunday | 281 | 7.5% | |
| Time of Day | |||
| 5am-12:59pm | 1,661 | 44.3% | |
| 1pm-8:59pm | 1,748 | 46.6% | |
| 9pm-4:59am | 340 | 9.1% | |
| Intersections (nodes) | 2,341 | 62.4% | |
| Bike lane (in any adjacent street) | 1,211 | 32.3% | |
| Street segments (links) | 1,408 | 37.6% | |
| Bike lane | 614 | 16.4% | |
Table 2.
Frequencies for dichotomous variables describing characteristics of intersections (nodes) and street segments (links); 13 Local Government Areas, inner Melbourne (n = 89,729)
| Variable | n | % | |
|---|---|---|---|
| Outcomes | |||
| Any crash (2014-2017) | 2,611 | 2.9% | |
| Intersections (nodes) | 32,444 | 36.2% | |
| Roundabout | 1,037 | 1.2% | |
| Signalized | 1,577 | 1.8% | |
| Unsignalized | 29,849 | 33.3% | |
| Signed speed (maximum signed speed in cross street) | |||
| < 50 km/h | 1,357 | 1.5% | |
| 50 km/h | 21,354 | 23.8% | |
| 60 km/h | 8,313 | 9.3% | |
| > 60 km/h | 1,420 | 1.6% | |
| Bike lane (in any adjacent street) | 4,133 | 12.7% | |
| Exclusive bicycle lane (OBL) | 1,728 | 5.3% | |
| Shared bicycle and parking lane (SPL) | 1,206 | 3.7% | |
| Marked wide kerbside lane (MKL) | 616 | 1.9% | |
| Kerbside lane (KBL) | 700 | 2.2% | |
| Other bicycle lane | 307 | 0.9% | |
| Street segments (links) | 57,285 | 63.8% | |
| Bridge | 698 | 0.8% | |
| One way | 4,693 | 5.2% | |
| Bus route | 15,976 | 17.8% | |
| Bus stop | 3,595 | 4.0% | |
| Tram route | 3,774 | 4.2% | |
| Tram stop | 1,120 | 1.2% | |
| Signed speed | |||
| < 50 km/h | 5,863 | 6.5% | |
| 50 km/h | 39,406 | 43.9% | |
| 60 km/h | 10,238 | 11.4% | |
| > 60 km/h | 1,778 | 2.0% | |
| Pedestrian crossing | 982 | 1.1% | |
| Bike lane | 4,664 | 8.1% | |
| Exclusive bicycle lane (OBL) | 1,744 | 3.0% | |
| Shared bicycle and parking lane (SPL) | 1,174 | 2.0% | |
| Marked wide kerbside lane (MKL) | 646 | 1.1% | |
| Kerbside lane (KBL) | 772 | 1.3% | |
| Other bicycle lane | 547 | 1.0% | |
Table 3 shows the results of the Bayesian conditional autoregressive logit model relating all bicycle lanes and the roadway characteristics to bicycle crashes (Model 1). The fixed effects indicate that the crash odds were 3.7 times greater on intersections than street segments (odds ratio [OR] = 3.7, 95% credible interval [CrI]: 2.6, 5.2), and 5.3 times greater on roadway sections with bicycle lanes compared to roadway sections without bicycle lanes (OR = 5.3; 95%CrI: 3.1, 8.8). The interaction terms indicate that bicycle lanes were associated with fewer crashes at intersections with maximum speeds of 60 km/h (OR = 0.3; 95%CrI: 0.2, 0.5) and > 60 km/h (OR = 0.3; 95%CrI: 0.2, 0.7). On street segments, bicycle lanes were associated with fewer crashes on segments with bus routes (OR = 0.5; 95%CrI: 0.4, 0.7), tram stops (OR = 0.7; 95%CrI: 0.4, 1.0), and speed limits of 60 km/h (OR = 0.3; 95%CrI: 0.2, 0.5), and speed limits > 60 km/h (OR = 0.4; 95%CrI: 021, 0.8). Traffic lane width was positively associated with crash odds (OR = 1.2; 95%CrI: 1.1, 1.3), indicating that bicycle lanes were more beneficial where traffic lanes are narrower.
Table 3.
Bayesian conditional autoregressive logit model for presence of bicycle crashes in intersections and street segments, 13 inner Melbourne LGAs; n = 89,729.
| Fixed Effects | Interaction * Bike Lane | |||
|---|---|---|---|---|
| OR | (95% CrI) | OR | (95% CrI) | |
| Intersections (nodes) | ||||
| Intersection | 3.721 | (2.604, 5.270) | 1.119 | (0.59, 62.083) |
| Type | ||||
| Roundabout | 13.423 | (10.559, 17.030) | 0.667 | (0.392, 1.132) |
| Signalized | 3.222 | (2.501, 4.112) | 0.853 | (0.605, 1.202) |
| Unsignalized [ref] | ||||
| Signed speed (maximum signed speed in cross street) | ||||
| < 50 km/h [ref] | ||||
| 50 km/h | 0.609 | (0.451, 0.830) | 0.688 | (0.338, 1.411) |
| 60 km/h | 2.031 | (1.478, 2.801) | 0.316 | (0.190, 0.530) |
| > 60 km/h | 1.687 | (1.099, 2.586) | 0.398 | (0.187, 0.840) |
| Bus route | 1.050 | (0.794, 1.392) | 0.971 | (0.623, 1.498) |
| Tram route | 0.793 | (0.564, 1.105) | 1.024 | (0.633, 1.639) |
| Street Segments (links) | ||||
| Bridge | 1.276 | (0.636, 2.321) | 0.660 | (0.257, 1.697) |
| One way | 0.486 | (0.357, 0.653) | 1.328 | (0.682, 2.453) |
| Bus route | 2.406 | (1.908, 3.028) | 0.494 | (0.344, 0.711) |
| Bus stop | 1.069 | (0.800, 1.427) | 0.999 | (0.624, 1.588) |
| Tram route | 4.238 | (3.180, 5.624) | 0.686 | (0.459, 1.039) |
| Tram stop | 6.666 | (4.988, 8.864) | 0.591 | (0.382, 0.912) |
| Length (100m) | 1.883 | (1.768, 2.005) | ||
| Signed speed | ||||
| < 50 km/h [ref] | ||||
| 50 km/h | 0.409 | (0.313, 0.535) | 1.163 | (0.697, 1.937) |
| 60 km/h | 2.522 | (1.935, 3.310) | 0.261 | (0.170, 0.398) |
| > 60 km/h | 2.697 | (1.715, 4.145) | 0.175 | (0.058, 0.470) |
| Pedestrian crossing | 1.469 | (1.023, 2.064) | 0.972 | (0.583, 1.638) |
| Roadway width per traffic lane | 0.954 | (0.823, 1.092) | 1.159 | (1.068, 1.261) |
| Bike lane | 5.307 | (3.099, 8.820) | ||
Nb. Bolded estimates do not include a credible interval of OR = 1.000
Supplementary Table S3 presents the results for Model 2, and Figure 5 presents only the parameter estimates for the interaction terms. At intersections with maximum speeds ≥ 60km/h, the shared bicycle and parking lanes (SPL) were associated with the greatest reduction in crash odds (OR = 0.2; 95%CrI: 0.1, 0.3), and the marked wide kerbside lanes (MKL; OR = 0.2; 95%CrI: 0.1, 0.4) and exclusive bicycle lanes (OBL; OR = 0.5; 95%CrI: 0.4, 0.7) were also associated with fewer crashes, but kerbside bicycle lanes (KBL; OR = 1.4; 95%CrI: 0.7, 2.5) were not associated with any detectable change in crash odds. On street segments containing bus routes, the four bicycle lane types were associated with comparably fewer crashes, but on street segments containing tram stops only the OBL, MKL and KBL lane types were associated with fewer crashes. Results for the speed limits within street segments are very similar to the results for speed limits within intersections, in that the SPL lanes were associated with the greatest reduction in crash odds, and the MKL and OBL lanes also conferred benefits, but the KBL lane type was not associated with a change in crash odds. Regarding traffic lane width, OBL lanes located on segments with narrower lanes were associated with fewer crashes (OR = 1.4; 95%CrI: 1.1, 1.9), but there was no detectable association for other lane types.
Figure 5.
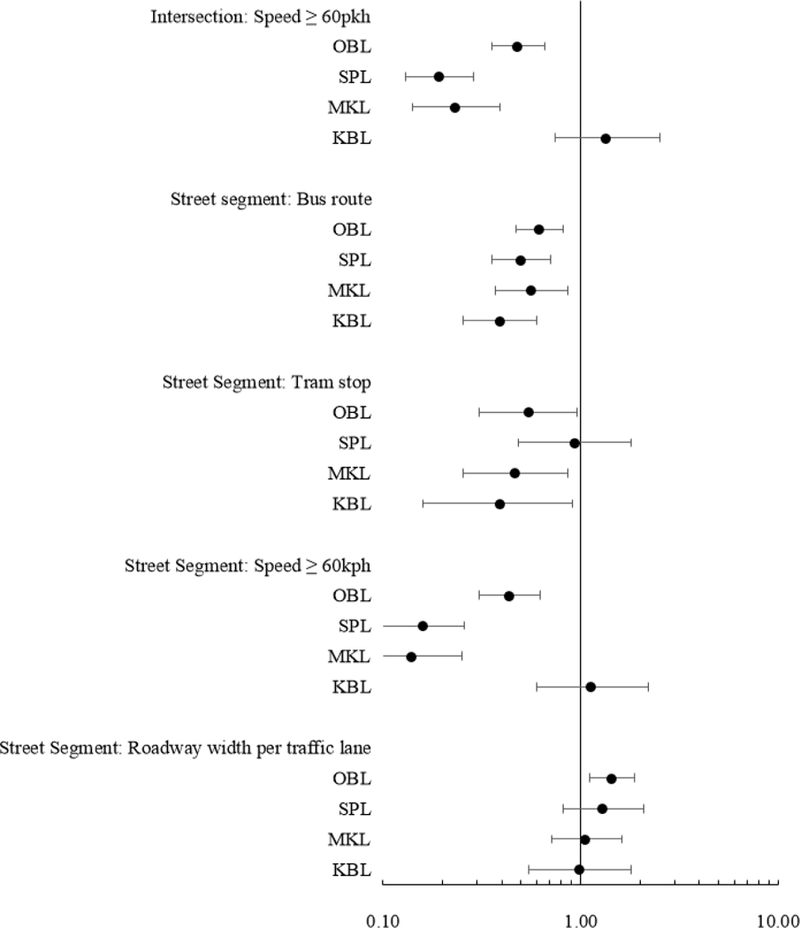
Interaction terms for Model 2, estimating associations between bicycle lane types and crash odds for roadway sections with specific characteristics; n = 89,729
Results of the sensitivity analysis were materially similar to the main results.
4. DISCUSSION
This study in metropolitan Melbourne, Australia, demonstrates that bicycle lanes are differentially associated with bicycle crash risks according to both the type of bicycle lane and the other characteristics present on roadway sections. Bicycle lanes are generally most effective where speeds are greater, traffic lanes are narrower, and bus routes and tram stops are present. Exclusive bicycle lanes are most consistently protective on these roadways.
4.1. All Bicycle Lanes
Our findings are consistent with existing research describing relationships between bicycle lanes of all types and bicycle crashes on street segments. Similar to our previous study in Philadelphia (Kondo et al., 2018) and other published research (Kim and Kim, 2015; Thomas and DeRobertis, 2013), we found bicycle lanes to be most effective on streets with higher speed limits, which also have greater volumes of vehicular traffic. Likewise, the finding that bicycle lanes are most effective where vehicular traffic lanes are narrower reinforces Schepers et al’s (2017) assertion that greater distance between the cyclists and motor vehicles reduces crash risk. Our novel finding that bicycle lanes are more protective than expected along bus routes may be because bicycle lanes provide greater separation between buses and cyclists. Cumulatively, these studies provide evidence in favor of on-road bicycle lanes on larger, faster, narrower roads. Nevertheless, it is critical to note that off-road bicycle facilities (i.e. bicycle paths, bicycle tracks) are associated with fewer bicycle crashes than the on-road lane types examined here, so this analysis effectively identifies the least worst option available to traffic planners who are considering bicycle facilities. Higher traffic volume and vehicular speeds are consistently identified as deterrents to cycling (Heesch et al., 2012; Sener et al., 2009; Winters et al., 2011), so installing bicycle lanes on larger, faster, narrower roads will not necessarily attract additional cyclists. Lowering road speed limits and installing dedicated off-road cycling infrastructure will likely lead to greater increases in cycling participation (DiGioia et al., 2017; Mulvaney et al., 2015).
The collective evidence regarding the impacts of bicycle lanes at intersections is less clear. We found in Philadelphia that the number of exits from an intersection was associated with bicycle lane effectiveness (Kondo et al., 2018). Others have found on-road bicycle lanes to be ineffective or even harmful at roundabouts (Daniels et al., 2009, 2010; Jensen, 2017), and not associated with crash risk at other intersection types (Kaplan and Giacomo Prato, 2015). Here, we find bicycle lanes were associated with reduced crash risks where speed limits are greater but not with other intersection characteristics. Beyond the global assertion that crash risks for bicycle lanes differ according to intersection characteristics, it is difficult to identify consistent patterns across studies due to different variable specification and different bicycle lane configuration. For example, some studies find the configuration of the intersection approach to be important (e.g. with a “bicycle box”) (Harris et al., 2013), and although these features are present on some roadways in Melbourne, this particular feature is not noted in the available data.
4.2. Bike Lane Types
A key strength of our chosen approach is that we are able to disaggregate bicycle lanes according to lane types. Previous studies find bicycle lanes that approach intersections on the driving side of the street are associated with greater reductions in crash risks than are bicycle lanes that approach intersections on the opposite side of the street (Zangenehpour et al., 2016), that one-way bicycle lanes are associated with greater reductions in crash risks at intersections than are two-way bicycle lanes (Schepers et al., 2011), and that painted bicycle lanes are associated with greater reductions in crash risks than are sharrows (Wall et al., 2016). Our results suggest that these differential effects will not be uniform across all intersection and street segment configurations; rather, the relative benefits will vary according to specific local conditions. For example, in Melbourne, shared bicycle and parking lanes are associated with reduced crash odds in most roadways, except at tram stops. Tram stops are typically signed on the road edge and, unless otherwise indicated, vehicular parking is not permitted within 20 metres before the sign. When a tram is present at the stop and tram doors are open, vehicular traffic must wait at the rear of the tram until the tram doors close and the road is free of pedestrians. The precise mechanism by which shared bicycle and parking lanes are less beneficial at tram stops is unclear, but given these conditions it is possible that the parked vehicles and stationary trams funnel cyclists and motor vehicles into the same roadway space, negating the protective effect of the bicycle lane (Teschke et al., 2016).
Despite the observed variation in the benefits of bicycle lane types according to roadway characteristics, our results enable us to infer the overall effectiveness of some lane types. Exclusive bicycle lanes were associated with reduced crash odds for all assessed intersection and street segment characteristics, whereas kerbside bicycle lanes were not associated with reduced crash odds anywhere except along bus routes and at tram stops (where other lane types were similarly effective). Of the assessed bicycle lane types, exclusive bicycle lanes generally provide the greatest physical separation between bicycles and vehicular traffic, and kerbside bicycle lanes provide the least separation. Greater separation will increase passing distance for motor vehicles and may aid visibility for cyclists and motorists, cue motorists to be aware that cyclists are present, and provide greater protection against human error, thereby leading to fewer crashes (Apasnore et al., 2017; Debnath et al., 2018).
4.3. Strengths and Limitations
This study is the first to consider that on-road bicycle lanes may reduce bicycle crash risks differently according to bicycle lane type and roadway conditions. We use highly spatially resolved data to link crash locations to roadway characteristics, and in doing so, we identify that characteristics at precise locations along roadways can affect the degree to which bicycle lanes protect cyclists from crashing with motor vehicles. The most beneficial bicycle lane type for a given roadway will vary between individual street segments and intersections. Our novel approach to handling an unknown denominator allows us to address these critical questions.
Despite these strengths, a key limitation of our chosen study design is that we could not assess the overall impacts of bicycle lanes or bicycle lane types on bicycle crashes. Because the number of cyclists who pass through each roadway segment is unknown, we could not separate the change in crash odds due to the protective effect of bicycle lanes from the change in crash odds due to bicycle lanes attracting additional cyclists. Disentangling these opposing forces will require precise bicycle traffic data for a sample of roadway segments. The available roadway contextual data also leads to some limitations. In particular, the missing traffic lane width data for 49,031 (85.6%) street segments is problematic. Although the results are consistent with previous studies (Apasnore et al., 2017), are consistent across specification tests (e.g. adding missing indicator variable), and omitting this variable from the analysis did not materially affect the parameter estimates for other variables, the finding that bicycle lanes are protective against crashes on narrower roads may be biased. Results for this analysis should be replicated in other setting with more complete traffic lane width data. The geocoded locations of bicycle crashes may be subject to unknown error, which could bias results in either direction. Future analyses should directly assess bicycle traffic volume to account for the unknown denominator problem and examine a “safety in numbers” protective effect (Elvik and Bjornskau, 2017; Thompson, 2018; Thompson et al., 2015; Thompson et al., 2016), for seasonality and time-varying roadway characteristics (e.g. parking hours, school speed zones) (Lücken, 2018), for risk associated with fragmented cyclist paths and on-road egress points (Thompson et al., 2017; Yao and Loo, 2016), for different bicycle lane types compared to those found in Melbourne, and could consider the causal mechanisms by which these findings arise.
5. CONCLUSIONS
Bicycle facilities are an effective approach to reducing bicycle crashes in cities, and bicycle lanes have the capacity to attract cyclists, improve amenity for all city residents, and ultimately save lives. We identify that the bicycle lane types which provide greater separation between cyclists and vehicular traffic are associated with greatest benefits, especially on larger, faster, narrower roads.
Supplementary Material
HIGHLIGHTS.
We ask which bicycle lane types are associated with fewest crashes
Spatial units of analysis were street segments and intersections
Lowest crash odds found where there are higher speeds, tram stops, and bus routes
Exclusive bicycle lanes reduced bicycle crashes in all these settings
Kerbside bicycle lanes were the least beneficial bicycle lane type
Acknowledgments
Funding Sources: Dr. Christopher Morrison’s contribution to this manuscript was supported in part by the National Institute on Alcohol Abuse and Alcoholism of the National Institutes of Health under Award Numbers K01AA026327 and R21AA025749. The content is solely the responsibility of the authors and does not necessarily represent the official views of the National Institutes of Health. Dr. Jason Thompson and Dr. Ben Beck were supported by Australian Research Council Discovery Awards (#DE180101411 & #DE180100825
GLOSSARY
- OBL
Exclusive bicycle lane
- SPL
Shared bicycle and parking lane
- MKL
Marked wide kerbside lane
- KBL
Kerbside bicycle lane
Footnotes
Declarations of Interest: None
Publisher's Disclaimer: This is a PDF file of an unedited manuscript that has been accepted for publication. As a service to our customers we are providing this early version of the manuscript. The manuscript will undergo copyediting, typesetting, and review of the resulting proof before it is published in its final citable form. Please note that during the production process errors may be discovered which could affect the content, and all legal disclaimers that apply to the journal pertain.
REFERENCES
- Alliance for Walking and Biking, 2016. Bicycling and Walking in the United States: Benchmarking Report. Seattle, WA: Retrieved July 27, 2018 from: https://www.aarp.org/content/dam/aarp/livablecommunities/documents-2016/2016-WalkingBicyclingBenchmarkingReport.pdf [Google Scholar]
- Apasnore P, Ismail K, Kassim A, 2017. Bicycle-vehicle interactions at mid-sections of mixed traffic streets: Examining passing distance and bicycle comfort perception. Accident Anal. Prev. 106, 141–148. [DOI] [PubMed] [Google Scholar]
- Beck B, Cameron PA, Fitzgerald MC, Judson RT, Teague W, Lyons RA, Gabbe BJ, 2017. Road safety: serious injuries remain a major unsolved problem. Med. J. Australia 207(6), 244–249. [DOI] [PubMed] [Google Scholar]
- Buehler R, Dill J, 2016. Bikeway networks: A review of effects on cycling. Transport Rev. 36(1), 9–27. [Google Scholar]
- City of Helsinki Traffic Planning Division, 2015. Promotion of Cycling, Helsinki, Finland.
- Daniels S, Brijs T, Nuyts E, Wets G, 2009. Injury crashes with bicyclists at roundabouts: influence of some location characteristics and the design of cycle facilities. J. Safety Res. 40(2), 141–148. [DOI] [PubMed] [Google Scholar]
- Daniels S, Brijs T, Nuyts E, Wets G, 2010. Explaining variation in safety performance of roundabouts. Accident Anal. Prev. 42(2), 393–402. [DOI] [PubMed] [Google Scholar]
- de Hartog JJ, Boogaard H, Nijland H, Hoek G, 2010. Do the health benefits of cycling outweigh the risks? Environ. Health Persp. 118(8), 1109–1116. [DOI] [PMC free article] [PubMed] [Google Scholar]
- Debnath AK, Haworth N, Schramm A, Heesch KC, Somoray K, 2018. Factors influencing noncompliance with bicycle passing distance laws. Accident Anal. Prev. 115, 137–142. [DOI] [PubMed] [Google Scholar]
- DiGioia J, Watkins KE, Xu Y, Rodgers M, Guensler R, 2017. Safety impacts of bicycle infrastructure: A critical review. J. Safety Res. 61, 105–119. [DOI] [PubMed] [Google Scholar]
- Dormann CF, Elith J, Bacher S, Buchmann C, Carl G, Carré G, Marquéz JR, Gruber B, Lafourcade B, Leitao PJ, Munkemuller T, McClean C, Osborne PE, Reineking B, Schroder B, Skidmore AK, Zurell D and Lautenbach S, 2013, Collinearity: a review of methods to deal with it and a simulation study evaluating their performance. Ecography. 36, 27–46. [Google Scholar]
- Elvik R, Bjornskau T, 2017. Safety-in-numbers: A systematic review and meta-analysis of evidence. Safety Sci. 92, 274–282. [Google Scholar]
- Fishman E, Washington S, Haworth NL, 2012. Understanding the fear of bicycle riding in Australia. J. Aust. Coll. Road Safety 23(3), 19–27. [Google Scholar]
- Gӧtschi T, Garrard J, Giles-Corti B, 2016. Cycling as a part of daily life: A review of health perspectives. Transport Rev. 36(1), 45–71. [Google Scholar]
- Gu J, Mohit B, Muennig PA, 2017. The cost-effectiveness of bike lanes in New York City. Inj.Prev. 23(4), 239–243. [DOI] [PubMed] [Google Scholar]
- Hamann C, Peek-Asa C, 2013. On-road bicycle facilities and bicycle crashes in Iowa, 2007-2010. Accident Anal. Prev. 56, 103–109. [DOI] [PMC free article] [PubMed] [Google Scholar]
- Hamer M, Chida Y, 2008. Active commuting and cardiovascular risk: A meta-analytic review. Prev.Med. 46(1), 9–13. [DOI] [PubMed] [Google Scholar]
- Harris MA, Reynolds CCO, Winters M, Cripton PA, Shen H, Chipman ML, Cusimano MD, Babul S, Brubacher JR, Friedman SM, Hunte G, Monro M, Vernich L, Teschke K, 2013. Comparing the effects of infrastructure on bicycling injury at intersections and non-intersections using a case-crossover design. Inj.Prev.19, 303–310. [DOI] [PMC free article] [PubMed] [Google Scholar]
- Heesch KC, Sahlqvist S, Garrard J, 2012. Gender differences in recreational and transport cycling: a cross-sectional mixed-methods comparison of cycling patterns, motivators, and constraints. International J. Behav. N. Phys. Activ. 9(1), 106. [DOI] [PMC free article] [PubMed] [Google Scholar]
- Jensen SU, 2017. Safe roundabouts for cyclists. Accident Anal. Prev. 105, 30–37. [DOI] [PubMed] [Google Scholar]
- Kaplan S, Giacomo Prato C, 2015. A spatial analysis of land use and network effects on frequency and severity of cyclist-motorist crashes in the Copenhagen region. Traffic Inj. Prev. 16(7), 724–731. [DOI] [PubMed] [Google Scholar]
- Katzmarzyk P, Janssen I, 2004. The economic costs associated with physical inactivity and obesity in Canada: An update. Can. J. Appl. Physiol. 29(1), 90–115. [DOI] [PubMed] [Google Scholar]
- Kim D, Kim K, 2015. The influence of bicycle oriented facilities on bicycle crashes within crash concentrated areas. Traffic Inj. Prev. 16(1), 70–75. [DOI] [PubMed] [Google Scholar]
- Kondo MC, Morrison C, Guerra E, Kaufman EJ, Wiebe DJ, 2018. Where do bike lanes work best? A Bayesian spatial model of bicycle lanes and bicycle crashes. Safety Sci. 103, 225–233. [DOI] [PMC free article] [PubMed] [Google Scholar]
- Lord D, Washington SP, Ivan JN, 2005. Poisson, Poisson-gamma and zero-inflated regression models of motor vehicle crashes: balancing statistical fit and theory. Accident Anal. Prev. 37(1), 35–46. [DOI] [PubMed] [Google Scholar]
- Lücken L, 2018. On the variation of the crash risk with the total number of bicyclists. Eur Transp Res Rev. 10(2), 33. [Google Scholar]
- Lunn DJ, Thomas A, Best N, Spiegelhalter D, 2000. WinBUGS-a Bayesian modelling framework: concepts, structure, and extensibility. Stat. Comput. 10(4), 325–337. [Google Scholar]
- Lusk AC, Furth PG, Morency P, Miranda-Moreno LF, Willett WC, Dennerlein JT, 2011. Risk of injury for bicycling on cycle tracks versus in the street. Inj. Prev. 17(2), 131–135. [DOI] [PMC free article] [PubMed] [Google Scholar]
- Marqués R, Hernández-Herrador V, 2017. On the effect of networks of cycle-tracks on the risk of cycling. The case of Seville. Accident Anal. Prev. 102, 181–190. [DOI] [PubMed] [Google Scholar]
- Ming Wen L, Rissel C, 2008. Inverse associations between cycling to work, public transport, and overweight and obesity: Findings from a population based study in Australia. Prev. Med. 46(1), 29–32. [DOI] [PubMed] [Google Scholar]
- Mulvaney CA, Smith S, Watson MC, Parkin J, Coupland C, Miller P, Kendrick D, McClintock H, 2015. Cycling infrastructure for reducing cycling injuries in cyclists. Cochrane DB Syst. Rev. 12, CD010415. [DOI] [PMC free article] [PubMed] [Google Scholar]
- Schepers JP, Kroeze PA, Sweers W, Wüst JC, 2011. Road factors and bicycle-motor vehicle crashes at unsignalized priority intersections. Accident Anal. Prev. 43(3), 853–861. [DOI] [PubMed] [Google Scholar]
- Schepers P, Twisk D, Fishman E, Fyhri A, Jensen A, 2017. The Dutch road to a high level of cycling safety. Safety Sci. 92, 264–273. [Google Scholar]
- Sener IN, Eluru N, Bhat CR, 2009. An analysis of bicycle route choice preferences in Texas, US. Transportation 36(5), 511–539. [Google Scholar]
- Stawarz B, n.d. Car, Citroen, top, vehicle icon. Retrieved July 27, from: https://www.iconfinder.com/icons/905662/carcitroentopvehicleicon#size=128
- Teschke K, Dennis J, Reynolds CCO, Winters M, Harris MA, 2016. Bicycling crashes on streetcar (tram) or train tracks: mixed methods to identify prevention measures. BMC Public Health 16(1), 617. [DOI] [PMC free article] [PubMed] [Google Scholar]
- Teschke K, Reynolds CC, Ries FJ, Gouge B, Winters M, 2012. Bicycling: Health risk or benefit. UBC Med. J. 3(2), 6–11. [Google Scholar]
- Thomas B, DeRobertis M, 2013. The safety of urban cycle tracks: A review of the literature. Accident Anal. Prev. 52, 219–227. [DOI] [PubMed] [Google Scholar]
- Thompson J, Savino G, Stevenson M, 2015. Reconsidering the safety in numbers effect for vulnerable road users: an application of agent-based modeling. Traffic Inj Prev 16(2), 147–153. [DOI] [PubMed] [Google Scholar]
- Thompson J, Savino G, Stevenson M, 2016. A model of behavioural adaptation as a contributor to the safety-in-numbers effect for cyclists. Transport Res A-Pol. 85, 65–75. [Google Scholar]
- Thompson J, Wijnands JS, Savino G, Lawrence B, Stevenson M, 2017. Estimating the safety benefit of separated cycling infrastructure adjusted for behavioral adaptation among drivers; an application of agent-based modelling. Transport Res F-Traf. 49, 18–28. [Google Scholar]
- Thompson J, Wijnands J, Mavoa S, Scully K, Stevenson M, in press. Evidence for the ‘safety in density’ effect for cyclists; validation of agent-based modelling results. Inj Prev. [DOI] [PubMed] [Google Scholar]
- VicRoads, 2016. Traffic Engineering Manual Volume 3 - Additional Network Standards & Guidelines: Design Guidance for strategically important cycling corridors. VicRoads, Melbourne, VIC: Retrieved July 27, 2018, from: https://www.vicroads.vic.gov.au/~/media/files/technical-documents-new/traffic-engineering-manual-v3/tem-vol-3-part-218--vicroads-design-guidance-for-strategicallv-important-cycling-corridors.pdf [Google Scholar]
- Wall SP, Lee DC, Frangos SG, Sethi M, Heyer JH, Ayoung-Chee P, DiMaggio CJ, 2016. The effect of sharrows, painted bicycle lanes and physically protected paths on the severity of bicycle injuries caused by motor vehicles. Safety 2(4), 26. [DOI] [PMC free article] [PubMed] [Google Scholar]
- Waller LA, Gotway CA, 2004. Applied spatial statistics for public health data. John Wiley & Sons, Hoboken, NJ. [Google Scholar]
- Winters M, Davidson G, Kao D, Teschke K, 2011. Motivators and deterrents of bicycling: comparing influences on decisions to ride. Transportation. 38(1), 153–168. [Google Scholar]
- Yao S, Loo BPY, 2016. Safety in numbers for cyclists beyond national-level and city-level data: a study on the non-linearity of risk within the city of Hong Kong. Inj Prev. 22(6):379–385. [DOI] [PMC free article] [PubMed] [Google Scholar]
- Zangenehpour S, Strauss J, Miranda-Moreno LF, Saunier N, 2016. Are signalized intersections with cycle tracks safer? A case-control study based on automated surrogate safety analysis using video data. Accident Anal. Prev. 86, 161–172. [DOI] [PubMed] [Google Scholar]
Associated Data
This section collects any data citations, data availability statements, or supplementary materials included in this article.