Abstract
Background
To investigate the effect of different slice thicknesses and beam energies on the visualization and assessment of coronary artery stenosis caused by calcified plaques using synchrotron radiation computed tomography (CT) based on 3D printed coronary artery models.
Methods
Patient-specific 3D coronary models were created based on 3 sample coronary CT angiographic cases with calcified plaques in the left coronary arteries. In addition to the original significant coronary stenosis (>70%) shown on these CT images, stenoses of <50% and >90% were created in the segmented coronary models for simulation of different degrees of stenosis. The coronary lumen and calcification were printed with soft and rigid materials to simulate properties of coronary wall and calcified plaque, respectively. The models were scanned with synchrotron radiation CT with beam energies of 30, 40 and 50 keV and spatial resolution of 0.019×0.019×0.019 mm3 voxel size. Original high-resolution images were reconstructed with slice thicknesses of 0.095, 0.208, 0.302 and 0.491 mm to determine the effect of spatial resolution on plaque and coronary stenosis assessment based on 2D axial and 3D virtual intravascular endoscopy (VIE) images.
Results
Three coronary artery models were successfully printed with plaques placed in the coronary arteries to simulate different degrees of stenosis. 2D and 3D VIE images reconstructed with slice thicknesses of 0.095, 0.208 and 0.302 mm allowed for accurate assessment of coronary plaques and lumen stenosis with no significant differences (P>0.05). Synchrotron radiation CT images reconstructed with a slice thickness of 0.491 mm resulted in overestimation of coronary stenosis when compared to other images on 2D and 3D VIE views (<50% vs. 55–72%; 70–79% vs. 80–90%) with significant differences (P<0.05). Similarly, irregular plaque appearances were observed on 2D and 3D VIE images with a slice thickness of 0.491 mm when compared to others using thin slice thicknesses. The scanning protocol with beam energy of 30 keV provided optimal visualization of coronary lumen and plaque appearances.
Conclusions
This study shows the feasibility of using 3D printed coronary artery models to simulate calcifications and different degrees of coronary stenosis. High resolution synchrotron radiation CT imaging with the 30 keV beam energy enables accurate assessment of coronary stenosis in the presence of calcification, thus highlighting the importance of high spatial resolution in the diagnosis of calcified coronary plaques.
Keywords: Assessment, computed tomography (CT), coronary artery, plaque, synchrotron radiation, virtual intravascular endoscopy (VIE), 3D printed models
Introduction
Coronary computed tomography angiography (CCTA) is a widely used less-invasive imaging modality for diagnostic assessment of coronary artery disease with high diagnostic value in determining coronary stenosis and prediction of cardiac events (1-6). In patients with low to intermediate coronary stenosis, CCTA is a reliable and cost-effective modality for excluding significant stenosis because of its very high negative predictive value (7-10). However, it is well-known that CCTA cannot accurately assess coronary stenosis caused by extensive calcifications in the coronary artery and has high false positive results due to blooming and beam hardening artifacts. This is confirmed by several studies reporting the low specificity and positive predictive value ranging from 18% to 53% in the diagnosis of calcified plaques (11-14).
A number of strategies have been developed to improve the diagnostic performance of CCTA in diagnosing calcified plaques, and these include use of image post-processing methods and iterative reconstruction (IR) algorithms for suppressing the effects of severe calcification on coronary lumen assessment (12,15-19), and taking left coronary bifurcation angle into account for making diagnosis (20-22). Further, use of images acquired by high resolution computed tomography (CT) scanners with a slice thickness of 0.23 mm has been shown to increase the diagnostic value of CCTA (23-25). To some extent these approaches have improved the diagnostic performance of CCTA in evaluating calcified plaques, however, presence of extensively calcified plaques in the coronary arteries is still a major challenge for CCTA due to limited spatial resolution. Synchrotron radiation CT is an imaging technique with superior spatial resolution able to address this limitation (26-30).
The superiority of synchrotron radiation CT over conventional CT has been confirmed in our previous experiments with more accurate assessment of aortic stent wire structures and resultant cross-sectional area reduction caused by placement of stent grafts across the aortic ostia (31-33). To the best of our knowledge, no research has been conducted to investigate the effects of different spatial resolutions and beam energies on the visualization of calcified plaques and coronary lumen changes. Thus, the purpose of this study was to utilize the high-resolution synchrotron radiation imaging technique for scanning 3D printed coronary models with simulation of calcified plaques and different degrees of stenosis in the coronary arteries for investigating these effects. We hypothesized that the spatial resolution of synchrotron radiation CT images has significant impact on the assessment of coronary stenosis caused by calcified plaques.
Methods
Selection of sample CCTA images
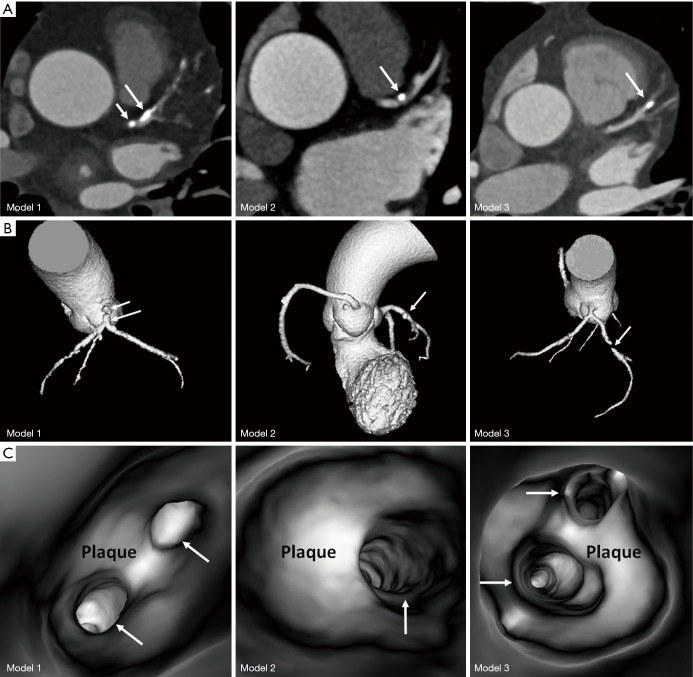
A retrospective analysis of CCTA images with calcified plaques was performed to select three sample cases having severe calcification in the left coronary arteries (15,20). The calcified plaques resulted in different degrees of coronary lumen stenosis (between 45% and 90%) in these coronary arteries. Figure 1 shows 2D axial, 3D reconstruction and 3D virtual intravascular endoscopy (VIE) views of the calcified plaques in these cases. Details of the calcified plaques are as follows:
Figure 1.
The 3 coronary computed tomography angiography cases selected for development of 3D printed models. (A) 2D axial images showing calcified plaques at the left coronary arteries. (B) 3D reconstruction of these cases showing the plaque locations at the left coronary arteries. Long arrows indicate the plaques in the left anterior descending, while short arrows refer to the plaque at the left main stem in model 1. (C) 3D virtual intravascular endoscopy intraluminal views of the plaques. Arrows indicate the left coronary artery ostia.
❖ Case 1: calcifications in the left main stem (LM) resulting in >70% stenosis, and in the proximal segment of left anterior descending (LAD) coronary artery with nearly 50% stenosis;
❖ Case 2: calcification in the proximal segment of LAD with >60% stenosis;
❖ Case 3: calcification in the mid-segment of LAD resulting in >80% stenosis.
Ethics approval was waived in this study due to the retrospective nature and use of de-identified images with patients’ information anonymized.
Image post-processing and segmentation of CCTA images for 3D printing
Original CCTA images in digital imaging and communications in medicine (DICOM) format were transferred to a workstation with Analyze 12.0 (AnalyzeDirect, Inc., Lexana, KS, USA) for image post-processing and segmentation. A semi-automatic approach was used to separate the contrast-enhanced coronary artery lumen and higher attenuation calcified plaques from the surrounding soft tissues, bones or other structures. Manual editing and image filtering were applied to remove the unwanted structures and smooth the surface of coronary artery lumen.
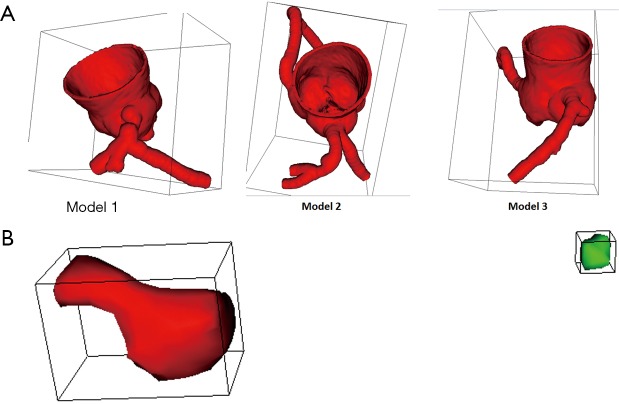
Since our aim was to create 3D printed, patient-specific coronary artery models with calcified plaques inside the coronary arteries, segmentation of coronary artery lumen and calcified plaques was performed separately resulting in 2 different standard tessellation language (STL) files for 3D printing each case (Figure 2). For generation of a coronary lumen model, its external wall thickness was increased by 1.5 mm for ensuring the printed model with adequate stability, while the STL files for calcified plaques remained 1:1 ratio of the original size.
Figure 2.
Coronary lumen and plaque models for 3D printing. (A) The three coronary lumen models. (B) Coronary plaques. The red plaque refers to the one causing >90% stenosis, while the green one represents the plaque resulting in 70% stenosis.
Due to significant stenosis in the LAD, discontinuity was observed in case 3 as shown in Figure 1B. Thus, calcified plaques were put into the proximal and middle segments of left circumflex (LCx) of the coronary lumen model for case 3 with resulting different degrees of stenosis (Figure 2A). In addition to the significant stenoses in the LM in case 1 and LAD in case 2, stenoses of around 45–49% in the proximal segment of LAD and about 70% stenosis in the LCx were created in cases 1 and 2 respectively by inserting the 3D printed calcified plaques into these artery branches. The following is a summary of the simulated calcified plaques in these 3D coronary artery models with different degrees of stenosis:
❖ Model 1: >90% stenosis in LM and <50% stenosis in LAD;
❖ Model 2: >90% stenosis in LAD, and 70% stenosis in LCx;
❖ Model 3: >90% stenosis in proximal LCx and 70% stenosis in middle LCx.
3D printing of coronary artery models with calcification in situ
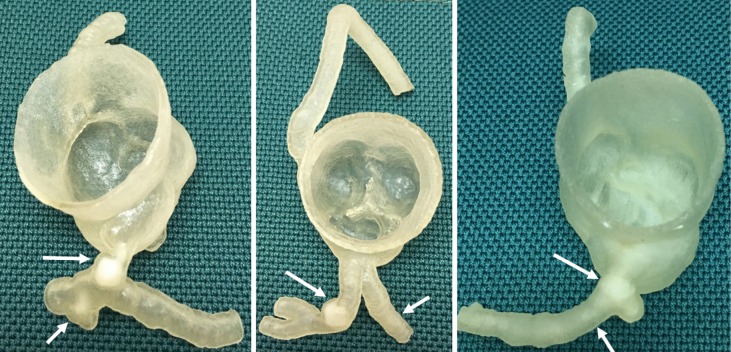
3D printing was performed using Polyjet technology available from Stratasys’ Objet500 Connex3 multi-material 3D printer (Objective 3D, Melbourne, Victoria, Australia). The coronary artery wall was printed with TangoPlus material which is soft and elastic with property similar to the normal coronary artery, while the calcification was printed with VeroWhite material with rigid and opaque characteristics similar to the properties of the calcified plaques. Figure 3 shows the 3D printed coronary artery models with calcification in situ (or inserted into the lumen) in the left coronary artery branches, while Figure 4 shows an example of 3D printed full-size calcifications which were placed inside the LM and LAD in model 1. Figure 5 indicates measurement of the large calcification placed in LM using a digital caliper.
Figure 3.
3D printed coronary models with simulated calcifications in the left main stem (long arrow in left image) and left anterior descending (long arrow in middle image, and short arrow in left image) and left circumflex arteries (short arrow in middle image and arrows in right image).
Figure 4.
3D printed calcifications used for simulation of calcified plaques in the coronary models.
Figure 5.
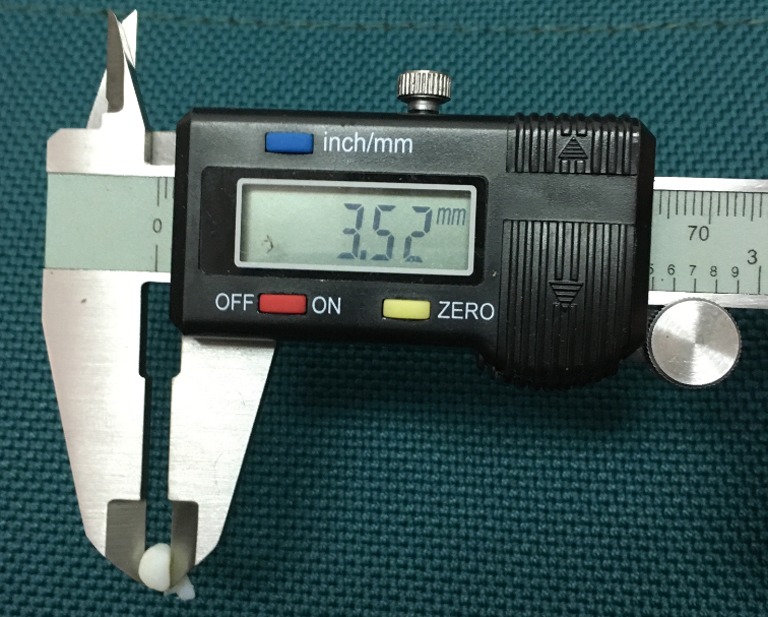
Use of digital caliper to measure the size of calcification which was inserted into the left main stem of model 1.
Synchrotron radiation CT scans
Synchrotron radiation CT scans were conducted at the Australian Synchrotron in Melbourne using the Imaging and Medical Beamline (IMBL). The imaging characteristics of IMBL have been described in our previous papers (31-33). The synchrotron radiation CT images of the 3 coronary artery models were first acquired with a voxel size of 0.019×0.019×0.019 mm3 (slice thickness of 0.019 mm) and beam energies of 30, 40 and 50 keV resulting in 9 original datasets. The rationale of choosing low beam energies was due to the lower X-ray attenuation properties of the TangoPlus and VeroWhite materials used to form the coronary artery models when compared to the one of stent wires which required higher beam energies (60–90 keV) for visualization (31-34). For each original dataset (with 0.019×0.019×0.019 mm3 voxel size), further image reconstructions were performed to generate 4 other sets of synchrotron radiation CT images with various voxel sizes, 0.095×0.095×0.095, 0.208×0.208×0.208, 0.302×0.302×0.302 and 0.491×0.491×0.491 mm3 (slice thicknesses of 0.095, 0.208, 0.302 and 0.491 mm) resulting in 36 datasets (excluding the original datasets) for subsequent analysis. Figure 6 shows the setup of synchrotron radiation CT scan with model 3 placed in the centre of scan table.
Figure 6.
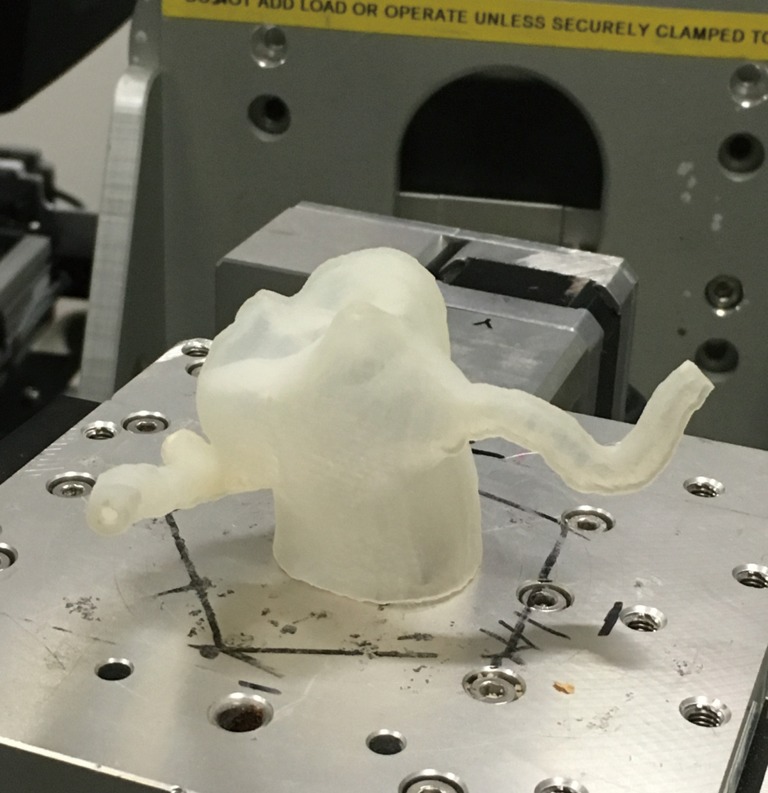
Synchrotron radiation experimental setup for scanning the coronary artery model.
Image post-processing, visualization of coronary plaques and coronary lumen assessment
Synchrotron radiation CT images in tagged image file format (TIFF) underwent image analysis and measurements with the approach similar to the one described in our recent studies (32,33). Measurements were performed on 2D axial and 3D VIE images from 36 datasets to determine the degree of coronary lumen stenosis. Generation of VIE images of coronary artery and plaques has been described in our previous studies (35-37). Each measurement was repeated three times with the mean values taken as the final ones to reduce intra-observer variation. A single observer with more than 5 years of experience in synchrotron radiation experiments performed all these measurements. Measurements on randomly selected images of each dataset were repeated by the same observer in 2 weeks with excellent correlation of intra-observer agreement between these measurements (r=0.945, P<0.01).
Statistical analysis
Data analyses were performed using SPSS V 24.0 (IBM Corporation, Armonk, NY, USA). Continuous variables were expressed as the mean and standard deviation. Comparisons of the measurements of coronary lumen stenosis across datasets with different voxel sizes (slice thicknesses) and beam energies were performed using a paired sampled Student’s t-test, with P value less than 0.05 indicating statistically significant difference.
Results
Synchrotron radiation CT scans were successfully performed for these 3D printed coronary artery models with use of different beam energies. For assessment of highly significant coronary stenosis (>90%) of the LM, LAD and proximal LCx arteries in these three models, the measured values remained similar across 2D and 3D VIE images. The images reconstructed with a slice thickness of 0.491 mm show higher degree of stenosis than other images with thin slice thicknesses, although this did not reach statistically significant (P>0.05) (Tables 1-3).
Table 1. Measurements of coronary lumen stenosis in synchrotron radiation CT images of coronary artery model 1 acquired with different beam energies and slice thicknesses.
| 2D and 3D VIE | Beam energies | Left main stem (degree of lumen stenosis %) | Left anterior descending (degree of lumen stenosis %) | |||||||
|---|---|---|---|---|---|---|---|---|---|---|
| 0.095 mm (mean ± SD) |
0.208 mm (mean ± SD) |
0.302 mm (mean ± SD) |
0.491 mm (mean ± SD) |
0.095 mm (mean ± SD) |
0.208 mm (mean ± SD) |
0.302 mm (mean ± SD) |
0.491 mm (mean ± SD) |
|||
| 2D axial images | 30 keV | 99.1±0.004 | 98.8±0.003 | 99.1±0.004 | 100±0.000 | 47.4±0.007 | 47.3±0.001 | 48.6±0.022 | 55.1±0.036 | |
| 40 keV | 98.7±0.002 | 98.7±0.006 | 98.8±0.006 | 100±0.000 | 47.5±0.017 | 46.5±0.014 | 47.3±0.014 | 57.7±0.026 | ||
| 50 keV | 98.5±0.001 | 98.3±0.012 | 98.6±0.008 | 100±0.000 | 45.9±0.011 | 45.1±0.015 | 44.7±0.021 | 56.7±0.029 | ||
| 3D VIE images | 30 keV | 99.3±0.003 | 97.7±0.012 | 98.3±0.002 | 100±0.000 | 48.2±0.006 | 46.1±0.020 | 45.9±0.013 | 70.1±0.006 | |
| 40 keV | 98.3±0.005 | 96.8±0.024 | 97.4±0.007 | 100±0.000 | 46.9±0.011 | 47.1±0.011 | 44.2±0.023 | 71.3±0.037 | ||
| 50 keV | 98.3±0.000 | 97.9±0.011 | 99.2±0.021 | 99.4±0.010 | 46.4±0.032 | 44.1±0.002 | 48.2±0.044 | 72.9±0.019 | ||
SD, standard deviation; VIE, virtual intravascular endoscopy.
Table 2. Measurements of coronary lumen stenosis in synchrotron radiation CT images of coronary artery model 2 acquired with different beam energies and slice thicknesses.
| 2D and 3D VIE | Beam energies | Left anterior descending (degree of lumen stenosis %) | Left circumflex (degree of lumen stenosis %) | |||||||
|---|---|---|---|---|---|---|---|---|---|---|
| 0.095 mm (mean ± SD) |
0.208 mm (mean ± SD) |
0.302 mm (mean ± SD) |
0.491 mm (mean ± SD) |
0.095 mm (mean ± SD) |
0.208 mm (mean ± SD) |
0.302 mm (mean ± SD) |
0.491 mm (mean ± SD) |
|||
| 2D axial images | 30 keV | 97.2±0.025 | 97.8±0.022 | 96.4±0.012 | 96.4±0.010 | 70.0±0.003 | 71.7±0.022 | 77.8±0.011 | 84.8±0.008 | |
| 40 keV | 97.3±0.001 | 96.2±0.023 | 96.1±0.005 | 96.1±0.020 | 70.7±0.005 | 71.6±0.031 | 74.6±0.033 | 80.3±0.000 | ||
| 50 keV | 97.3±0.007 | 95.9±0.010 | 96.4±0.021 | 96.7±0.027 | 70.2±0.020 | 71.9±0.022 | 75.1±0.000 | 83.6±0.028 | ||
| 3D VIE images | 30 keV | 97.8±0.013 | 95.7±0.018 | 96.8±0.026 | 96.5±0.017 | 72.5±0.019 | 72.6±0.030 | 73.8±0.028 | 90.8±0.040 | |
| 40 keV | 96.6±0.026 | 97.1±0.004 | 95.8±0.001 | 96.2±0.014 | 76.8±0.005 | 73.4±0.027 | 79.7±0.034 | 89.8±0.019 | ||
| 50 keV | 97.4±0.012 | 95.4±0.054 | 96.2±0.019 | 94.9±0.028 | 77.1±0.007 | 74.2±0.033 | 79.1±0.018 | 90.1±0.048 | ||
SD, standard deviation; VIE, virtual intravascular endoscopy.
Table 3. Measurements of coronary lumen stenosis in synchrotron radiation CT images of coronary artery model 3 acquired with different beam energies and slice thicknesses.
| 2D and 3D VIE | Beam energies | Left circumflex-proximal segment (degree of lumen stenosis %) | Left circumflex-mid segment (degree of lumen stenosis %) | |||||||
|---|---|---|---|---|---|---|---|---|---|---|
| 0.095 mm (mean ± SD) |
0.208 mm (mean ± SD) |
0.302 mm (mean ± SD) |
0.491 mm (mean ± SD) |
0.095 mm (mean ± SD) |
0.208 mm (mean ± SD) |
0.302 mm (mean ± SD) |
0.491 mm (mean ± SD) |
|||
| 2D axial images | 30 keV | 99.2±0.005 | 97.2±0.009 | 97.8±0.005 | 100±0.000 | 71.5±0.011 | 75.2±0.017 | 74.7±0.021 | 85.1±0.078 | |
| 40 keV | 99.0±0.003 | 98.9±0.005 | 97.8±0.001 | 96.8±0.018 | 71.2±0.011 | 75.6±0.015 | 79.7±0.014 | 84.2±0.009 | ||
| 50 keV | 98.9±0.003 | 98.2±0.001 | 97.3±0.006 | 97.3±0.011 | 70.7±0.013 | 74.7±0.013 | 73.7±0.039 | 87.1±0.011 | ||
| 3D VIE images | 30 keV | 99.2±0.006 | 96.6±0.028 | 96.3±0.018 | 97.9±0.003 | 73.6±0.007 | 78.7±0.007 | 74.1±0.048 | 89.5±0.012 | |
| 40 keV | 98.2±0.002 | 96.9±0.013 | 96.9±0.018 | 96.2±0.002 | 75.9±0.042 | 74.2±0.011 | 78.5±0.009 | 87.5±0.007 | ||
| 50 keV | 99.7±0.000 | 98.5±0.008 | 98.2±0.001 | 97.5±0.016 | 71.5±0.030 | 75.1±0.022 | 74.3±0.014 | 88.4±0.055 | ||
SD, standard deviation; VIE, virtual intravascular endoscopy.
Significant differences were observed in the assessment of calcified plaques with associated intermediate coronary stenosis (45–70%) among these three models. The images reconstructed with a large slice thickness, 0.491 mm resulted in significantly different measurements compared to the images acquired with other slice thicknesses (P<0.05). Table 1 shows that the coronary stenosis caused by the calcified plaque at the LAD in model 1 was measured less than 50% in 2D and 3D VIE views of images reconstructed with slice thicknesses of 0.095, 0.208 and 0.302 mm. However, the stenosis was measured more than 55% on 2D axial images and more than 70% on 3D VIE images when the slice thickness of 0.491 mm was used to reconstruct these images.
Tables 2 and 3 show the measurement of coronary stenosis at the LCx in the models 2 and 3. The measured values remained similar, which are between 70% and 79% when images were reconstructed with 0.095, 0.208 and 0.302 mm slice thicknesses (P>0.05), although the values were measured higher with images of 0.302 mm slice thickness, and this is especially apparent in the model 2 measurements. In contrast, there are significant differences in the measurements for the images reconstructed with 0.491 mm slice thickness (both 2D and 3D VIE images) when compared to other images, with measured values more than 80% (P<0.01).
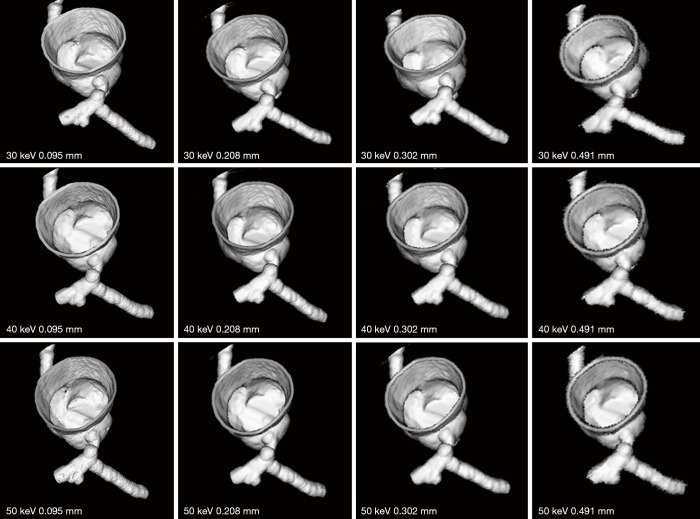
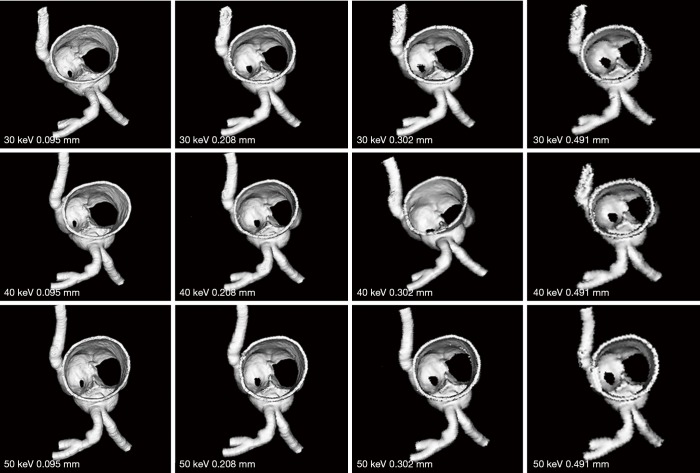
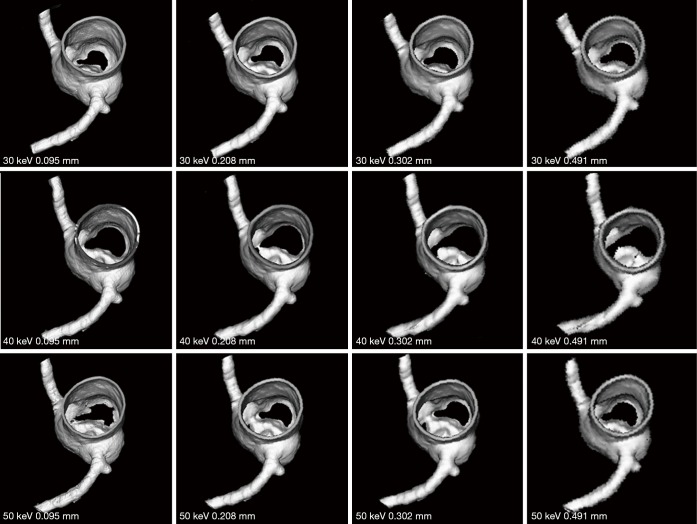
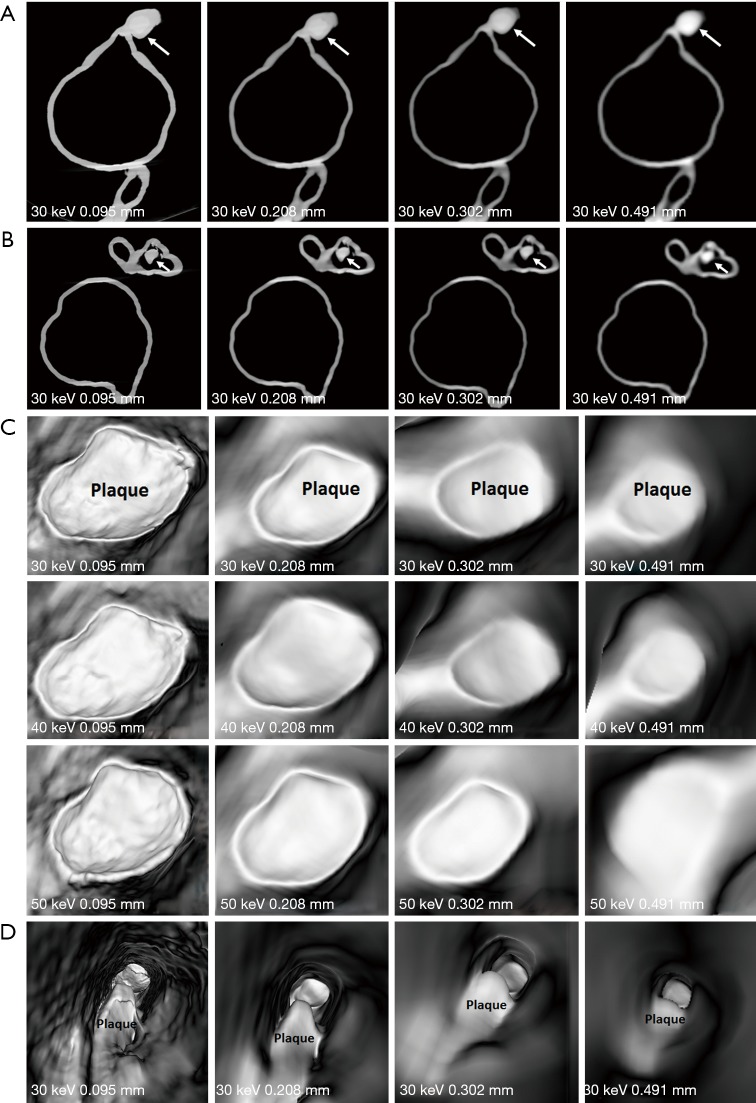
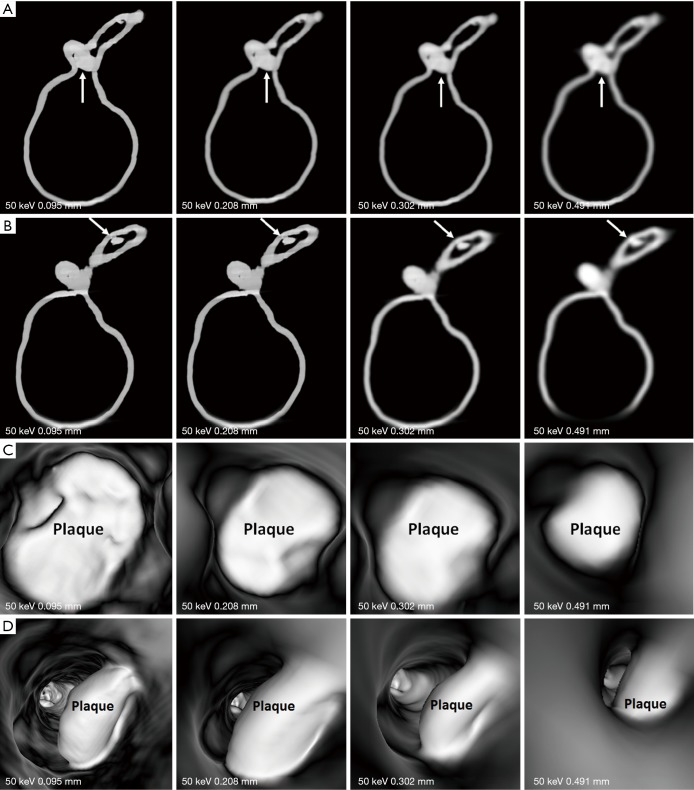
Figures 7-9 show 3D synchrotron radiation CT image reconstructions of the coronary artery models. As shown in these images, when the slice thickness was increased to 0.491 mm, the coronary artery lumen became irregular, and this is apparent in the images acquired with beam energies of 40 and 50 keV compared to the images acquired with beam energy of 30 keV. Figures 10-12 present a series of 2D and 3D synchrotron radiation CT images of models 1–3 acquired with different beam energies and slice thicknesses, respectively. When the slice thickness was increased to 0.491 mm, visualization of calcified plaques at the left coronary arteries (either highly significant or intermediate stenosis) was affected with either showing blurred edge on 2D axial images, or irregular appearances on 3D VIE images. Similar to 3D visualization of the coronary lumen, images acquired with the beam energy of 30 keV resulted in the best visualization of coronary plaques when compared to those with use of 40 and 50 keV (Figures 10C and 11D), although there are no significant differences in measurements between 30 keV and other beam energies (P>0.05) (Tables 1-3).
Figure 7.
3D reconstruction of synchrotron radiation computed tomography images of model 1 with different beam energies and slice thicknesses. It is noted that when the slice thickness was increased to 0.491 mm, visualization of coronary lumen and plaques is affected with irregular or blurring appearance.
Figure 8.
3D reconstruction of synchrotron radiation computed tomography images of model 2 with different beam energies and slice thicknesses. Similar to model 1 images, when the slice thickness was increased to 0.491 mm, visualization of coronary lumen and plaques is affected with irregular or blurring appearance.
Figure 9.
3D reconstruction of synchrotron radiation computed tomography images of model 3 with different beam energies and slice thicknesses. Irregular or blurring appearance is observed at the left circumflex coronary artery when slice thickness was increased to 0.491 mm when compared to the smooth surface seen in images with slice thicknesses between 0.095 and 0.302 mm.
Figure 10.
2D and 3D virtual intravascular endoscopy (VIE) synchrotron radiation computed tomography images of model 1. (A and B) 2D axial images with beam energy of 30 keV and reconstructed with different slice thicknesses. Long arrows point to the plaque at left main stem (LM), while short arrows refer to the plaque at left anterior descending arteries (LAD). (C) VIE images of plaque at LM acquired with beam energies of 30, 40 and 50 keV and reconstructed with different slice thicknesses. Images with use of 30 keV beam energy demonstrate best visualization of the coronary wall and plaque appearance when compared to those with 40 and 50 keV beam energies. Visualization of coronary wall and plaque is significantly affected in images with 0.491 mm slice thickness. (D) VIE views of plaque at LAD with beam energy of 30 keV and different slice thicknesses. Plaque shape or configuration was changed in images with a slice thickness of 0.491 mm.
Figure 11.
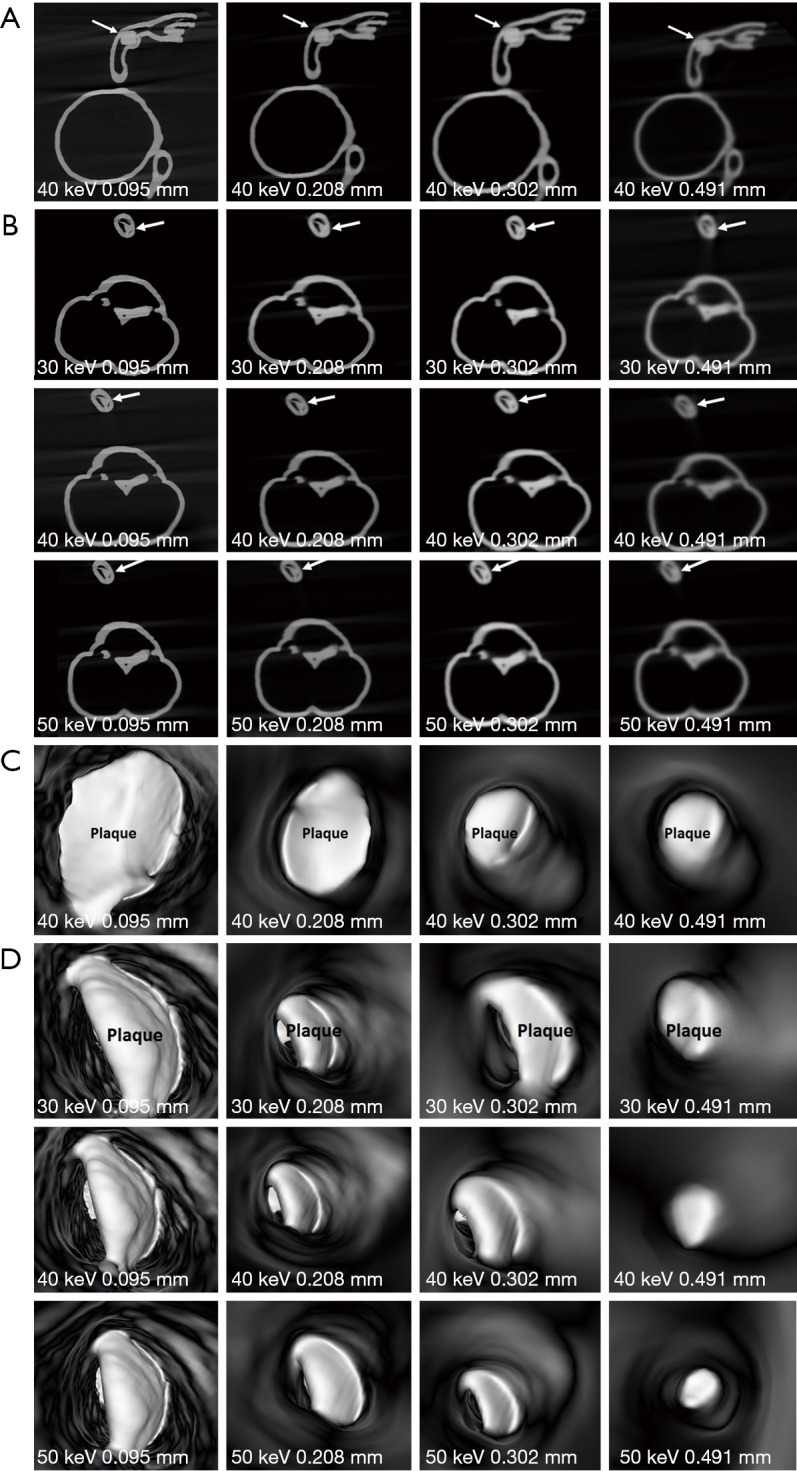
2D and 3D virtual intravascular endoscopy (VIE) synchrotron radiation computed tomography images of model 2. (A) 2D axial images acquired with beam energy of 40 keV and reconstructed with different slice thicknesses. Arrows refer to the plaque at left anterior descending arteries (LAD). (B) 2D axial images acquired with different beam energies and slice thicknesses. Images reconstructed with a slice thickness of 0.491 mm result in suboptimal visualization of plaque (arrows) at left circumflex (LCx). (C) 3D VIE images of plaque at LAD acquired with beam energy of 40 keV and reconstructed with different slice thicknesses. (D) 3D VIE images of plaque at LCx acquired with different beam energies and slice thicknesses. The plaque became irregular when the slice thickness of 0.491 mm was used for image reconstruction.
Figure 12.
2D and 3D virtual intravascular endoscopy (VIE) synchrotron radiation computed tomography images of model 3 acquired with beam energy of 50 keV and reconstructed with different slice thicknesses. (A and B) 2D axial images of plaques at the proximal and mid-segments of left circumflex artery (arrows). (C and D) 3D VIE views of plaques at the left circumflex with visualization of plaque appearance affected in images reconstructed with a slice thickness of 0.491 mm.
Discussion
This study utilized the superior spatial resolution of synchrotron radiation CT imaging for visualization and assessment of calcified plaques and coronary artery stenosis based on 3D printed coronary models. Synchrotron radiation CT images reconstructed with slice thicknesses ranging from 0.095 to 0.302 mm demonstrated accurate measurements of the degree of coronary stenosis, while images reconstructed with a slice thickness of 0.491 mm resulted in significant overestimation of the coronary stenosis caused by calcified plaques. Findings of this study further confirm the recommendation of high spatial resolution technique for assessment of calcified coronary plaques and detection of coronary stenosis (34).
Heavy calcifications in the coronary arteries present a challenge for CCTA due to the well-known fact of beam hardening or blooming artifacts. Despite high sensitivity and very high negative predictive value, CCTA has low to moderate specificity and positive predictive value in the diagnosis of calcified coronary plaques because of high false positive rates (11-14,20). Use of image post-processing algorithms to suppress the artifacts resulting from extensively calcified plaques has been shown to improve specificity of CCTA from 33% to 66% (15,19). When compared with traditional filtered back projection, IR resulted in improved specificity and positive predictive value in patients with high calcium scores or severe calcifications in the coronary arteries. However, it should be cautious to use IR due to contradictory finding reported in some studies. This is because inappropriate use of IR can significantly reduce the calcium volume (16-18,38). Use of de-blooming algorithm is another novel approach for solving calcification-related artifacts during CCTA examinations. Li et al. (39) tested this new algorithm on both coronary artery phantom and patients, and their results showed the de-blooming algorithm significantly decreased the blooming artifacts caused by calcified plaques and improved diagnostic accuracy of CCTA. Despite effectiveness of these strategies for reducing blooming artifacts to some extent, the limitation of spatial resolution of CCTA is unchanged, thus, the beam hardening artifacts associated with high calcification remains unresolved.
High spatial resolution CT is a recently developed prototype which allows for acquisition of images with 0.25 mm slice thickness leading to improved diagnostic accuracy of CCTA in coronary artery disease and evaluation of coronary in-stent restenosis (23-25,40,41). Motoyama et al. (41) compared diagnostic value of high-resolution CT (HRCT) with conventional resolution CT (0.25 vs. 0.5 mm slice thickness) in 23 patients with calcified plaques. For 27 calcified plaques graded as >50% stenosis by conventional CT, 85% of these were reclassified as <50% stenosis by HRCT. Diagnostic accuracy of CCTA was significantly improved by HRCT compared with conventional CT since the area under the receiver operating characteristic curve being 0.98 (HRCT) vs. 0.80 (conventional CT). Our results are consistent with these findings. High resolution synchrotron CT images with slice thicknesses ranging from 0.095 to 0.302 mm allow for accurate assessment of calcified plaques and coronary stenosis, while the calcification appears oversizing due to limited spatial resolution of images reconstructed with 0.491 mm slice thickness. Hence, further studies of CCTA should focus on the use of high-resolution imaging for diagnostic assessment of calcified plaques (34).
Synchrotron radiation CT is an imaging technique offering superior spatial resolution with promising applications in cardiovascular disease (27-33). The spatial resolution of synchrotron radiation CT is more than 10-fold of conventional CT, therefore, it is able to provide detailed analysis of coronary wall changes and coronary plaque composition (29,30). In our study, the original raw data of synchrotron radiation CT images were acquired with ultra-high-resolution 0.019 mm slice thickness. This is far superior to the capability of the latest CT scanners available in the clinical practice (0.019 vs. 0.25 mm), thus we reconstructed the images into different slice thicknesses to generate data with spatial resolution similar to that of latest CT scanners for investigation of effect of spatial resolution on assessment of coronary stenosis caused by calcified plaques. Further, different beam energies were tested on our coronary artery models with 30 keV producing the best visualization of coronary artery wall and calcified plaque appearances. In our previous synchrotron radiation experiments (31-33), we identified about 70 keV beam energy was optimum for visualizing metal stent wires. As monochromatic X-rays were used for synchrotron radiation CT (31,32), 70 keV monochromatic beam energy is similar to the mean photon energy of polychromatic beam produced by 140 kVp tube potential in conventional CT (42). However, the X-ray attenuation property of metallic objects is considerably higher than that of calcified plaques. Also, both calcified plaques and coronary artery wall which has even lower X-ray attenuation coefficient were required to be clearly visualized together for accurate assessment of degrees of stenosis (34). The finding of 30 keV being the optimum beam energy is within expectation.
3D printing is a promising technique with rapid developments and applications in the medical field (43-45). 3D printed physical models of cardiovascular disease replicate complex cardiovascular anatomical structures and pathologies with high accuracy according to recent studies (46-48). This is further confirmed in our study as we created patient-specific 3D printed coronary artery models with insertion of coronary plaques based on patients’ CT images. These 3D printed models were employed to investigate the assessment of calcified coronary plaques using superior spatial resolution synchrotron radiation CT images reconstructed with some slice thicknesses which cannot be acquired by current CT scanners. Use of HRCT on coronary phantom experiments has been reported (40,41), however, to our knowledge, this is the first report in the literature regarding the use of 3D printed realistic coronary models with calcification placed inside the coronary arteries for analysis of coronary stenosis and plaque appearances. Results of this study add valuable information to the existing literature proving that accurate assessment of coronary stenosis due to calcified plaques can be achieved with high spatial resolution images, highlighting the future research direction in this area.
There are several limitations in this study. First, as explained in our previous reports (31-33), we did not use contrast medium in our models because of superior spatial and contrast resolution of synchrotron radiation CT. Further, the models were not placed in a container to simulate surrounding thoracic structures. This was not an issue for our assessment as we focused on both 2D and 3D VIE images with excellent visualization of anatomical details and plaque appearances. Second, we simulated <50% and >70% coronary stenosis in these 3D printed coronary models with the aim of differentiating non-significant from significant coronary stenosis. However, the main challenge of current CCTA is to determine the significance of intermediate coronary stenosis (50–69%). Simulation of different degrees of stenosis in this range of 50–69% should be considered in future experiments. Finally, the external coronary wall thickness was increased by 1.5 mm for 3D printing purpose, which made the model wall look thicker than its actual size. However, the dimensions of lumens of coronary arteries remained unchanged, hence our analysis was not affected.
In conclusion, we have successfully created 3D printed coronary artery models based on patient’s CCTA images with simulation of calcifications in the coronary arteries resulting in different degrees of stenosis. Synchrotron radiation CT images with different slice thicknesses and beam energies were acquired with 30 keV being the optimal protocol for visualization of coronary wall and plaques. Synchrotron radiation CT images with thin slice thicknesses between 0.095 and 0.302 mm allow for accurate assessment of coronary stenosis on both 2D and 3D VIE images, while images with a slice thickness of 0.491 mm lead to significant overestimation of coronary stenosis. Future research should focus on developments of high spatial resolution CT imaging for accurate diagnostic assessment of calcified coronary plaques.
Acknowledgements
The authors would like to thank Drs. Chris Hall and Anton Maksimenko from Australian Synchrotron for their assistance and support in the experiments. This study was undertaken on the Imaging and Medical Beamline at the Australian Synchrotron, Victoria, Australia.
Ethical Statement: Ethics approval was waived in this study due to the retrospective nature and use of de-identified images with patients’ information anonymized.
Footnotes
Conflicts of Interest: The authors have no conflicts of interest to declare.
References
- 1.SCOT-HEAET investigators CT coronary angiography in patients with suspected angina due to coronary heart disease (SCOT-HEART): an open-label, parallel-group, multicentre trial. Lancet 2015;385:2383-91. 10.1016/S0140-6736(15)60291-4 [DOI] [PubMed] [Google Scholar]
- 2.Sun Z, Lin C. Diagnostic value of 320-slice coronary CT angiography in coronary artery disease: A systematic review and meta-analysis. Curr Med Imaging Rev 2014;10:272-80. 10.2174/157340561004150121140836 [DOI] [Google Scholar]
- 3.Xu L, Sun Z, Fan Z. Non-invasive physiologic assessment of coronary stenoses using cardiac CT. Biomed Res Int 2014;2014:435737. [DOI] [PMC free article] [PubMed] [Google Scholar]
- 4.Li L, Hao J, Qu S, Fang Y. The diagnostic value of three-dimensional CT angiography for patients with acute coronary artery disease. Exp Ther Med 2018;16:945-949. [DOI] [PMC free article] [PubMed] [Google Scholar]
- 5.Teressa G, Zhang M, Lavenburg P, Cantor G, Noack P, Yang J, Goyfman M, Feldmann EJ, Butler J, Poon M. Validity of coronary artery disease consortium models for predicting obstructive coronary artery disease & cardiovascular events in patients with acute chest pain considered for coronary computed tomographic angiography. Am J Cardiol 2018;122:1310-1321. 10.1016/j.amjcard.2018.07.005 [DOI] [PubMed] [Google Scholar]
- 6.Sun Z, Choo GH, Ng KH. Coronary CT angiography: current status and continuing challenges. Br J Radiol 2012;85:495-510. 10.1259/bjr/15296170 [DOI] [PMC free article] [PubMed] [Google Scholar]
- 7.Lee SP, Seo JK, Hwang IC, Park JB, Park EA, Lee W, Paeng JC, Lee HJ, Yoon YE, Kim HL, Koh E, Choi I, Choi JE, Kim YJ, CARE-CCTA Study Investigators Coronary computed tomography angiography vs. myocardial single photon emission computed tomography in patients with intermediate risk chest pain: a randomized clinical trial for cost-effectiveness comparison based on real-world cost. Eur Heart J Cardiovasc Imaging 2018. [Epub ahead of print]. doi: . 10.1093/ehjci/jey099 [DOI] [PubMed] [Google Scholar]
- 8.Lee SP, Jang EJ, Kim YJ, Cha MJ, Park SY, Song HJ, Choi JE, Shim JI, Ahn J, Lee HJ. Cost-effectiveness of coronary CT angiography in patients with chest pain: Comparison with myocardial single photon emission tomography. J Cardiovasc Comput Tomogr 2015;9:428-37. 10.1016/j.jcct.2015.02.008 [DOI] [PubMed] [Google Scholar]
- 9.Bertoldi EG, Stella SF, Rohde LE, Polanczyk CA. Long-term cost-effectiveness of diagnostic tests for assessing stable chest pain: Modeled analysis of anatomical and functional strategies. Clin Cardiol 2016;39:249-56. 10.1002/clc.22532 [DOI] [PMC free article] [PubMed] [Google Scholar]
- 10.Priest VL, Scuffham PA, Hachamovitch R, Marwick TH. Cost-effectiveness of coronary computed tomography and cardiac stress imaging in the emergency department: a decision analytic model comparing diagnostic strategies for chest pain in patients at low risk of acute coronary syndromes. JACC Cardiovasc Imaging 2011;4:549-56. 10.1016/j.jcmg.2011.03.008 [DOI] [PubMed] [Google Scholar]
- 11.Park MJ, Jung JI, Choi YS, Ann SH, Youn HJ, Jeoon GN, Choi HC. Coronary CT angiography in patients with high calcium score: evaluation of plaque characteristics and diagnostic accuracy. Int J Cardiovasc Imaging 2011;27:43-51. 10.1007/s10554-011-9970-7 [DOI] [PubMed] [Google Scholar]
- 12.Sun Z, Ng C. High calcium scores in coronary CT angiography: effects of image post-processing on visualization and measurement of coronary lumen diameter. J Med Imaging Health Inf 2015;5:110-6. 10.1166/jmihi.2015.1366 [DOI] [Google Scholar]
- 13.Chen CC, Chen CC, Hsieh IC, Liu YC, Liu CY, Chan T, Wen MS, Wan YL. The effect of calcium score on the diagnostic accuracy of coronary computed tomography angiography. Int J Cardiovasc Imaging 2011;27 Suppl 1:37-42. 10.1007/s10554-011-9955-6 [DOI] [PubMed] [Google Scholar]
- 14.Palumbo AA, Maffei E, Martini C, Tarantini G, Di Tanna GL, Berti E, Grilli R, Casolo G, Brambilla V, Cerrato M, Rotondo A, Weustink AC, Mollet NR, Cademartiri F. Coronary calcium score as gatekeeper for 64-slice computed tomography coronary angiography in patients with chest pain: per-segment and per-patient analysis. Eur Radiol 2009;19:2127-35. 10.1007/s00330-009-1398-2 [DOI] [PubMed] [Google Scholar]
- 15.Sun Z, Ng CKC, Xu L, Fan Z, Lei J. Coronary CT angiography in heavily calcified coronary arteries: Improvement of coronary lumen visualization and coronary stenosis assessment with image postprocessing methods. Medicine 2015;94:e2148. 10.1097/MD.0000000000002148 [DOI] [PMC free article] [PubMed] [Google Scholar]
- 16.van Osch JAC, Mouden M, van Dalen JA, Timmer JR, Reiffers S, Knollema S, Greuter MJ, Ottervanger JP, Jager PL. Influence of iterative image reconstruction on CT-based calcium score measurements. Int J Cardiovasc Imaging 2014;30:961-7. [DOI] [PubMed] [Google Scholar]
- 17.Renker M, Nance JW, Jr, Schoepf UJ, O'Brien TX, Zwerner PL, Meyer M, Kerl JM, Bauer RW, Fink C, Vogl TJ, Henzler T. Evaluation of heavily calcified vessel with coronary CT angiography: comparison of iterative and filtered back projection image reconstruction. Radiology 2011;260:390-9. 10.1148/radiol.11103574 [DOI] [PubMed] [Google Scholar]
- 18.Takx RAP, Willemink MJ, Nathoe HM, Schilham AM, Budde RP, de Jong PA, Leiner T. The effect of iterative reconstruction on quantitative computed tomography assessment of coronary plaque composition. Int J Cardiovasc Imaging 2014;30:155-63. 10.1007/s10554-013-0293-8 [DOI] [PubMed] [Google Scholar]
- 19.Tanaka R, Yoshioka K, Muranaka K, Chiba T, Ueda T, Sasaki T, Fusazaki T, Ehara S. Improved evaluation of calcified segments on coronary CT angiography: a feasibility study of coronary calcium subtraction. Int J Cardiovasc Imaging 2013;29:75-81. 10.1007/s10554-013-0316-5 [DOI] [PubMed] [Google Scholar]
- 20.Sun Z, Xu L, Fan Z. Coronary CT angiography in calcified coronary plaques: Comparison of diagnostic accuracy between bifurcation angle measurement and coronary lumen assessment for diagnosing significant coronary stenosis. Int J Cardiol 2016;203:78-86. 10.1016/j.ijcard.2015.10.079 [DOI] [PubMed] [Google Scholar]
- 21.Sun Z. Coronary CT angiography in coronary artery disease: correlation between virtual intravascular endoscopic appearances and left bifurcation angulation and coronary plaques. Biomed Res Int 2013;2013:732059. 10.1155/2013/732059 [DOI] [PMC free article] [PubMed] [Google Scholar]
- 22.Xu L, Sun Z. Coronary CT angiography evaluation of calcified coronary plaques by measurement of left coronary bifurcation angle. Int J Cardiol 2015;182:229-31. 10.1016/j.ijcard.2014.12.114 [DOI] [PubMed] [Google Scholar]
- 23.Pontone G, Bertella E, Mushtaq S, Loguercio M, Cortinovis S, Baggiano A, Conte E, Annoni A, Formenti A, Beltrama V, Guaricci AI, Andreini D. Coronary artery disease: diagnostic accuracy of CT coronary angiography-A comparison of high and standard spatial resolution scanning. Radiology 2014;271:688-94. 10.1148/radiol.13130909 [DOI] [PubMed] [Google Scholar]
- 24.Onishi H, Hori M, Ota T, Nakamoto A, Osuga K, Tatsumi M, Fukui H, Tsukagoshi S, Uranishi A, Saito Y, Taniguchi A, Enchi Y, Sato K, Tomiyama N. Phantom study of in-stent restenosis at high-spatial-resolution CT. Radiology 2018;289:255-60. 10.1148/radiol.2018180188 [DOI] [PubMed] [Google Scholar]
- 25.Andreini D, Pontone G, Mushtaq S, Conte E, Perchinunno M, Guglielmo M, Volpato V, Annoni A, Baggiano A, Formenti A, Mancini ME, Beltrama V, Ditali V, Campari A, Fiorentini C, Bartorelli AL, Pepi M. Atrial fibrillation: Diagnostic accuracy of coronary CT angiography performed with a whole-heart 230-µm spatial resolution CT scanner. Radiology 2017;284:676-84. 10.1148/radiol.2017161779 [DOI] [PubMed] [Google Scholar]
- 26.Lewis R. Medical applications of synchrotron radiation x-rays. Phys Med Biol 1997;42:1213–1243. 10.1088/0031-9155/42/7/001 [DOI] [PubMed] [Google Scholar]
- 27.Sun Z. The promise of synchrotron radiation in medical science. Australasian Med J 2009;1:1-5. 10.4066/AMJ.2009.68 [DOI] [Google Scholar]
- 28.Bertrand B, Esteve F, Elleaume H, Nemoz C, Fiedler S, Bravin A, Berruyer G, Brochard T, Renier M, Machecourt J, Thomlinson W, Le Bas JF. Comparison of synchrotron radiation angiography with conventional angiography for the diagnosis of in-stent restenosis after percutaneous transluminal coronary angioplasty. Eur Heart J 2005;26:1284-91. 10.1093/eurheartj/ehi165 [DOI] [PubMed] [Google Scholar]
- 29.Bonanno G, Coppo S, Modregger P, Pellegrin M, Stuber A, Stampanoni M, Mazzolai L, Stuber M, van Heeswijk RB. Ultra-high resolution 3D imaging of atherosclerotic in mice with synchrotron differential phase contrast: a proof of concept study. Sci Rep 2015;5:11980. 10.1038/srep11980 [DOI] [PMC free article] [PubMed] [Google Scholar]
- 30.Zhang MQ, Zhou L, Deng QF, Xie YY, Xiao TQ, Cao YZ, Zhang JW, Chen XM, Yin XZ, Xiao B. Ultra-high-resolution 3D digitalized imaging of the cerebral angioarchitecture in rats using synchrotron radiation. Sci Rep 2015;5:14982. 10.1038/srep14982 [DOI] [PMC free article] [PubMed] [Google Scholar]
- 31.Sun Z, Ng CK. Synchrotron radiation imaging of aortic stent grafting: an in vitro phantom study. J Med Imaging Health Inform 2017;7:890-6. 10.1166/jmihi.2017.2094 [DOI] [Google Scholar]
- 32.Sun Z, Ng CK. Use of synchrotron radiation to accurately assess cross-sectional area reduction of the aortic branch ostia caused by suprarenal stent wires. J Endovasc Ther 2017;24:870-9. 10.1177/1526602817732315 [DOI] [PubMed] [Google Scholar]
- 33.Sun Z, Ng CK, Sa Dos Reis C. Synchrotron radiation computed tomography versus conventional computed tomography for assessment of four types of stent grafts used for endovascular treatment of thoracic and abdominal aortic aneurysms. Quant Imaging Med Surg 2018;8:609-20. 10.21037/qims.2018.07.05 [DOI] [PMC free article] [PubMed] [Google Scholar]
- 34.Kalisz K, Buethe J, Saboo SS, Abbara S, Halliburton S, Rajiah P. Artifacts at cardiac CT: Physics and solutions. Radiographics 2016;36:2064-83. 10.1148/rg.2016160079 [DOI] [PubMed] [Google Scholar]
- 35.Xu L, Sun Z. Virtual intravascular endoscopy visualization of calcified coronary plaques: a novel approach of identifying plaque features for more accurate assessment of coronary lumen stenosis. Medicine 2015;94:e805. 10.1097/MD.0000000000000805 [DOI] [PMC free article] [PubMed] [Google Scholar]
- 36.Sun Z, Dosari SA, Ng C, al-Muntashari A, Almaliky S. Multislice CT virtual intravascular endoscopy for assessing pulmonary embolisms: a pictorial review. Korean J Radiol 2010;11:222-30. 10.3348/kjr.2010.11.2.222 [DOI] [PMC free article] [PubMed] [Google Scholar]
- 37.Sun Z, Dimpudus FJ, Nugroho J, Adipranoto JD. CT virtual intravascular endoscopy assessment of coronary artery plaques: a preliminary study. Eur J Radiol 2010;75:e112-9. 10.1016/j.ejrad.2009.09.007 [DOI] [PubMed] [Google Scholar]
- 38.Gebhard C, Fiechter M, Fuchs TA. Coronary artery calcium score influence of adaptive statistical iterative reconstruction using 64 MDCT. Int J Cardiol 2013;167:2932-7. 10.1016/j.ijcard.2012.08.003 [DOI] [PubMed] [Google Scholar]
- 39.Li P, Xu L, Yang L, Wang R, Hsieh J, Sun Z, Fan Z, Leipsic JA. Blooming artifact reduction of coronary artery calcification by a novel de-blooming algorithm in coronary CT angiography: Initial study. Sci Rep 2018;8:6945. 10.1038/s41598-018-25352-5 [DOI] [PMC free article] [PubMed] [Google Scholar]
- 40.Takagi H, Tanaka R, Nagata K, Ninomiya R, Arakita K, Schuijf JD, Yoshioka K. Diagnostic performance of coronary CT angiography with ultra-high-resolution CT: Comparison with invasive coronary angiography. Eur J Radiol 2018;101:30-7. 10.1016/j.ejrad.2018.01.030 [DOI] [PubMed] [Google Scholar]
- 41.Motoyama S, Ito H, Sarai M, Nagahara Y, Miyajima K, Matsumoto R, Doi Y, Kataoka Y, Takahashi H, Ozaki Y, Toyama H, Katada K. Ultra-high-resolution computed tomography angiography for assessment of coronary artery stenosis. Circ J 2018;82:1844-51. 10.1253/circj.CJ-17-1281 [DOI] [PubMed] [Google Scholar]
- 42.Huda W, Scalzetti EM, Levin G. Technique factors and image quality as functions of patient weight at abdominal CT. Radiology 2000;217:430-5. 10.1148/radiology.217.2.r00nv35430 [DOI] [PubMed] [Google Scholar]
- 43.Sun Z, Squelch A. Patient-specific 3D printed models of aortic aneurysm and aortic dissection. J Med Imaging Health Inform 2017;7:886-9. 10.1166/jmihi.2017.2093 [DOI] [Google Scholar]
- 44.Giannopoulos AA, Steigner ML, George E, Barile M, Hunsaker AR, Rybicki FJ, Mitsouras D. Cardiothoracic applications of 3-dimensional printing. J Thorac Imaging 2016;31:253-72. 10.1097/RTI.0000000000000217 [DOI] [PMC free article] [PubMed] [Google Scholar]
- 45.Sun Z, Lee SY. A systematic review of 3D printing in cardiovascular and cerebrovascular diseases. Anatol J Cardiol 2017;17:423-35. [DOI] [PMC free article] [PubMed] [Google Scholar]
- 46.Lau IWW, Liu D, Xu L, Fan Z, Sun Z. Clinical value of patient-specific three-dimensional printing of congenital heart disease: Quantitative and qualitative assessments. Plos One 2018;13:e0194333. 10.1371/journal.pone.0194333 [DOI] [PMC free article] [PubMed] [Google Scholar]
- 47.Lau I, Sun Z. Three-dimensional printing in congenital heart disease: A systematic review. J Med Radiat Sci 2018;65:226-36. 10.1002/jmrs.268 [DOI] [PMC free article] [PubMed] [Google Scholar]
- 48.Valverde I, Gomez-Ciriza G, Hussain T, Suarez-Mejias C, Velasco-Forte MN, Byrne N, Ordoñez A, Gonzalez-Calle A, Anderson D, Hazekamp MG, Roest AAW, Rivas-Gonzalez J, Uribe S, El-Rassi I, Simpson J, Miller O, Ruiz E, Zabala I, Mendez A, Manso B, Gallego P, Prada F, Cantinotti M, Ait-Ali L, Merino C, Parry A, Poirier N, Greil G, Razavi R, Gomez-Cia T, Hosseinpour AR. Three-dimensional printed models for surgical planning of complex congenital heart defects: an international multicentre study. Eur J Cardiothorac Surg 2017;52:1139-48. 10.1093/ejcts/ezx208 [DOI] [PubMed] [Google Scholar]


