

Abstract
The TOMM40‐APOE variants are known for their strong, antagonistic associations with Alzheimer's disease and body weight. While a stronger role of the APOE than TOMM40 variants in Alzheimer's disease was suggested, comparative contribution of the TOMM40‐APOE variants in the regulation of body weight remains elusive. We examined additive effects of rs2075650 and rs157580 TOMM40 variants and rs429358 and rs7412 APOE variants coding the ε2/ε3/ε4 polymorphism on body mass index (BMI) in age‐aggregated and age‐stratified cohort‐specific and cohort‐pooled analysis of 27,863 Caucasians aged 20–100 years from seven longitudinal studies. Minor alleles of rs2075650, rs429358, and rs7412 were individually associated with BMI (β = −1.29, p = 3.97 × 10⁻⁹; β = −1.38, p = 2.78 × 10⁻¹⁰; and β = 0.58, p = 3.04 × 10⁻², respectively). Conditional analysis with rs2075650 and rs429358 identified independent BMI‐lowering associations for minor alleles (β = −0.63, p = 3.99 × 10⁻² and β = −0.94, p = 2.17 × 10⁻³, respectively). Polygenic mega‐analysis identified additive effects of the rs2075650 and rs429358 heterozygotes (β = −1.68, p = 3.00 × 10⁻⁹), and the strongest BMI‐lowering association for the rs2075650 heterozygous and rs429358 minor allele homozygous carriers (β = −4.11, p = 2.78 × 10⁻³). Conditional analysis with four polymorphisms identified independent BMI‐lowering (rs2075650, rs157580, and rs429358) and BMI‐increasing (rs7412) associations of heterozygous genotypes with BMI. Age‐stratified conditional analysis revealed well‐powered support for a differential and independent association of the rs429358 heterozygote with BMI in younger and older individuals, β = 0.58, 95% confidence interval (CI) = −1.18, 2.35, p = 5.18 × 10⁻¹ for 3,068 individuals aged ≤30 years and β = −4.28, CI = −5.65, −2.92, p = 7.71 × 10⁻¹⁰ for 6,052 individuals aged >80 years. TOMM40 and APOE variants are independently and additively associated with BMI. The APOE ε4‐coding rs429358 polymorphism is associated with BMI in older individuals but not in younger individuals.
Keywords: age‐dependent effect, aging, ApoE polymorphism, body mass index, health span, lifespan, TOMM40
1. INTRODUCTION
Studies report that deviation from the normal body weight is associated with cognitive decline and development of dementia and Alzheimer's disease (AD) (Emmerzaal, Kiliaan, & Gustafson, 2015). Despite these results are challenged in Fitzpatrick et al. (2009), they suggest that there might be common underlying biological mechanisms involved in regulation of body weight and cognitive function and/or AD pathology (Hinney et al., 2014). The relationship between body weight and cognitive function is complex as it may vary with age from a positive relationship between mid‐life obesity and AD to a negative relationship in late life (Emmerzaal et al., 2015).
High throughput genotyping of large human samples provides an opportunity for designing well‐powered studies to examine whether the same genetic variants can be associated with body weight and AD. The 19q13.3 genomic region harboring the APOE (apolipoprotein E) and TOMM40 (translocase of outer mitochondrial membrane 40 homolog) genes represents an opportunity for such an analysis as it harbors pleiotropic variants conferring the strongest, well‐documented risk of AD and robust associations with BMI (body mass index, kg/m2) (Guo et al., 2013; Roses et al., 2010). Indeed, this locus harbors common APOE ε2/ε3/ε4 polymorphism, coded by rs429358 and rs7412 SNPs (single nucleotide polymorphisms). The APOE ε4 allele has been most consistently associated with AD in late life in various populations (Raichlen & Alexander, 2014). Genome‐wide association studies (GWAS) also report an AD‐increasing effect of the rs2075650 (TOMM40) minor allele and AD‐decreasing effect of the rs157580 (TOMM40) minor allele (Bao, Wang, & Mao, 2016; Harold et al., 2009). The association of rs2075650 with AD is often attributed (Yu et al., 2007) to linkage disequilibrium (LD) of this SNP with rs429358, which encodes the APOE ε4 allele.
Large‐scale meta‐analysis of populations of European ancestry reported a genome‐wide significant association of rs2075650 with BMI, with the AD‐risk‐increasing (minor) allele associated with smaller BMI (Guo et al., 2013). Whether the effect of this SNP should be attributed to TOMM40 or APOE and, particularly, to the ε4 allele, has not yet been addressed in large samples (Guo et al., 2013). Thus, we performed cohort‐specific and cohort‐pooled analysis of 27,863 participants from seven independent longitudinal studies to comprehensively examine the associations of rs2075650 and rs157580 TOMM40 variants and rs429358 and rs7412 variants coding the APOE ε2/ε3/ε4 polymorphism with BMI in a Caucasian ancestry population sample as well as in subpopulations of younger and older individuals.
2. RESULTS
Data on 27,863 participants were obtained from seven longitudinal cohort studies (ARIC, CHS, CARDIA, MESA, HRS, LLFS, and FHS) (see Section 4). Baseline measurements of BMI, the number of longitudinal measurements of BMI used in the analysis, and basic demographic information for the genotyped participants in each cohort and the pooled sample are presented in Supporting Information Table S1). Frequency distributions of genotypes for rs2075650, rs157580, rs429358, rs7412, and APOE ε2/ε3/ε4 (coded by rs429358 and rs7412, Supporting Information Table S2) polymorphisms are presented in Supporting Information Table S3. All polymorphisms were in Hardy–Weinberg equilibrium.
2.1. LD structure
The largest LD (r 2 = 49%) was observed between rs429358 and rs2075650 (Figure 1) and was due to clustering of minor alleles of these SNPs rather than their minor and major alleles (Supporting Information Tables S4A and S4G). In contrast, LD between rs157580 and rs429358 was more modest (r 2 = 8%) and due to depleted clustering of minor alleles of these SNPs and preferable clustering of their minor and major alleles (Supporting Information Tables S4B and S4H). For the other SNPs pairs, LD measured by r 2 was small. Lewontin's D' varied from 25% to 100% (Figure 1).
Figure 1.
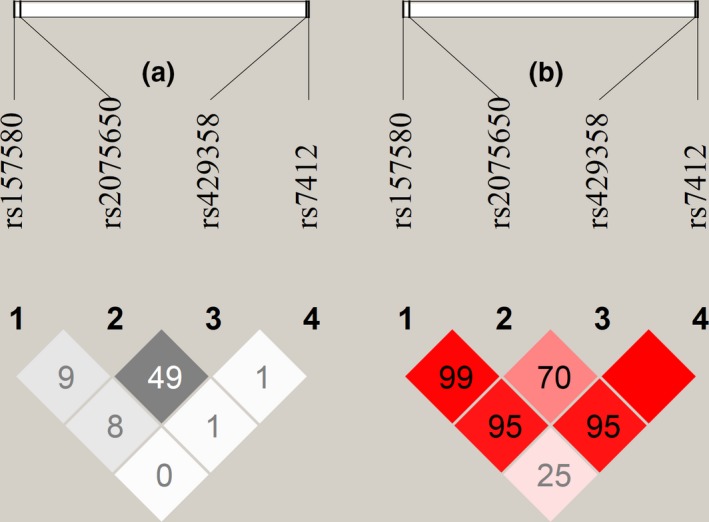
LD pattern of four SNPs in the TOMM40–APOE locus. LD (%), r 2 (a) and D' (b), is shown in the pooled sample of all cohorts
2.2. Univariate associations
In univariate analyses of single polymorphisms in the models, the rs2075650 minor allele was associated with decreased BMI in each cohort that resulted in a genome‐wide significant association in the pooled sample of all cohorts (β = −1.29, p = 3.97 × 10⁻⁹; Figure 2). The rs429358 minor allele, coding the APOE ε4 allele, showed the same‐direction genome‐wide significant effect in this sample (β = −1.38, p = 2.78 × 10⁻¹⁰). The rs7412 minor allele, coding the APOE ε2 allele, showed the opposite‐direction nominally significant effect in mega‐analysis (β = 0.58, p = 3.04 × 10⁻²). Mega‐analysis did not show significant association for rs157580 (β = 0.15, p = 0.303). The associations for the APOE ε2 allele, defined as the ε2ε2 or ε2ε3 genotypes, and the ε4 allele, defined as the ε3ε4 or ε4ε4 genotypes, resembled those for rs7412 and rs429358, respectively, except the association of ε2 allele with BMI was non‐significant (β = 0.46, p = 0.136). Mega‐analysis of the effects of each APOE genotype compared with the ε3ε3 genotype showed highly significant associations for the ε3ε4 (β = −1.41, p = 7.68 × 10⁻⁸) and ε4ε4 (β = −2.41, p = 3.32 × 10⁻³) genotypes and suggestive‐effect significance for the ε2ε3 genotype (β = 0.55, p = 8.26 × 10⁻²) (Table 1, Model 1).
Figure 2.
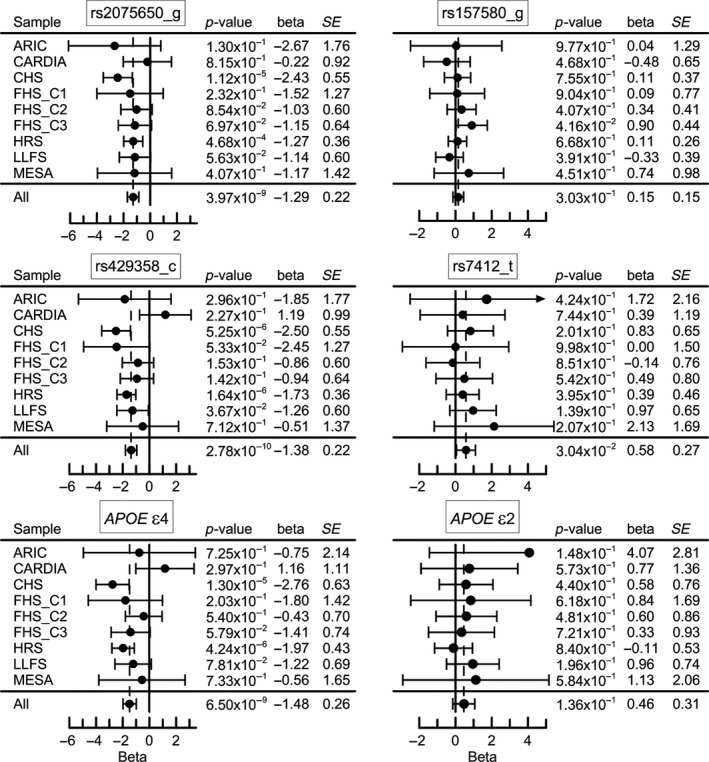
Genetic associations with BMI in each cohort and in the pooled sample of all cohorts (all). Associations of rs2075650 and rs157580 polymorphisms are from additive genetic model with minor allele as an effect allele. Statistical models for APOE were fitted considering the effect of the ε2 and ε4 alleles as compared with the ε3ε3 reference genotype. SE denotes standard error. Horizontal bars indicate 95% confidence intervals
Table 1.
Univariate and multivariate associations of selected polymorphisms with BMI in a mega sample of 27,863 individuals from seven longitudinal studies
| Polymorphism | Model 1 | Model 2 | Model 3 | Model 4 | Model 5 | ||||||||||
|---|---|---|---|---|---|---|---|---|---|---|---|---|---|---|---|
| β | SE | p‐value | β | SE | p‐value | β | SE | p‐value | β | SE | p‐value | β | SE | p‐value | |
| rs2075650a | −1.29 | 0.22 | 3.97E‐09 | −0.63 | 0.31 | 3.99E‐02 | −1.25 | 0.22 | 1.36E‐08 | −0.61 | 0.31 | 4.71E‐02 | −0.67 | 0.30 | 2.63E‐02 |
| rs157580a | 0.15 | 0.15 | 3.03E‐01 | ||||||||||||
| rs429358a | −1.38 | 0.22 | 2.78E‐10 | −0.94 | 0.31 | 2.17E‐03 | |||||||||
| rs7412a | 0.58 | 0.27 | 3.04E‐02 | 0.41 | 0.27 | 1.30E‐01 | |||||||||
| ε2ε2b | −1.23 | 1.30 | 3.45E‐01 | −1.28 | 1.30 | 3.27E‐01 | |||||||||
| ε2ε3b | 0.55 | 0.31 | 8.26E‐02 | 0.52 | 0.32 | 9.81E‐02 | |||||||||
| ε2ε4b | −0.66 | 0.71 | 3.54E‐01 | −0.27 | 0.74 | 7.20E‐01 | |||||||||
| ε3ε4b | −1.41 | 0.26 | 7.68E‐08 | −0.99 | 0.34 | 3.48E‐03 | |||||||||
| ε4ε4b | −2.41 | 0.82 | 3.32E‐03 | −1.56 | 0.92 | 9.26E‐02 | |||||||||
| ε2c | 0.46 | 0.31 | 1.36E‐01 | 0.43 | 0.31 | 1.63E‐01 | |||||||||
| ε4c | −1.48 | 0.26 | 6.50E‐09 | −0.98 | 0.34 | 3.97E‐03 | |||||||||
Model 1: Associations of rs2075650, rs157580, rs429358, rs7412, APOE genotypes, and APOE alleles separately. The APOE ε2 allele was defined as the ε2ε2 or ε2ε3 genotypes. The APOE ε4 allele was defined as the ε3ε4 or ε4ε4 genotypes. The ε2/ε4 genotype was excluded from definition of the ε2 or ε4 carrier status.
Model 2: Bivariate model of additive effects of rs2075650 and rs429358 SNPs.
Model 3: Bivariate model of additive effects of rs2075650 and rs7412 SNPs.
Model 4: Multivariate model of additive effects of rs2075650 and APOE genotypes.
Model 5: Multivariate model of additive effects of rs2075650 and APOE alleles.
Additive genetic model with minor allele as an effect allele.
Genotypic model for APOE with the ε3ε3 genotype as a reference.
Allelic model for APOE with the ε3ε3 genotype as a reference.
2.3. Independent associations of TOMM40 and APOE polymorphisms with BMI
Despite moderate LD between rs2075650 and rs429358 (Figure 1), bivariate mega‐analysis with these SNPs identified their independent associations with BMI, although their effects became smaller (Table 1, Model 2). Bivariate mega‐analysis with rs2075650 and rs7412 showed minor role of rs7412 in the association of rs2075650 with BMI (Table 1, Model 3). Conditional mega‐analysis with rs2075650 and APOE genotypes (Table 1, Model 4) or ε2 and ε4 alleles (Table 1, Model 5) resembled the results of the bivariate analysis. Association of rs2075650 with BMI, independent of the ε4 allele, was confirmed in the mega‐analysis of carriers of the ε3ε3 genotype only (β = −1.01, p = 2.65 × 10⁻²; Supporting Information Table S5).
Rs157580 did not attenuate the association of rs2075650, rs429358, rs7412, or ε2/ε3/ε4 polymorphisms with BMI (Supporting Information Table S6). The effect of rs157580 remained non‐significant but its direction changed aligning with the effect of the ε4 allele in all models except that with rs7412 (Supporting Information Table S6, Model 4).
Conditional mega‐analysis, with rs2075650, rs157580, rs429358, and rs7412 in the model, showed that all heterozygotes were independently associated with BMI (Table 2). Heterozygotes of rs2075650, rs429358, and rs157580 showed BMI‐lowering associations, whereas the rs7412 heterozygote (coding the APOE ε2ε3 and ε2ε4 genotypes) showed BMI‐increasing association. Conditional mega‐analysis with rs2075650, rs157580, and APOE genotypes did not show significant effects for either the ε2ε3 (β = 0.53, p = 9.25 × 10⁻²) or ε2ε4 (β = −0.11, p = 8.86 × 10⁻¹) genotypes alone (Supporting Information Table S7) implying that examination of rs429358 and rs7412 SNPs rather than the APOE genotypes can help in separating the effects of the ε2 and ε4 alleles. The rs429358 minor allele homozygote (coding the APOE ε4ε4 genotype) was significantly associated with smaller BMI, whereas the BMI‐lowering association for the minor allele homozygotes of the other SNPs did not attain significance (Table 2).
Table 2.
Conditional associations with BMI in a mega sample of 27,863 individuals when all four SNPs are included in a genotypic model
| Polymorphism | Heterozygote | Minor allele homozygote | ||||
|---|---|---|---|---|---|---|
| β | SE | p‐value | β | SE | p‐value | |
| rs2075650 | −0.83 | 0.34 | 1.35E‐02 | −0.33 | 1.03 | 7.48E‐01 |
| rs157580 | −0.56 | 0.23 | 1.53E‐02 | −0.19 | 0.33 | 5.65E‐01 |
| rs429358 | −0.90 | 0.34 | 7.61E‐03 | −2.27 | 1.02 | 2.59E‐02 |
| rs7412 | 0.57 | 0.29 | 4.81E‐02 | −1.25 | 1.30 | 3.39E‐01 |
Major allele homozygous genotype was the reference.
2.4. Polygenic associations
Mega‐analysis of compound genotypes composed of rs2075650 and rs429358 showed that the AA/Tc and Ag/TT genotypes were independently associated with BMI at nominal (β = −0.94, p = 3.63 × 10⁻²) and suggestive (β = −0.78, p = 8.67 × 10⁻²) levels of significance, respectively (Figure 3 and Supporting Information Table S8). The effect of the Ag/Tc heterozygous genotype was an additive (linear) superposition of the effects of the rs2075650_Tc and rs429358_Ag heterozygotes (β = −1.68, p = 3.00 × 10⁻⁹). Subjects carrying the Ag/cc compound genotype had the strongest BMI‐lowering association (β = −4.11, p = 2.78 × 10⁻³). This result is in qualitative agreement with the result of mega‐analysis of polygenic score composed of these SNPs, which identified the strongest effect for carriers of three minor alleles (β = −2.72, p = 5.59 × 10⁻³; Supporting Information Table S9, Model 1). However, specificity of the analyses of the polygenic score was poorer compared with the analyses of compound genotypes, as evidenced by smaller effect size in the latter case. Polygenic score composed of rs2075650, rs429358, and rs157580 SNPs supported significant BMI‐lowering associations for carriers of three (β = −2.29, p = 3.19 × 10⁻⁸) and four (β = −2.33, p = 3.08 × 10⁻²) minor alleles (Supporting Information Table S9, Model 2).
Figure 3.

Associations of compound genotypes composed of rs2075650 and rs429358 SNPs with BMI. (a) Effect sizes β and 95% confidence intervals for the most frequent compound genotypes. (b) Effect sizes β for all compound genotypes. Letters denote rs2075650/rs429358 genotypes. Upper‐ (lower‐) case letter denotes major (minor) allele. Common AA/TT genotype was the reference. Numbers 0, 1, and 2 code the number of minor alleles
2.5. Independent associations of rs2075650, rs157580, and APOE variants with BMI in younger and older individuals
Given uncertainty in defining “younger” and “older” people, we used varying cutoffs ranging from reproductive age (30 years) to the oldest‐old age (90 years) in 5‐year increments. We selected 30 and 90 years as global cutoffs because the analysis in groups of even younger and older ages was not sufficiently powered. In conditional analysis, with rs2075650, rs157580, rs429358, and rs7412 in the model, there were no significant differences between the effect estimates in younger and older carriers of the rs2075650 heterozygote at any given cutoff, as evidenced by well‐overlapped confidence intervals (CIs) (Figure 4a). Nevertheless, there was a trend for a decreased magnitude of the effect size with age from β = −0.84, p = 1.39 × 10⁻² for individuals older than 30 years to β = −0.28, p = 8.55 × 10⁻¹ for individuals older than 90 years. The effects were virtually age independent for carriers of the rs157580 heterozygote (Supporting Information Table S10).
Figure 4.
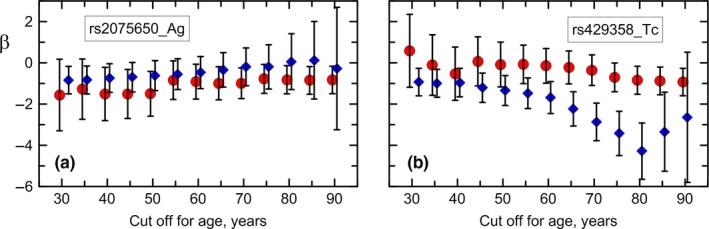
Independent associations of genetic variants with BMI in younger and older individuals. Cutoff shown on the x‐axis defines younger (red dots) and older (blue diamonds) individuals. Effect sizes β and 95% confidence intervals for (a) rs2075650_Ag and (b) rs429358_Tc heterozygotes in conditional analysis with rs2075650, rs157580, rs429358, and rs7412 in the model. Upper‐ (lower‐) case letter denotes major (minor) allele. Major allele homozygote was the reference. Numerical estimates are given in Supporting Information Table S10
In contrast, we observed significant differences between the associations of the rs429358 heterozygote with BMI in younger and older individuals starting at age of about 60 years (i.e., β = −0.15, CI = −0.99, 0.69, p = 7.32 × 10⁻¹ for individuals aged 60 years and younger and β = −1.69, CI = −2.46, −0.91, p = 1.94 × 10⁻⁵ for those who were older than 60 years; Figure 4b). There was an apparent trend for an increasing magnitude of the effect size for the older heterozygous carriers of rs429358 until the age of about 80 years, independent of rs2075650, rs157580, and rs7412. For example, for the rs429358 heterozygotes who were 30 years and younger, the effect was in positive direction and non‐significant (β = 0.58, CI = −1.18, 2.35, p = 5.18 × 10⁻¹), whereas for those who were older than 80 years it was in negative direction, large, and genome‐wide significant (β = −4.28, CI = −5.65, −2.92, p = 7.71 × 10⁻¹⁰). For individuals aged 85 years and older, the effect becomes smaller, although standard errors increase due to smaller sample sizes. These trends were similar for carriers of the rs429358 minor allele homozygotes (coding the APOE ε4ε4 genotype), although confidence intervals for most groups of older and younger subjects overlapped (Supporting Information Table S10). We did not observe significant differences between the effects in younger and older carriers of either the rs7412 genotypes (Supporting Information Table S10). The results were qualitatively the same in the models with the APOE genotypes and alleles.
3. DISCUSSION
This study presents the results of the largest analysis so far of the associations of TOMM40 (rs2075650 and rs157580) and APOE (rs429358 and rs7412 coding the ε2/ε3/ε4 polymorphism) variants with BMI in seven cohorts of participants ranging in age from early reproductive age (about 20 years) to centenarians. These analyses leveraged longitudinal information on BMI assessed at different ages and addressed the impact of TOMM40 and APOE variants in the age‐aggregated and age‐stratified samples of older and younger individuals defined using varying cutoffs ranging from 30 years (i.e., people who were younger and older than 30 years at BMI assessment) to 90 years.
Our age‐aggregated analysis shows that minor alleles of rs2075650 and rs429358 are individually associated with smaller BMI (β = −1.29, p = 3.97 × 10⁻⁹ and β = −1.38, p = 2.78 × 10⁻¹⁰, respectively) and the rs7412 minor allele is associated with larger BMI (β = 0.58, p = 3.04 × 10⁻²). Rs157580 did not show significant individual association with BMI. This analysis confirms BMI‐lowering association of the rs2075650 minor allele, first reported in Guo et al. (2013).
Given modest LD between rs2075650 and rs429358 (r 2 = 49% in our sample), the effect of rs2075650 is often considered as a proxy for that of the APOE ε4 allele. For example, studies of longevity indicate that strong effect of rs2075650 is likely due to the effect of the APOE isoforms (Murabito, Yuan, & Lunetta, 2012). Studies of AD also indicate that TOMM40 variants are unlikely to have a major effect on AD (Yu et al., 2007), although the role of TOMM40‐APOE haplotypes in AD is also acknowledged (Jazwinski et al., 2010; Lescai et al., 2011; Roses et al., 2010). The role of TOMM40 and APOE variants in body fat remains, however, unclear (Guo et al., 2013). Dissecting this role is important because overall body fatness is considered as a modifiable mid‐life risk factor for development of dementia and AD in late life whereas elevated BMI in late life may have beneficial effect on these conditions (Emmerzaal et al., 2015) while underweight may increase risk of progression to AD in older subjects over time (Joo et al., 2018).
Our conditional analysis with rs2075650 and rs429358 identified independent BMI‐lowering associations of their minor alleles, although the effect sizes (βs) for both SNPs became substantially smaller (β = −0.63, p = 3.99 × 10⁻² and β = −0.94, p = 2.17 × 10⁻³, respectively). Polygenic mega‐analysis of compound variants identified additive effects of heterozygotes of these two SNPs (β = −1.68, p = 3.00 × 10⁻⁹) and the strongest BMI‐lowering risk for carriers of the rs2075650 heterozygote and rs429358 minor allele homozygote (i.e., ε4ε4), β = −4.11, p = 2.78 × 10⁻³. The latter effect implies that carriers of these genotypes have 1.05 kg/m2 lower BMI compared with carriers of the major allele homozygotes. Mega‐analysis of polygenic score indicated the largest BMI‐lowering risks of three minor alleles of these SNPs, although it was smaller than that for compound genotypes. Accordingly, the analysis of compound variants was more useful in this study than that of polygenic score, constructed as sum of SNP‐unspecified minor alleles, because it identified specific genetic profile of people with strong predisposition to lower BMI.
Previous studies reported that TOMM40‐APOE variants other than rs2075650 may be involved in regulation of body fat (Lu et al., 2016). Our conditional analysis, with rs2075650, rs157580, rs429358, and rs7412 in the model, identified independent associations of all heterozygous genotypes (despite the lack of significant individual effect of rs157580) with BMI. The rs2075650, rs157580, and rs429358 heterozygotes were independently associated with lower BMI. Mega‐analysis of polygenic score composed of the rs2075650, rs429358, and rs157580 SNPs identified the largest BMI‐lowering risks of virtually the same size for carriers of three (β = −2.29, p = 3.19 × 10⁻⁸) and four (β = −2.33, p = 3.08 × 10⁻²) minor alleles, although these effects were about half of the strongest effect size for the rs2075650/rs429358 compound variants (see above). Consistent with previous studies (Tejedor, Garcia‐Sobreviela, Ledesma, & Arbones‐Mainar, 2014; Volcik et al., 2006), the rs7412 heterozygote was associated with higher BMI in the current analysis.
TOMM40 encodes a protein localized in the outer membrane of the mitochondria, which is a part of a complex for mitochondrial protein import (Endo & Yamano, 2010). Mitochondria are a major player in ATP production, maintaining energy balance, and disposal of reactive oxygen species. Excessive energy can disrupt mitochondrial function that affects lipid and glucose metabolism (Bournat & Brown, 2010). Disruption of mitochondrial transport, followed by mitochondrial dysfunction, might be hypothesized as a plausible mechanism for TOMM40 in regulation of adipocyte function and overall body fatness (Gómez‐Serrano et al., 2017). Studies suggest that APOE, a key protein in lipid metabolism, plays a role in adipocyte function. APOE has been implicated in the development of diet‐induced obesity (Elosua et al., 2003; Feitosa et al., 2006; Kypreos et al., 2009). The APOE isoforms can be involved in regulation of body fatness through differences in clearance of dietary fat (Kolovou, Damaskos, Anagnostopoulou, & Cokkinos, 2009; Koopal, van derGraaf, Asselbergs, Westerink, & Visseren, 2015). Mice studies suggest differential role of the APOE isoforms in digesting dietary energy (Arbones‐Mainar, Johnson, Altenburg, & Maeda, 2008; Huebbe et al., 2015; Kuhel et al., 2013). The mechanism of influence of APOE on body fat traits might be through modulation on triglyceride content of adipocytes (Kypreos et al., 2009; Li & Liu, 2014).
Our age‐stratified conditional analysis with rs2075650, rs157580, rs429358, and rs7412 in the model revealed well‐powered support for a differential association of the APOE ε4‐coding rs429358 variant with BMI in younger and older individuals, independent of rs2075650, rs157580, and rs7412. The effect of the rs429358 heterozygous genotype is most pronounced in individuals aged 60–80 years. No significant effect of this variant was observed in younger people in their early reproductive life (e.g., β = 0.58, CI = −1.18, 2.35, p = 5.18 × 10⁻¹ for people aged ≤30 years, N = 3,068) but it was strong and robust in older people (e.g., β = −4.28, CI = −5.65, −2.92, p = 7.71 × 10⁻¹⁰ for people aged >80 years, N = 6,052). Few previous studies examining associations of the APOE isoforms with body fat traits reported associations of the ε4 allele with decreased obesity in less‐fitted children (Ellis et al., 2011) and non‐significant trend in mid‐aged adults (Volcik et al., 2006). Our previous study identified lower BMI in older ε4 allele carriers compared with the non‐carriers in the FHS original cohort at ages >65 years (Yashin et al., 2013). The differential role of the APOE ε4 allele in BMI in younger and older individuals is consistent with differential role of the ε4 allele in total cholesterol with age (Kulminski et al., 2013) and with change of frequency of this allele with birth years (Nygaard et al., 2014). This is also in line with age‐specific associations of the ε4 allele with survival (Jacobsen et al., 2010; Tan et al., 2013), although this effect can be sex‐specific (Joshi et al., 2016; Kulminski et al., 2014). No significant age‐dependent associations of the TOMM40 SNPs and the APOE ε2 allele with BMI, that is difference in younger and older individuals, were identified. Although, there was a non‐significant trend on decreased magnitude of the effect for the rs2075650 older heterozygotes.
Our results on the differential role of the APOE ε4 allele in BMI in younger and older individuals contribute to better understanding of genetic architecture underlying differential role of elevated mid‐ and late‐life BMI in risks of AD and dementia (Emmerzaal et al., 2015). They suggest that the ε4 allele may provide late‐life‐specific contribution to increased risk of AD through the mechanism of regulation of body fat, as discussed above, that is consistent with increasing risk of AD with age in general population (Akushevich, Kravchenko, Ukraintseva, Arbeev, & Yashin, 2012) and higher risk for underweight subjects to develop AD in old age (Joo et al., 2018). These results warrant comprehensive longitudinal analysis of dynamic connections between body fat metabolism and progression to AD over the individuals’ life course. Such analysis is necessary to examine genetic predisposition to complex interplay of changes in the body composition with age, aging process, and time trends in obesity and incidence of AD.
The results for the APOE ε2/ε3/ε4 polymorphism resembled those for rs429358 and rs7412 SNPs. Examination of rs7412 was, however, more beneficial in this study because of the ability to better handle the associations for the ε2 and ε4 alleles.
Despite rigor of this study, there are potential limitations. First, although this is the largest study of additive effects of the TOMM40‐APOE locus SNPs to date, more accurate determination of associations for minor allele homozygous carriers and the associations at extreme ages requires larger samples. Second, we did not investigate the effect of secular trends in BMI, compositional changes in the studied cohorts during follow‐up, and potential role of behavioral factors.
Thus, in addition to confirmation of the BMI‐lowering association of the rs2075650 minor allele, this study provided three major insights. First, it identified that despite modest LD, rs2075650 and rs429358 SNPs were independently associated with lower levels of BMI. Second, the associations of these SNPs were of additive (i.e., complementary) nature. Third, this study revealed that the APOE ε4‐coding rs429358 SNP was associated with BMI in older individuals but not in younger individuals, independently of rs2075650, rs157580, and rs7412 SNPs. These results signify independent and additive roles of the APOE and TOMM40 genes in body fat regulation that indicates different (i.e., the APOE‐ and TOMM40‐related) mechanisms of such regulation in this locus. They also signify potential age‐sensitivity of the APOE‐related mechanism as the relationship of the APOE ε4 allele to BMI differs in younger and older subjects.
4. EXPERIMENTAL PROCEDURES
4.1. Accession numbers
This manuscript was prepared using a limited access datasets obtained though dbGaP. The dbGaP accession numbers are as follows: phs000007.v22.p8 (FHS), phs000280.v2.p1 (ARIC), phs000209.v12.p3 (MESA), phs000287.v3.p1 (CHS), phs000285.v3.p2 (CARDIA), and phs000428.v1.p1 (HRS). Phenotypic HRS data are available publicly and through restricted access from the University of Michigan https://hrsonline.isr.umich.edu/index.php?p = data.
4.2. Study cohorts
Data were obtained from seven longitudinal studies from the Atherosclerosis Risk in Communities (ARIC) study (Investigators, 1989), Cardiovascular Health Study (CHS) (Fried et al., 1991), Coronary Artery Risk Development in Young Adults (CARDIA) study (Friedman et al., 1988), Multi‐Ethnic Study of Atherosclerosis (MESA) (Blind et al., 2002), Health and Retirement Study (HRS) (Juster & Suzman, 1995), Long Life Family Study (LLFS) (Sebastiani et al., 2009), and Framingham Heart Study (FHS) (Splansky et al., 2007) cohorts for individuals of Caucasian ancestry. The FHS included three cohorts comprising parental (FHS_C1), offspring (FHS_C2), and grandchildren (FHS_C3) generations. Basic demographic information for the genotyped participants in the selected studies is provided in Supporting Information Table S1.
4.3. Genotypes
Rs2075650 and rs157580 SNPs from TOMM40 gene were available from Affymetrix (1 M SNPs) chip in the ARIC and MESA, Illumina CVDSNP55v1_A (50 K SNPs) chip in the CARDIA, CHS, and FHS, and Illumina HumanOmni 2.5 Quad chip (2.5 M SNPs) in the HRS and LLFS. Two SNPs coding the APOE ε2/ε3/ε4 polymorphism (ε2ε2, ε2ε3, ε2ε4, ε3ε3, ε3ε4, ε4ε4), rs7412 and rs429358, were available from Illumina Hiseq 2000 in ARIC and MESA, and the Taqman array in the LLFS. APOE in CARDIA, CHS, FHS_C1, and FHS_C2 were genotyped directly. Rs7412 and rs429358 for participants of the HRS and FHS_C3 were imputed (IMPUTE2) according to the 1000 Genomes Project Phase I integrated variant set release (SHAPEIT2) in the NCBI build 37 (hg19) coordinate with high accuracy (info >0.9).
The rs7412 and rs429358 minor alleles code the APOE ε2 and ε4 alleles, respectively (Supporting Information Table S2). This relationship is useful to unambiguously assign the APOE ε2ε4 genotype coded by the rs7412 and rs429358 heterozygotes. For comparison, we also defined the ε2 allele as ε2/ε2 or ε2/ε3 genotypes and the ε4 allele as ε3/ε4 or ε4/ε4 genotype excluding the ε2/ε4 genotype from definition of the ε2 or ε4 carrier status. Genotyping information for all polymorphisms is presented in Supporting Information Table S3.
Missing information on SNPs was excluded to have balanced samples with the same number of subjects for each SNP. Polygenic scores were defined as unweighted counts of minor alleles.
4.4. Analysis
Measurements of BMI were natural‐log‐transformed to offset potential bias due to skewness of their frequency distributions and multiplied by 100 for better resolution. BMI was measured multiple times during follow‐up of the same individuals in most cohorts (Supporting Information Table S1). We used all available measurements. Information on longitudinal measurements has multiple advantages including potential gain in statistical power in the analyses (Shi, Rice, Gu, & Rao, 2009). The analyses were performed in each cohort separately and the mega sample of all cohorts combined. To correct for repeated‐measurements (all cohorts) and familial (FHS and LLFS) correlations, we used the linear mixed effects model (lme4 package in R). We evaluated the associations for SNPs given the measurements of BMI for individuals of a given age at each examination with available measurements. Because of longitudinal follow‐up, the same individuals were used in age‐stratified analyses in “old” and/or “young” group depending on his/her age at BMI assessment. The models were adjusted for sex and birth cohorts. Potential inter‐study differences were handled by using mixed effects for studies. The models were not adjusted for principal components to control for population stratification in these Caucasian populations because of their trivial effects in these analyses.
CONFLICT OF INTEREST
The authors declare that they have no conflict of interest.
AUTHOR CONTRIBUTIONS
A.M.K. conceived and designed the experiment and wrote the paper; Y.L. performed statistical analyses and contributed to drafting of the paper; I.C. prepared data and performed bioinformatics analysis; J.H., K.G.A., and O.B. prepared data; M.F.F. J.M.Z., K.C., and A.I.Y. contributed to discussion of the intermediate and final results and drafting the manuscript.
Supporting information
ACKNOWLEDGMENTS
This work was supported by the National Institute on Aging (NIA) (grant numbers U01 AG023712, P01 AG043352, R01 AG047310), NIH, USA. The funding source did not participate in the writing of the manuscript or the decision to submit the manuscript for publication. See also Supplemental Acknowledgment Text. The authors thank Arseniy P. Yashkin for help in preparation of phenotypes in HRS.
Kulminski AM, Loika Y, Culminskaya I, et al. Independent associations of TOMM40 and APOE variants with body mass index. Aging Cell. 2019;18:e12869 10.1111/acel.12869
REFERENCES
- Akushevich, I. , Kravchenko, J. , Ukraintseva, S. , Arbeev, K. , & Yashin, A. I. (2012). Age patterns of incidence of geriatric disease in the U.S. Elderly population: Medicare‐based analysis. Journal of the American Geriatrics Society, 60, 323–327. 10.1111/j.1532-5415.2011.03786.x [DOI] [PMC free article] [PubMed] [Google Scholar]
- Arbones‐Mainar, J. M. , Johnson, L. A. , Altenburg, M. K. , & Maeda, N. (2008). Differential modulation of diet‐induced obesity and adipocyte functionality by human apolipoprotein E3 and E4 in mice. International Journal of Obesity, 32, 1595–1605. [DOI] [PMC free article] [PubMed] [Google Scholar]
- Bao, J. , Wang, X. , & Mao, Z. (2016). Associations Between genetic variants in 19p13 and 19q13 regions and susceptibility to Alzheimer disease: A meta‐analysis. Medical Science Monitor: International Medical Journal of Experimental and Clinical Research, 22, 234–243. 10.12659/MSM.895622 [DOI] [PMC free article] [PubMed] [Google Scholar]
- Blind, D. E., Bluemke,D. A. , Burke, G. L. , Detrano, R. , Diez Roux, A. V. , Folsom, A. R. , … Tracy, R. P. (2002). Multi‐ethnic study of atherosclerosis: Objectives and design. American Journal of Epidemiology, 156, 871–881. 10.1093/aje/kwf113 [DOI] [PubMed] [Google Scholar]
- Bournat, J. C. , & Brown, C. W. (2010). Mitochondrial dysfunction in obesity. Current Opinion in Endocrinology, Diabetes, and Obesity, 17, 446–452. [DOI] [PMC free article] [PubMed] [Google Scholar]
- Ellis, J. A. , Ponsonby, A.‐L. , Pezic, A. , Williamson, E. , Cochrane, J. A. , Dickinson, J. L. , & Dwyer, T. (2011). APOE genotype and cardio‐respiratory fitness interact to determine adiposity in 8‐year‐old children from the Tasmanian Infant Health Survey. PLoS One, 6, e26679 10.1371/journal.pone.0026679 [DOI] [PMC free article] [PubMed] [Google Scholar]
- Elosua, R. , Demissie, S. , Cupples, L. A. , Meigs, J. B. , Wilson, P. W. F. , Schaefer, E. J. , … Ordovas, J. M. (2003). Obesity modulates the association among APOE genotype, insulin, and glucose in men. Obesity Research, 11, 1502–1508. [DOI] [PubMed] [Google Scholar]
- Emmerzaal, T. L. , Kiliaan, A. J. , & Gustafson, D. R. (2015). 2003–2013: A decade of body mass index, Alzheimer's disease, and dementia. Journal of Alzheimer's Disease, 43, 739–755. [DOI] [PubMed] [Google Scholar]
- Endo, T. , & Yamano, K. (2010). Transport of proteins across or into the mitochondrial outer membrane. Biochimica Et Biophysica Acta, 1803, 706–714. 10.1016/j.bbamcr.2009.11.007 [DOI] [PubMed] [Google Scholar]
- Feitosa, M. F. , Rice, T. , North, K. E. , Kraja, A. , Rankinen, T. , Leon, A. S. , … Rao, D. C. (2006). Pleiotropic QTL on chromosome 19q13 for triglycerides and adiposity: The HERITAGE Family Study. Atherosclerosis, 185, 426–432. 10.1016/j.atherosclerosis.2005.06.023 [DOI] [PubMed] [Google Scholar]
- Fitzpatrick, A. L. , Kuller, L. H. , Lopez, O. L. , Diehr, P. , O'Meara, E. S. , Longstreth, W. T. Jr , & Luchsinger, J. A. (2009). Midlife and late‐life obesity and the risk of dementia: Cardiovascular health study. Archives of Neurology, 66, 336–342. 10.1001/archneurol.2008.582 [DOI] [PMC free article] [PubMed] [Google Scholar]
- Fried, L. P. , Borhani, N. O. , Enright, P. , Furberg, C. D. , Gardin, J. M. , Kronmal, R. A. , … Newman, A. (1991). The cardiovascular health study: Design and rationale. Annals of Epidemiology, 1, 263–276. 10.1016/1047-2797(91)90005-W [DOI] [PubMed] [Google Scholar]
- Friedman, G. D. , Cutter, G. R. , Donahue, R. P. , Hughes, G. H. , Hulley, S. B. , Jacobs, D. R. , … Savage, P. J. (1988). CARDIA: Study design, recruitment, and some characteristics of the examined subjects. Journal of Clinical Epidemiology, 41, 1105–1116. 10.1016/0895-4356(88)90080-7 [DOI] [PubMed] [Google Scholar]
- Gómez‐Serrano, M. , Camafeita, E. , López, J. A. , Rubio, M. A. , Bretón, I. , García‐Consuegra, I. , … Peral, B. (2017). Differential proteomic and oxidative profiles unveil dysfunctional protein import to adipocyte mitochondria in obesity‐associated aging and diabetes. Redox Biology, 11, 415–428. 10.1016/j.redox.2016.12.013 [DOI] [PMC free article] [PubMed] [Google Scholar]
- Guo, Y. , Lanktree, M. B. , Taylor, K. C. , Hakonarson, H. , Lange, L. A. , & Keating, B. J. (2013). Gene‐centric meta‐analyses of 108 912 individuals confirm known body mass index loci and reveal three novel signals. Human Molecular Genetics, 22, 184–201. 10.1093/hmg/dds396 [DOI] [PMC free article] [PubMed] [Google Scholar]
- Harold, D. , Abraham, R. , Hollingworth, P. , Sims, R. , Gerrish, A. , Hamshere, M. L. , … Williams, J. (2009). Genome‐wide association study identifies variants at CLU and PICALM associated with Alzheimer's disease. Nature Genetics, 41, 1088–1093. 10.1038/ng.440 [DOI] [PMC free article] [PubMed] [Google Scholar]
- Hinney, A. , Albayrak, O. , Antel, J. , Volckmar, A. L. , Sims, R. , Chapman, J. , … GIANT Consortium (2014). Genetic variation at the CELF1 (CUGBP, elav‐like family member 1 gene) locus is genome‐wide associated with Alzheimer's disease and obesity. American Journal of Medical Genetics. Part B, Neuropsychiatric Genetics: the Official Publication of the International Society of Psychiatric Genetics, 165B, 283–293. [DOI] [PubMed] [Google Scholar]
- Huebbe, P. , Dose, J. , Schloesser, A. , Campbell, G. , Glüer, C.‐C. , Gupta, Y. , … Rimbach, G. (2015). Apolipoprotein E (APOE) genotype regulates body weight and fatty acid utilization‐Studies in gene‐targeted replacement mice. Molecular Nutrition & Food Research, 59, 334–343. [DOI] [PubMed] [Google Scholar]
- Investigators, T. A. (1989). The atherosclerosis risk in communities (Aric) study – Design and objectives. American Journal of Epidemiology, 129, 687–702. [PubMed] [Google Scholar]
- Jacobsen, R. , Martinussen, T. , Christiansen, L. , Jeune, B. , Andersen‐Ranberg, K. , Vaupel, J. W. , & Christensen, K. (2010). Increased effect of the ApoE gene on survival at advanced age in healthy and long‐lived Danes: Two nationwide cohort studies. Aging Cell, 9, 1004–1009. 10.1111/j.1474-9726.2010.00626.x [DOI] [PMC free article] [PubMed] [Google Scholar]
- Jazwinski, S. M. , Kim, S. , Dai, J. , Li, L. , Bi, X. , … Jiang, J. C. (2010). HRAS1 and LASS1 with APOE are associated with human longevity and healthy aging. Aging Cell, 9, 698–708. 10.1111/j.1474-9726.2010.00600.x [DOI] [PMC free article] [PubMed] [Google Scholar]
- Joo, S. H. , Yun, S. H. , Kang, D. W. , Hahn, C. T. , Lim, H. K. , & Lee, C. U. (2018). Body Mass Index in mild cognitive impairment according to age, sex, cognitive intervention, and hypertension and risk of progression to Alzheimer's disease. Frontiers in Psychiatry, 9, 142 10.3389/fpsyt.2018.00142 [DOI] [PMC free article] [PubMed] [Google Scholar]
- Joshi, P. K. , Fischer, K. , Schraut, K. E. , Campbell, H. , Esko, T. , & Wilson, J. F. (2016). Variants near CHRNA3/5 and APOE have age‐ and sex‐related effects on human lifespan. Nature Communications, 7, 11174 10.1038/ncomms11174 [DOI] [PMC free article] [PubMed] [Google Scholar]
- Juster, F. T. , & Suzman, R. (1995). An overview of the health and retirement study. The Journal of Human Resources, 30, S7–S56. [Google Scholar]
- Kolovou, G. , Damaskos, D. , Anagnostopoulou, K. , & Cokkinos, D. V. (2009). Apolipoprotein E gene polymorphism and gender. Annals of Clinical and Laboratory Science, 39, 120–133. [PubMed] [Google Scholar]
- Koopal, C. , van derGraaf, Y. , Asselbergs, F. W. , Westerink, J. , & Visseren, F. L. J. (2015). Influence of APOE‐2 genotype on the relation between adiposity and plasma lipid levels in patients with vascular disease. International Journal of Obesity, 39, 265–269. [DOI] [PubMed] [Google Scholar]
- Kuhel, D. G. , Konaniah, E. S. , Basford, J. E. , McVey, C. , Goodin, C. T. , Chatterjee, T. K. , … Hui, D. Y. (2013). Apolipoprotein E2 accentuates postprandial inflammation and diet‐induced obesity to promote hyperinsulinemia in mice. Diabetes, 62, 382–391. 10.2337/db12-0390 [DOI] [PMC free article] [PubMed] [Google Scholar]
- Kulminski, A. M. , Arbeev, K. G. , Culminskaya, I. , Arbeeva, L. , Ukraintseva, S. V. , Stallard, E. , … Yashin, A. I. (2014). Age, gender, and cancer but not neurodegenerative and cardiovascular diseases strongly modulate systemic effect of the Apolipoprotein E4 allele on lifespan. PLoS Genetics, 10, e1004141 10.1371/journal.pgen.1004141 [DOI] [PMC free article] [PubMed] [Google Scholar]
- Kulminski, A. M. , Culminskaya, I. , Arbeev, K. G. , Ukraintseva, S. V. , Stallard, E. , Arbeeva, L. , & Yashin, A. I. (2013). The role of lipid‐related genes, aging‐related processes, and environment in healthspan. Aging Cell, 12, 237–246. 10.1111/acel.12046 [DOI] [PMC free article] [PubMed] [Google Scholar]
- Kypreos, K. E. , Karagiannides, I. , Fotiadou, E. H. , Karavia, E. A. , Brinkmeier, M. S. , Giakoumi, S. M. , & Tsompanidi, E. M. (2009). Mechanisms of obesity and related pathologies: Role of apolipoprotein E in the development of obesity. FEBS Journal, 276, 5720–5728. 10.1111/j.1742-4658.2009.07301.x [DOI] [PubMed] [Google Scholar]
- Lescai, F. , Chiamenti, A. M. , Codemo, A. , Pirazzini, C. , D'Agostino, G. , Ruaro, C. , Ghidoni, R. , … Franceschi, C. (2011). An APOE haplotype associated with decreased epsilon4 expression increases the risk of late onset Alzheimer's disease. Journal of Alzheimer's Disease, 24, 235–245. [DOI] [PubMed] [Google Scholar]
- Li, Y. H. , & Liu, L. (2014). Apolipoprotein E synthesized by adipocyte and apolipoprotein E carried on lipoproteins modulate adipocyte triglyceride content. Lipids in Health and Disease, 13, 136 10.1186/1476-511X-13-136 [DOI] [PMC free article] [PubMed] [Google Scholar]
- Lu, Y. , Day, F. R. , Gustafsson, S. , Buchkovich, M. L. , Na, J. , Bataille, V. , … Loos, R. J. (2016). New loci for body fat percentage reveal link between adiposity and cardiometabolic disease risk. Nature Communications, 7, 10495 10.1038/ncomms10495 [DOI] [PMC free article] [PubMed] [Google Scholar]
- Murabito, J. M. , Yuan, R. , & Lunetta, K. L. (2012). The search for longevity and healthy aging genes: Insights from epidemiological studies and samples of long‐lived individuals. The Journals of Gerontology Series A: Biological Sciences and Medical Sciences, 67, 470–479. 10.1093/gerona/gls089 [DOI] [PMC free article] [PubMed] [Google Scholar]
- Nygaard, M. , Lindahl‐Jacobsen, R. , Soerensen, M. , Mengel‐From, J. , Andersen‐Ranberg, K. , Jeune, B. , … Christensen, K. (2014). Birth cohort differences in the prevalence of longevity‐associated variants in APOE and FOXO3A in Danish long‐lived individuals. Experimental Gerontology, 57, 41–46. 10.1016/j.exger.2014.04.018 [DOI] [PMC free article] [PubMed] [Google Scholar]
- Raichlen, D. A. , & Alexander, G. E. (2014). Exercise, APOE genotype, and the evolution of the human lifespan. Trends in Neurosciences, 37, 247–255. [DOI] [PMC free article] [PubMed] [Google Scholar]
- Roses, A. D. , Lutz, M. W. , Amrine‐Madsen, H. , Saunders, A. M. , Crenshaw, D. G. , Sundseth, S. S. , … Reiman, E. M. (2010). A TOMM40 variable‐length polymorphism predicts the age of late‐onset Alzheimer's disease. The Pharmacogenomics Journal, 10, 375–384. 10.1038/tpj.2009.69 [DOI] [PMC free article] [PubMed] [Google Scholar]
- Sebastiani, P. , Hadley, E. C. , Province, M. , Christensen, K. , Rossi, W. , Perls, T. T. , & Ash, A. S. (2009). A family longevity selection score: Ranking sibships by their longevity, size, and availability for study. American Journal of Epidemiology, 170, 1555–1562. 10.1093/aje/kwp309 [DOI] [PMC free article] [PubMed] [Google Scholar]
- Shi, G. , Rice, T. K. , Gu, C. C. , & Rao, D. C. (2009). Application of three‐level linear mixed‐effects model incorporating gene‐age interactions for association analysis of longitudinal family data. BMC Proceedings, 3(Suppl 7), S89 10.1186/1753-6561-3-s7-s89 [DOI] [PMC free article] [PubMed] [Google Scholar]
- Splansky, G. L. , Corey, D. , Yang, Q. , Atwood, L. D. , Cupples, L. A. , Benjamin, E. J. , … Levy, D. (2007). The third generation cohort of the national heart, lung, and Blood Institute's Framingham Heart Study: Design, recruitment, and initial examination. American Journal of Epidemiology, 165, 1328–1335. 10.1093/aje/kwm021 [DOI] [PubMed] [Google Scholar]
- Tan, Q. , Jacobsen, R. , Sørensen, M. , Christiansen, L. , Kruse, T. A. , & Christensen, K. (2013). Analyzing age‐specific genetic effects on human extreme age survival in cohort‐based longitudinal studies. European Journal of Human Genetics, 21, 451–454. 10.1038/ejhg.2012.182 [DOI] [PMC free article] [PubMed] [Google Scholar]
- Tejedor, M. T. , Garcia‐Sobreviela, M. P. , Ledesma, M. , & Arbones‐Mainar, J. M. (2014). The apolipoprotein E polymorphism rs7412 associates with body fatness independently of plasma lipids in middle aged men. PLoS One, 9, e108605 10.1371/journal.pone.0108605 [DOI] [PMC free article] [PubMed] [Google Scholar]
- Volcik, K. A. , Barkley, R. A. , Hutchinson, R. G. , Mosley, T. H. , Heiss, G. , Sharrett, A. R. , … Boerwinkle, E. (2006). Apolipoprotein E polymorphisms predict low density lipoprotein cholesterol levels and carotid artery wall thickness but not incident coronary heart disease in 12,491 ARIC study participants. American Journal of Epidemiology, 164, 342–348. 10.1093/aje/kwj202 [DOI] [PubMed] [Google Scholar]
- Yashin, A. I. , Arbeev, K. G. , Wu, D. , Arbeeva, L. S. , Kulminski, A. , Akushevich, I. , … Ukraintseva, S. V. (2013). How lifespan associated genes modulate aging changes: Lessons from analysis of longitudinal data. Frontiers in Genetics, 4, 3 10.3389/fgene.2013.00003 [DOI] [PMC free article] [PubMed] [Google Scholar]
- Yu, C. E. , Seltman, H. , Peskind, E. R. , Galloway, N. , Zhou, P. X. , Rosenthal, E. , … Schellenberg, G. D. (2007). Comprehensive analysis of APOE and selected proximate markers for late‐onset Alzheimer's disease: Patterns of linkage disequilibrium and disease/marker association. Genomics, 89, 655–665. [DOI] [PMC free article] [PubMed] [Google Scholar]
Associated Data
This section collects any data citations, data availability statements, or supplementary materials included in this article.
Supplementary Materials