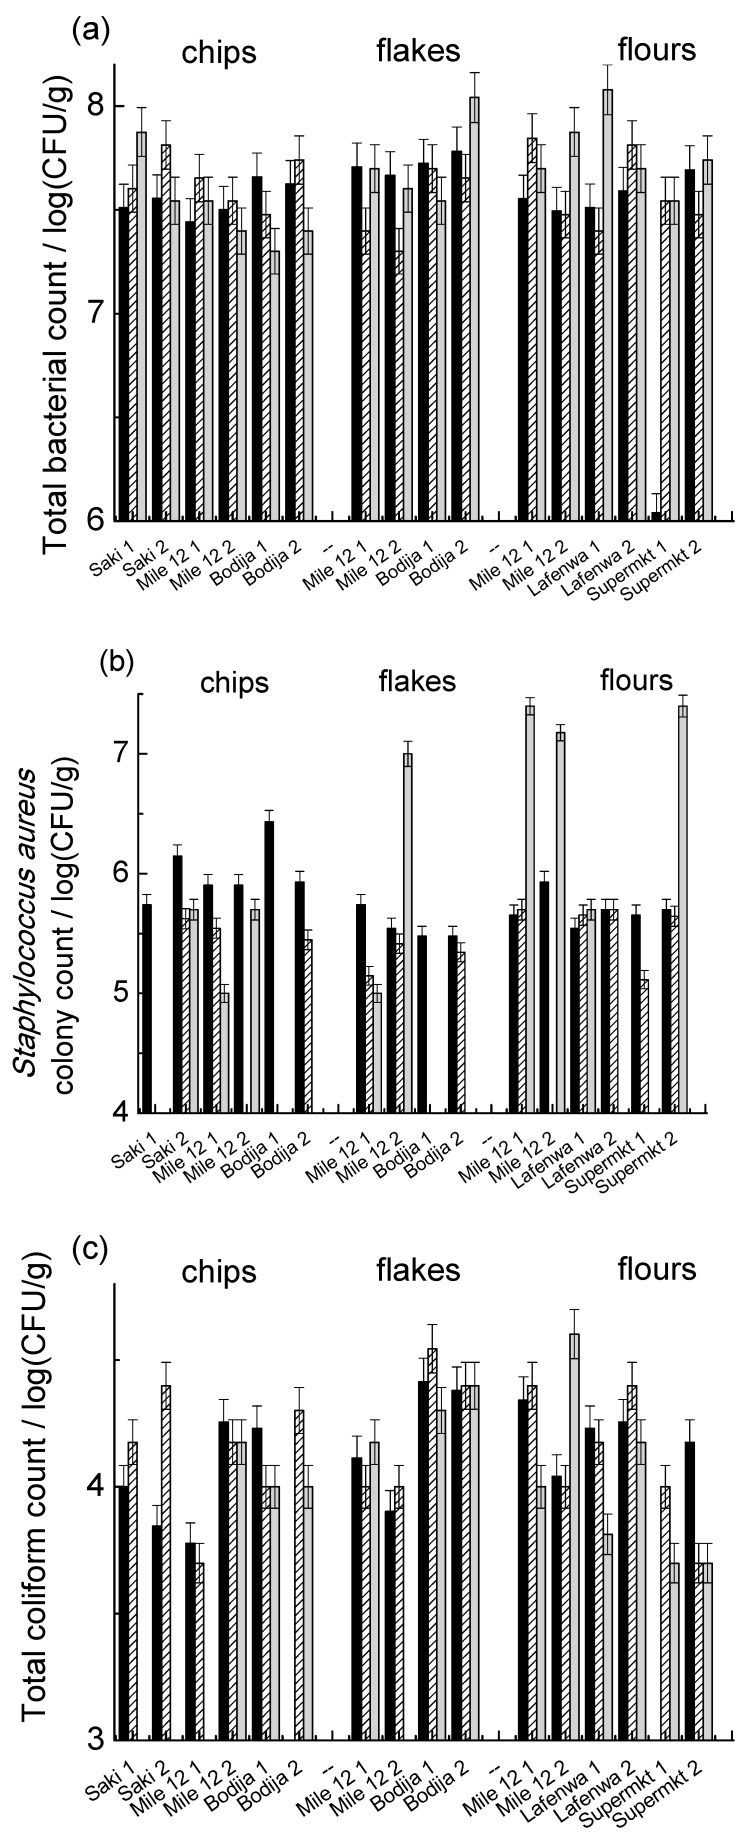
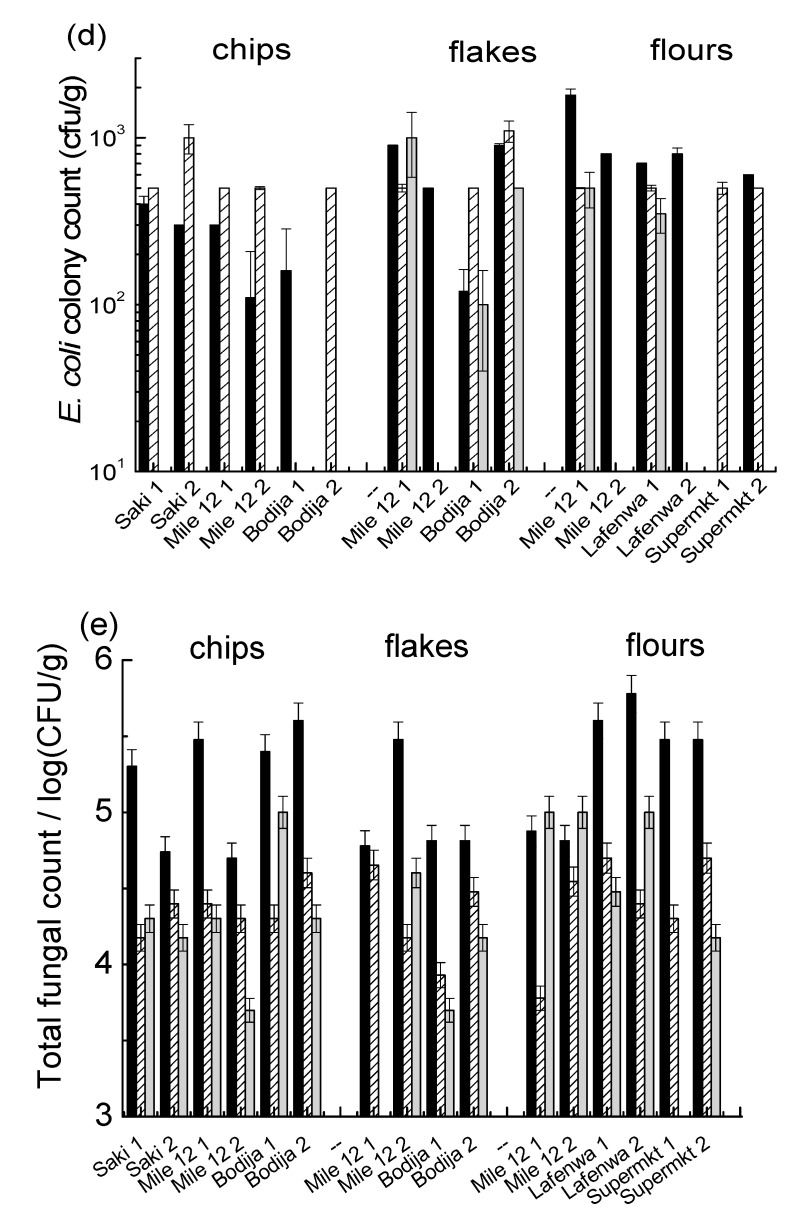
Figure 4.
Bacterial counts for chips, flakes, and flour yam samples purchased in different markets. (a) Total bacterial count; (b) Staphylococcus aureus; (c) total coliform; (d) Eshcerichia coli; (e) total fungal counts. The black, patterned, and grey columns correspond to batches A, B, and C, respectively.


