

Abstract
Significance: Optical imaging using the endogenous fluorescence of metabolic cofactors has enabled nondestructive examination of dynamic changes in cell and tissue function both in vitro and in vivo. Quantifying NAD(P)H and FAD fluorescence through an optical redox ratio and fluorescence lifetime imaging (FLIM) provides sensitivity to the relative balance between oxidative phosphorylation and glucose catabolism. Since its introduction decades ago, the use of NAD(P)H imaging has expanded to include applications involving almost every major tissue type and a variety of pathologies.
Recent Advances: This review focuses on the use of two-photon excited fluorescence and NAD(P)H fluorescence lifetime techniques in cancer, neuroscience, tissue engineering, and other biomedical applications over the last 5 years. In a variety of cancer models, NAD(P)H fluorescence intensity and lifetime measurements demonstrate a sensitivity to the Warburg effect, suggesting potential for early detection or high-throughput drug screening. The sensitivity to the biosynthetic demands of stem cell differentiation and tissue repair processes indicates the range of applications for this imaging technology may be broad.
Critical Issues: As the number of applications for these fluorescence imaging techniques expand, identifying and characterizing additional intrinsic fluorophores and chromophores present in vivo will be vital to accurately measure and interpret metabolic outcomes. Understanding the full capabilities and limitations of FLIM will also be key to future advances.
Future Directions: Future work is needed to evaluate whether a combination of different biochemical and structural outcomes using these imaging techniques can provide complementary information regarding the utilization of specific metabolic pathways.
Keywords: NADH, FAD, fluorescence, microscopy, redox ratio, FLIM
Introduction
Optical imaging has emerged as a valuable tool in biomedical research due to its flexibility in revealing morphological and biochemical details of cells and tissues through light–matter interactions that can include absorption, scattering, and fluorescence (39). This optical interrogation of cells and tissues is typically nondestructive, which can enable longitudinal evaluations of dynamic biological processes. One of the primary advantages of optical imaging is the ability to resolve subcellular detail with high-resolution microscopy techniques. Spectroscopic imaging techniques that measure optical signals at specific wavelengths, combined with the use of immunofluorescence labeling, have provided unparalleled specificity in exploring complex cellular processes. In addition to the use of standard exogenous dyes or stains, cells express a number of intrinsic fluorophores that play key roles in cellular metabolism and can be valuable in monitoring cellular and tissue metabolism (65).
In the 1950s, Britton Chance first began characterizing the intrinsic fluorescence of metabolic cofactors and subsequently defined the relationship between the redox state of respiratory enzymes and mitochondrial metabolism in vitro (13, 15). Cellular redox networks responsible for metabolic control are able to adapt to changing environments and maintain key single-cell and multicellular processes responsible for growth and homeostasis (42). Among various cellular cofactors, pyridine nucleotides and flavoproteins have been identified as reliable indicators of cell metabolism (15, 16). Nicotinamide adenine dinucleotide, a pyridine nucleotide serving as a major metabolic electron carrier, exists in a reduced (NADH), oxidized (NAD+), and phosphorylated (NADPH or NADP+) form throughout the cell. Similarly, the flavoprotein prosthetic group flavin adenine dinucleotide also is a metabolic electron carrier with a reduced (FADH2) and oxidized (FAD) form. Out of these redox cofactors, only NADH, NADPH, and FAD are autofluorescent, with NADH exhibiting the highest fluorescence intensity within cells (16). Quantifying the fluorescence signal of these cofactors can provide an estimate of metabolic activity, because metabolic potential coincides with the ratio of reduced and oxidized metabolic substrates (12, 16). High-resolution microscopy techniques enable a further understanding of the heterogeneity of dynamic changes in redox states within cells or tissues and may provide diagnostic insight previously unachieved through other methods.
This review highlights the advantages and disadvantages of the most widely used optical imaging modalities for NADH, NADPH, and FAD imaging, as well as their recent applications. Emphasis will be placed on recent work involving two-photon excited fluorescence (TPEF) and fluorescence lifetime imaging (FLIM). Recent research in the areas of cancer, neuroscience, tissue engineering, and other biomedical applications will be examined to highlight the wide applicability of using these endogenous labels to characterize disease states and tissue development.
Sources of Optical Contrast
NADH, NADPH, and FAD fluorescence can be isolated to provide optical contrast through the selection or filtering of specific excitation and emission bands (Table 1). Peak single-photon NADH and NADPH fluorescence emission can be observed between 440 and 470 nm using 330–360 nm excitation; the nearly identical emission spectra of NADH and NADPH can be attributed to their nicotinamide moieties and nearly identical structure (65). Because of their similar fluorescence characteristics, NADH and NADPH are often collectively referred to as NAD(P)H (28, 68). NAD(P)H transfers electrons through binding to various dehydrogenases, and whether the molecule is free or protein bound will affect its fluorescence quantum yield (i.e., the number of photons emitted relative to the number of photons absorbed). Typically, bound NAD(P)H has a higher quantum yield than free NAD(P)H, and emits at a higher intensity (14, 41). Measurements of the ratio of free to protein-bound NAD(P)H can be made through FLIM. The lifetime of a fluorophore is the average time spent in an excited state before emission, which is affected by the same radiative and nonradiative processes that also define quantum yield. The time constants reported from multiexponential fits of NAD(P)H fluorescence decay over several nanoseconds can be used to determine the relative proportions of bound and free NAD(P)H. When free, identical lifetimes for both NADH and NADPH have been reported to average around 0.4 ns. However, in the bound state, NADH(P)H mean lifetimes within cells are greater and typically range between 1.9 and 5.7 ns (7, 9, 11, 88). Such great variations in the lifetime of the bound state of NAD(P)H have been attributed to differences in NAD(P)H conformation in response to enzyme binding (9, 11, 93). Distinct NADH lifetimes have been shown following the binding of specific enzymes in solution, including lactate dehydrogenase (LDH), malate dehydrogenase, citrate synthase, and Complex I of the electron transport chain (ETC) (11, 25, 26, 49, 100). Since NADH and NADPH exhibit identical excitation and emission spectra, efforts to separate the two have been made utilizing FLIM, and it has been suggested NADPH has a distinct long fluorescence lifetime component that significantly contributes to average NAD(P)H fluorescence lifetime measurements (10).
Table 1.
Typical Characteristics of NAD(P)H and FAD Autofluorescence (7, 9, 11, 36–38, 45, 65, 84, 88, 102, 117)
| Fluorophore | 1-P peak excitation (nm) | 2-P peak excitation (nm) | Peak emission (nm) | Quantum yield | Lifetime (ns) |
|---|---|---|---|---|---|
| Bound NAD(P)H | 330–360 | <760 | 440–470 | — | 1.9–5.7 |
| Free NAD(P)H | 330–360 | <760 | 440–470 | 0.02 | 0.3–0.4 |
| Bound FAD | 360–465 | 725–760, 850–950 | 520–530 | — | 0.003–4.55 |
| Free FAD | 360–465 | 725–760, 850–950 | 520–530 | 0.033 | 2.3–2.9 |
FAD fluorescence is emitted at a peak of 520–530 nm when excited between 365 and 465 nm. Because photon absorption by NAD(P)H substantially decreases as excitation wavelengths are increased from 360 to 390 nm, FAD fluorescence can be isolated from NADH through the selection of a longer excitation wavelength. While protein binding to NAD(P)H causes an increase in fluorescence lifetime and quantum yield, protein binding of FAD to many protein complexes will typically cause significant quenching and a decrease in lifetime from 2.3 to 2.9 ns for its free state to <0.1 ns in its bound state (7, 37). This quenching effect has been attributed to the presence of tyrosine and tryptophan residues and affects most, but not all, flavoproteins (102). As a result of this quenching, the majority of flavoprotein fluorescence originates from lipoamide dehydrogenase (LipDH) and electron transfer flavoprotein (ETF), which, respectively, contribute 50% and 25% of observed FAD fluorescence (45–47, 65). Other flavoproteins involved in metabolism, such as succinate dehydrogenase (Complex II of the ETC), are considered negligible due to their extremely small contributions, and a final 25% of flavoprotein fluorescence is not connected to metabolism (47).
Intensity-Based Measurements and the Optical Redox Ratio
Early work by Britton Chance using a fluorimeter demonstrated an increase in NADH fluorescence intensity that corresponded to an increase in glycolysis (17). This seminal research has led to a variety of discoveries on mitochondrial function that rely on measurements of the fluorescence intensity of NAD(P)H and FAD. Chance went on to develop spectroscopic techniques applicable to intact tissues, pioneering in vivo redox state monitoring in the rat liver, kidney, and brain (15, 82). In the 1970s, he developed the Chance redox scanner, which can achieve automated three-dimensional (3D) metabolic scanning through point excitation of a frozen sample whose surface is revealed by progressive mechanical sectioning (76, 122). Nondestructive optical sectioning to permit 3D visualization has also been obtained through confocal microscopy. Confocal depth-resolved images of NADH fluorescence have been previously obtained from rabbit cornea (56, 69). Composite 3D images of NADH fluorescence have also been obtained from the brain as well as tumors; however, they still required mechanical sectioning of frozen samples (87, 129).
While the Chance redox scanner, epifluorescence microscopes, and laser scanning confocal microscopes can be used to detect NAD(P)H and FAD intensity, instrumentation has advanced significantly over the last 25 years, enabling deeper noninvasive 3D visualization of cell and tissue redox states. Specifically, the arrival of TPEF microscopy has been particularly advantageous for NAD(P)H and FAD imaging. In TPEF, molecules are brought to an excited state through the simultaneous absorption of two photons of half the energy and twice the wavelength (40). Therefore, near-infrared light can be used to excite NAD(P)H and FAD, rather than high-energy ultraviolet (UV) and near-UV light. Near-infrared light can penetrate farther through tissue, allowing TPEF imaging up to 0.3–1 mm below the surface depending on the tissue type, exceeding the capabilities of confocal microscopy (40). Furthermore, the probability of the near simultaneous absorption of two photons is, for all practical purposes, limited to the focal plane. This provides an intrinsic depth sectioning ability without the need for a confocal pinhole, allowing for closer detector placement within the microscope and more efficient light collection from highly scattering tissues (40). This intrinsic depth sectioning with TPEF imaging also eliminates the risk of out-of-plane photodamage. Due to these advantages, TPEF imaging is ideally suited for longitudinal in vitro and in vivo imaging of NAD(P)H and FAD without a significant risk of modifying their biochemical and physiological state.
For quantitative measures of fluorescence intensity, researchers have typically normalized their measurements using rhodamine or fluorescein standards (5, 33). This normalization of TPEF signals allows for comparisons between different laser power and detector gain settings. However, for deep 3D tissue imaging, this normalization does not account for signal loss due to the scattering properties of the tissue imaged. Implementation of an optical redox ratio of FAD/[NAD(P)H+FAD], originally proposed by Britton Chance, provides a convenient descriptor of metabolic state that is largely independent of scattering effects (16, 57). The optical redox ratio of FAD/[NAD(P)H+FAD] has been shown to be strongly correlated with the concentration ratio of NAD+/[NADH+NAD+] in multiple cell types (75, 105). A number of other groups have reported ratios of NADH/FAD or FAD/NADH, but the ratios of two variables following normal distributions will produce right-skewed data that deviate from a normal distribution and violate the assumptions of commonly used parametric statistical tests (e.g., analyses of variance) (62, 66). A ratio of FAD/[NAD(P)H+FAD] fluorescence, as originally proposed by Chance, is preferred because it will typically maintain a normal distribution and produces values bound between 0 and 1. To avoid confusion, all redox ratios referenced in this review are described in terms of a ratio of FAD/[NAD(P)H+FAD], regardless of their original published form.
One of the primary challenges with intensity-based measurements of NAD(P)H and FAD is that these intrinsic fluorophores have a quantum yield (Table 1) that is an order of magnitude lower than commonly used fluorophores such as rhodamine B (0.31–0.65) and fluorescein (∼0.9) (24, 27). Measuring the relatively weak fluorescence of NAD(P)H and FAD can be challenging in tissues where collagen or lipofuscin autofluorescence may be colocalized. Furthermore, in highly perfused tissues, such as the brain, hemodynamic changes can affect intensity-based measurements, such as an optical redox ratio, due to hemoglobin absorption. While imaging depth limitations of up to 1 mm have been achieved via TPEF approaches, in practice, imaging depths involving NAD(P)H rarely extend beyond 0.3 mm due to the highly scattering nature of most biological tissues. Furthermore, imaging depths can be even more limited for highly absorbing tissues, such as muscle.
Fluorescence Lifetime-Based Measurements
FLIM microscopy can overcome some of the challenges of intensity-based measurements because it can extract metabolic information using a single excitation wavelength, is independent of intensity, and sensitive to a variety of changes in the molecular microenvironment, such as pH, temperature, and viscosity (19). With NAD(P)H imaging, FLIM is typically used to determine the binding fraction of fluorophores based on their unique lifetimes in protein-bound and unbound states (32, 49) (Table 1). FAD fluorescence lifetimes are also sensitive to protein binding and NAD+ presence, however, the biological interpretation of these measurements is not well understood (21). NAD(P)H FLIM measurements can be an attractive alternative to the optical redox ratio for applications in which the hemodynamics of well-perfused organs can influence FAD measurements.
Spatially and temporally resolved measures of NAD(P)H and FAD can be performed in the frequency domain fluorescence lifetime imaging (FD-FLIM) or using an ultrafast laser and time-correlated single-photon counting (TCSPC) method (9, 128). FD-FLIM is based on measuring phase shifts and changes in modulation at various frequencies using intensity-modulated excitation and analyzing these shifts using a nonlinear least squares method (31, 34). However, with NAD(P)H and FAD autofluorescence, TCSPC is more frequently used. This technique creates a histogram of lifetimes by measuring the time between a laser pulse and the detection of an individual emitted photon (6). The arrival time of thousands of photons at each pixel is needed to obtain an accurate lifetime decay measurement, requiring integration times that often exceed 2 min (109). As a result, FLIM approaches are generally not suitable for applications that require the observation of rapid metabolic changes.
To analyze NAD(P)H FLIM data, biexponential models are commonly fit to the histogram at each pixel to obtain the decay curve,  , where I0 is the initial fluorescence intensity, τ1 andτ2 are, respectively, the short and long lifetime components, with A1 and A2 as their respective relative contributions to the total fluorescence (63). The relative contribution of one of the components (A1 or A2), the ratio of A1/A2, or the mean lifetime calculated from A1τ1
+ A2τ2 are all commonly used summary statistics to describe the lifetime decay of NADH (Fig. 1).
, where I0 is the initial fluorescence intensity, τ1 andτ2 are, respectively, the short and long lifetime components, with A1 and A2 as their respective relative contributions to the total fluorescence (63). The relative contribution of one of the components (A1 or A2), the ratio of A1/A2, or the mean lifetime calculated from A1τ1
+ A2τ2 are all commonly used summary statistics to describe the lifetime decay of NADH (Fig. 1).
FIG. 1.

Representative NAD(P)H fluorescence lifetime data. The average NAD(P)H lifetime map (A) of rat dermal fibroblasts is shown with the location of one pixel mapped to phasor space (B) and fit using a biexponential model in SPCImage (C). The linear scatter of all data in phasor space (labeled green) indicates an image with different combinations of predominantly two distinct lifetimes. The biexponential fit at a single pixel and the phasor plot indicate the presence of a short and long lifetime component that is characteristic of free and bound NAD(P)H, respectively. NADH(P)H was isolated with a 460 ± 20 nm emission filter using a Ti:sapphire laser (repetition rate of 80 MHz) at an excitation wavelength of 755 nm. To see this illustration in color, the reader is referred to the web version of this article at www.liebertpub.com/ars
Multiexponential fitting is prone to inaccurate measurements in image regions with low photon counts. To improve accuracy and/or reduce integration time, spatial or temporal binning may be performed (109). Multiexponential fits using more than two lifetime components are rarely used in NAD(P)H imaging due to concerns about the accuracy of the derived model parameters. Biexponential fitting distinguishes solely between free and bound forms of the cofactors, which is sufficient for many investigations into the metabolic state of cells (64). However, this biexponential model does not take into account variations in protein binding, such as differences in NADH interactions with different binding sites on various enzymes. As many groups have shown, the lifetime of bound NADH can vary greatly depending on the particular enzyme it is bound to, so the long lifetime time constant, τ2, is sometimes interpreted as an aggregate measure of all bound NADH lifetimes (10, 88, 98). Multiexponential fitting is often performed using Becker & Hickl's SPCImage software, however, other powerful software packages have emerged, including SLIM Curve (University of Oxford and University of Wisconsin-Madison), FAST (Edinburgh Photonics), and packages available through MATLAB and PicoQuant.
Given the variety of NAD(P)H lifetimes possible through different conformations and protein binding sites, interpretations in the literature of biexponential fits can often stretch beyond the assumption of two components (10, 22, 125, 126). In many applications involving multiple lifetime species, an attractive alternative to the biexponential fitting of NAD(P)H fluorescence lifetimes is phasor analysis, which avoids fitting data to any particular model. In phasor analysis, the lifetime decay data at each pixel are transformed to cosine (G) and sine (S) coordinates represented in a phasor plot (55, 93) (Fig. 1B). Typically, the phasor plot is displayed as a two-dimensional (2D) histogram with counts typically falling within a “universal circle” designated by  (55). Monoexponential lifetime decays will fall on the universal circle with the shortest possible lifetimes starting at (1,0) and the longest lifetimes along the circle at the origin (48, 55). More complex multiexponential decays will be transformed to a position within the space contained by the universal circle (48, 53, 55, 90). When two lifetime components are present within a pixel, all possible relative contributions of the two molecular species will fall along a straight line connecting the phasor locations of each species on the universal circle. The relative position of points along this “tie line” connecting the two components' phasors is related to the relative contributions of the two components (55, 93, 96). Similarly, in the case of three molecular species, possible phasor locations are contained within a triangle where the vertices correspond to phasors of the individual species (22). Thus, by observing the shape(s) of the pixel count distribution in phasor space, it may be possible to estimate the number of molecular species within an image. Segmentation or color coding of cells or tissue structures can also be performed based on unique locations in phasor space (93). Because phasor analysis does not require the assumption of a specific number of molecular species components and can provide insight into the number of species through the distribution in phasor space, it has emerged as a powerful tool in the analysis of NAD(P)H lifetime data.
Mitochondrial Organization Measurements
In addition to measuring the relative amounts of metabolic cofactors through an optical redox ratio and fluorescence lifetime, mitochondrial organization can be assessed from autofluorescence images. Mitochondria undergo fusion and fission in response to metabolic stress, and mitochondrial morphology is very dynamic depending on the metabolic demands of the cell (79, 116, 127). Because NADH and FAD concentrations are highest in the mitochondria, image analysis techniques can be used to evaluate the extent of mitochondrial clustering using these endogenous signals (16, 17, 51, 71, 75, 123). Mitochondrial clustering can be assessed through a 2D fast Fourier transform of the image. The 2D power spectral density (PSD) of the image is determined from the squared magnitude of the signal and can be reduced to one dimension by radial sampling. The average PSD as a function of spatial frequency can then be evaluated to assess the distribution of different feature sizes within the image.
In a variety of studies, the PSD-frequency curve obtained from NAD(P)H images has been fit to an inverse power law model (51, 71, 75, 123, 124). A power law fit across multiple orders of magnitude would correspond to the statistical properties of a self-similar fractal. However, frequently, fitting occurs over a shorter, predetermined frequency range corresponding to the length scales of mitochondria (71, 123, 124). The power law exponent from the fit can be used as a measure of clustering. Changes in this power law exponent have been detected following precancerous transformations and tissue ischemia (51, 71, 124). An alternative fitting approach identifying the range over which the PSD decays according to an inverse power law has also been used to identify changes in mitochondrial utilization during stem cell differentiation (75). These Fourier-based measurements are prone to errors associated with image features that do not follow a power law, such as nuclei and cell borders; however, preprocessing algorithms have been developed to minimize these effects (123). In addition, mitochondrial clustering within single segmented cells can be computed through more time-consuming autocorrelation calculations (54).
Roles of NAD(P)H and FAD in Cellular Metabolism
Interpretation of NAD(P)H and FAD fluorescence intensities, lifetimes, and organizational outcomes has been variable over the years, in part, due to the many different cell processes that can affect oxidation and reduction during cell metabolism. In general, catabolism brings electron carriers to their reduced form, while oxidative phosphorylation brings them to their oxidized state (104). Glycolysis produces a net two ATP, two pyruvate molecules, and reduces two molecules of NAD+ to NADH (Fig. 2). Pyruvate can then be shuttled into the mitochondria, where it is further broken down by pyruvate dehydrogenase complex (PDHC), producing acetyl CoA. During this process, electrons are transferred first to the autofluorescent FAD molecule bound to LipDH within the PDHC, producing FADH2 (47) (Fig. 2). LipDH serves as an intermediate electron carrier and hands off the electrons to available NAD+, producing NADH within the mitochondria. The acetyl CoA molecules can then enter the tricarboxylic acid (TCA) cycle, which will break down carbon-based molecules to CO2, while producing three NADH for every acetyl CoA (23). During this process, dehydrogenase complexes containing autofluorescent LipDH are also used as electron carriers. Complex I (NADH dehydrogenase) within the ETC oxidizes the NADH produced during catabolism (26) (Fig. 2). Through oxidative phosphorylation, electrons are handed off in a controlled manner to different enzyme complexes that use the energy to pump protons into the intermembrane space of the mitochondria. This process ends with oxygen as the final acceptor of electrons. The proton gradient that is produced between the inner mitochondrial membrane powers ATP production through ATP synthase. This process, involving NADH and FAD electron transfer, provides the most efficient conversion of energy from carbohydrate catabolism to ATP.
FIG. 2.

Simplified schematic of the roles NADH and autofluorescent flavins play in cell metabolism. Pathways associated with the catabolism of glucose will produce NADH, existing in a free form until binding to Complex I of the ETC or LDH. NADH is oxidized with ETC activity (oxidative phosphorylation) or LDH activity (fermentation). FAD bound to protein dehydrogenases, such as LipDH, serves as an intermediate electron carrier in equilibrium with the local NAD+/NADH. FAD associated with Complex II of the ETC produces negligible fluorescence and is not pictured. An increase in energy consumption without oxygen limitations will cause an increase in oxidative phosphorylation and reduction in NADH autofluorescence. Conversely, an increase in flux through biosynthetic pathways without a proportional ATP demand will cause an increase in NADH autofluorescence. ETC, electron transport chain; LDH, lactate dehydrogenase; LipDH, lipoamide dehydrogenase; PDHC, pyruvate dehydrogenase complex. To see this illustration in color, the reader is referred to the web version of this article at www.liebertpub.com/ars
In terminally differentiated cells, such as neurons or myocytes, efficient ATP production is valuable, and accordingly, these cells primarily rely on oxidative phosphorylation, producing a high baseline optical redox ratio of FAD/[NAD(P)H+FAD] (93, 96). Events that cause cell hypoxia will drive the redox ratio down as oxidative phosphorylation decreases and glycolysis increases in an effort to produce sufficient ATP. Under anaerobic glycolysis, NADH and pyruvate are converted to NAD+ and lactate through LDH to continue to break down more glucose and produce ATP (Fig. 2). The increase in free cytosolic NADH that occurs with anaerobic glycolysis not only decreases the optical redox ratio but also produces a decrease in the mean NAD(P)H lifetime (88).
Although hypoxia is a potent modulator of the optical properties of metabolic cofactors, glucose catabolism will also increase relative to oxidative phosphorylation during periods of biosynthesis with significant carbon demands. This increase in glycolysis despite the presence of oxygen was first noted by Otto Warburg nearly a century ago in cancer cells (103, 113, 114). Like the effects of hypoxia, the Warburg effect is associated with decreases in both the optical redox ratio and mean NAD(P)H lifetime of cells that have undergone substantial cancerous transformations (8, 66, 67, 83, 88). These optical changes are also observed in any noncancerous cells undergoing an increase in the rate of proliferation in response to disease or injury (50, 74, 104). The process of cellular differentiation also causes significant biosynthetic demands, and de novo fatty acid synthesis in particular will drive the optical redox ratio down (75). NADPH is also involved in biosynthesis and is the limiting factor in proliferation and lipid synthesis (70). Consequently, intracellular NADH concentrations are significantly greater than NADPH in cells undergoing biosynthesis (75). NADPH is also utilized in the maintenance of pools of glutathione, thioredoxin, and peroxiredoxins, which help to create a reductive environment after oxidative damage produced by processes such as inflammation or ischemia (70). Although our understanding of the relative contributions of NADPH, NADH, and FAD to metabolism is still emerging for many cell processes, the optical redox ratio and NAD(P)H fluorescence lifetime generally seem to correspond to changes in the rate of oxidative phosphorylation relative to glucose catabolism.
Applications
NAD(P)H and FAD autofluorescence imaging has been implemented in the study of disease states and tissue development over a wide range of applications since its initial optical characterization in the 1950s. Metabolic monitoring of cells and tissues in cancer, neuroscience, and tissue engineering has provided valuable information on the role metabolism plays in disease progression and tissue homeostasis. Findings in these areas have encouraged further fundamental inquiry of cellular processes and extended investigation into other physiological dysfunctions. Here, the current contribution of optical metabolic imaging (OMI) in each of these areas is presented by focusing on studies completed in the past 5 years.
Cancer
Metabolic monitoring of cancer cells through NAD(P)H and FAD imaging has helped to confirm the tendency of tumor cells to favor glycolytic activity even in the presence of sufficient oxygen, as originally reported by Warburg (114). Since its development in the 1970s, the Chance redox scanner continues to be used and was recently applied in distinguishing normal and non-normal breast tissue biopsies from cancer patients (120). Specifically, an increase in FAD fluorescence was observed in cancerous biopsies, with a 27% higher redox ratio than that of normal breast tissue (120, 121). However, more recent work has shown that breast cancer cell lines expressing (ER+) or lacking (ER−) estrogen receptors exhibit lower optical redox ratios in comparison to normal breast epithelial cells, with ER+ cells having a significantly lower redox ratio than ER− cells based on the redox ratio of FAD/(FAD+NADH) (66). While proliferative tumor cells exhibited a lower redox ratio compared with normal cells in those studies, triple negative breast cancer and melanoma cell lines with increasing metastatic potential will exhibit a higher FAD/(FAD+NADH) redox ratio than other cancer cell lines (2, 52, 97). One study also found a greater ability to shift between oxidative phosphorylation and glycolysis in metastatic cell lines in response to acute hypoxia, as measured through an optical redox ratio (2).
Early fluorescence lifetime studies of normal breast epithelial cells using TPEF imaging by Bird et al. correlated a decrease in the fluorescence lifetime of NADH with a decrease in the optical redox ratio and a decrease in oxygen consumption (8). This in vitro study was followed by further studies of carcinogenesis in vivo describing the decrease in bound NADH lifetime as a potential diagnostic marker of cancer (59, 77, 88). In rat fibrosarcoma W31 cells, lifetime distinctions between normal and cancerous cells were confirmed to be attributed to the changes in the bound state of NADH and FAD, not to changes in pH or refractive index (3). More recently, a clinical study found shorter mean NADH (1.22 ± 0.09 ns) and FAD lifetimes (2.61 ± 0.12 ns) in patient lung cancer samples compared to normal tissue (NADH 1.48 ± 0.06 ns, FAD 2.82 ± 0.11 ns) (112). Based on these findings, the authors proposed a mean lifetime criterion of 1.92 ns using the combined FLIM from NADH and FAD for safe resection assessment by surgeons (112).
The identification of different cell types within tumors is also possible based on metabolic signatures. Macrophages in breast tumors have been linked with cells exhibiting higher FAD fluorescence intensity in comparison with cancerous cells in whole tumors in vivo (98). These tumor-associated macrophages with a high FAD intensity also exhibited a shorter NADH mean lifetime, which is consistent with a glycolytic phenotype (98). Furthermore, fluorescence lifetime has also been used to confirm signaling influencing the Warburg effect (67). Pyruvate dehydrogenase kinase-1 (PDK1) is known to be a direct target of Wnt/β-catenin signaling that inhibits the flux of pyruvate to mitochondrial respiration. Phasor analysis of lifetime indicated a shift from bound to free NADH with PDK1 overexpression when Wnt signaling was impaired (67). A separate study demonstrated the dependence of the redox state of colon cancer tumors on p53 (118). HCT117 p53−/− colon cancer tumors were more oxidized in comparison with tumors with wild-type p53 present. p53-negative tumors also became increasingly oxidized as tumor size increased (118). In addition, the absence of PTEN has been linked to increased oxidative activity and metabolic heterogeneity in pancreatic premalignant lesions (119). The pancreas of PTEN-null mice (pdx1-Cre; PTENlox/lox) exhibited a higher redox ratio in comparison to controls (PTENlox/lox) when tissue depth-dependent changes in redox were taken into account (119).
TPEF-based NAD(P)H imaging has been used to study a number of different 3D in vitro models of cancer, which demonstrate a Warburg-like glycolytic phenotype. The rate of glycolysis in 3D engineered precancerous epithelial tissue equivalents composed of human foreskin keratinocytes (HFKs) was directly linked with their optical redox ratio and the relative concentrations of NADH, NAD+, and FAD (105). Human papillomavirus (HPV) 16-immortalized cells produced a lower optical redox ratio (0.45–0.5) compared to control tissue (0.55–0.6), while interestingly, the overexpression of the E7 oncoprotein in HFKs produced a higher optical redox ratio than normal HFKs. Low-oxygen conditions also lowered the redox ratio in those studies (105).
In evaluating treatment efficacy, organoids may be cultured and used as surrogates for in vivo head, neck, pancreatic ductal adenocarcinomas, as well as various breast cancer subtypes. A decrease in NAD(P)H fluorescence lifetime in these organoid models is consistent with in vivo responses to treatment with anticancer drugs cetuximab, cisplatin, and combination treatments for head and neck cancers, as well as combination treatments of trastuzumab and cisplatin for ER−breast cancer (86). An OMI index has been proposed as a sensitive metric to therapy responses and can be obtained by linearly combining the average redox ratio and NAD(P)H and FAD lifetimes (86, 106–108, 110). The OMI is correlated with cell proliferation and death after anticancer drug treatment (106, 108), can distinguish between breast cancer subtypes (107, 110), and is able to evaluate therapy responses after only 1 day (86, 106).
Both multiexponential fitting and phasor analysis have been used to evaluate NADH lifetimes in a recent study using 3D in vitro models of colorectal cancer (48). The sensitivity of their lifetime system was validated through potassium cyanide and hydrogen peroxide manipulations of oxidative phosphorylation, and found that NADH lifetime was also sensitive to increases in epidermal growth factor, which is known to induce cell proliferation and large cyst formation (48) (Fig. 3). Due to the general consistency in demonstrating the Warburg effect with lower redox ratios and shorter NAD(P)H fluorescence lifetimes representative of increased glucose catabolism across cancer types and models (Table 2), autofluorescence imaging offers promise as a high-throughput preclinical research tool.
FIG. 3.

The relative contribution of free NADH fluorescence (α1MEDF) in 3D caco-2 luminal cysts without (left) and with (right) EGF treatment. Data were obtained from a multiexponential decay fitting of FLIM data, and suggest EGF induces a glycolytic phenotype. 3D, three-dimensional; FLIM, fluorescence lifetime imaging. Figure modified from Lakner et al. (48). To see this illustration in color, the reader is referred to the web version of this article at www.liebertpub.com/ars
Table 2.
Summary of Optical Changes Reported Across Applications
| Activity | Redox ratio | Average NAD(P)H lifetime | Ratio free:bound NAD(P)H |
|---|---|---|---|
| Cancerous transformation (3, 48, 59, 66, 67, 77, 88, 105, 112, 118, 119) | ↓ | ↓ | ↑ |
| Increased metastatic potential (2, 52, 97) | ↑ | ||
| Response to cancer treatment (85, 86, 106–108, 110) | ↑ | ↓/↑ | ↓/↑ |
| Parkinson's disease (neurons) (96) | ↑ | ↓ | |
| Parkinson's disease (astrocytes) (96) | ↑ | ↑ | |
| Thermal stress (19) | ↑ | ↓ | |
| De novo fatty acid synthesis (18, 72, 75) | ↓ | ||
| Stem cell differentiation (29, 34, 60, 61, 75, 78, 92, 93, 95) | ↓/↑ | ↓/↑ | |
| Hepatitis C infection (58) | ↓ | ||
| Huntington's disease (80) | ↑ | ||
| Calorie restriction (111, 122) | ↑ | ||
| Myocardial infarction (89) | ↑ | ||
| Increased cellular proliferation (43, 73, 74) | ↓ | ↓ | |
| Effect of type I diabetes (1, 74) | ↓ | ||
| Antioxidant treatment for diabetes (1) | ↑ |
Neuroscience
While cell metabolism does not substantially differ in brain cells as in other cell types in the body, metabolism is specially regulated by glial cells, and metabolites play a double role as both signaling molecules and fuel (4, 81). The subcellular mechanisms involved in metabolic regulation are not fully understood, but noninvasive monitoring of metabolism has helped to elucidate previously unknown interactions through colocalization studies and the identification of unique NAD(P)H lifetime components.
NAD(P)H levels in the endoplasmic reticulum (ER) have been shown to be coupled to mitochondrial changes in substantia nigra dopaminergic neurons in rats (101). An increase in NAD(P)H fluorescence was observed in both mitochondria and the ER on mitochondrial uncoupling and disruption of the ETC. Mitochondria may communicate with the ER via a “pyridine nucleotide redox wire,” which can then influence the ER's redox state as a method of dealing with redox stress. This may allow mitochondria to influence cellular cholesterol synthesis as well as the unfolded protein response, which can trigger apoptotic pathways via regulation of Ca2+ (101). Cultured neurons and astrocytes were shown to be affected differently by manganese treatment, which can simulate conditions associated with Parkinson's disease (96). In that study, low redox ratios were associated with healthy glycolytic astrocytes, and high redox ratios were associated with healthy neurons that rely primarily on oxidative phosphorylation. Manganese-treated neurons displayed an increase in both the redox ratio and bound NADH lifetime components, as well as an increase in caspase-3, indicative of increased apoptosis. On the contrary, treated astrocytes displayed an increase in the redox ratio and a decrease in the bound NADH lifetime (96). These findings are consistent with the glycolytic phenotype of glial cells and the reliance of neurons on oxidative phosphorylation.
Brain tissue oxygenation is extremely important in metabolic regulation, and astrocytes will change their mode of metabolism in response to oxygen levels, among other stimuli (30, 91). Use of an optical redox ratio in these in vivo studies has been very challenging due to the putative influence of hemoglobin absorption. Pericytes are crucial to the maintaining of oxygen levels that are sufficient for neuronal functional activity, with dysfunction contributing to reduced cerebral blood flow (44). In mice expressing loss-of-function, pericyte-deficient, platelet-derived growth factor receptor-β (Pdgfrb+/−), an increase in NADH fluorescence coincided with 28% lower lactate levels in comparison to healthy mice on hind limb stimulation. This could be explained by an increase in the use of astrocyte-produced lactate by neurons under low oxygenation (44). In addition, regional oxygenation of neural networks in the brain has been revealed to be dependent on aquaporin-4 (AQP4), which is the primary water channel located at the boundaries of the brain–blood and brain–cerebral spinal fluid barriers (99). Severe metabolic stress, such as induction of cortical spreading depression (CSD), can cause a loss of AQP4 function. CSD-affected areas had increases in NADH fluorescence only in hypoxic regions away from vasculature. This change in NADH fluorescence was greatest at the induction of CSD and but lasted longer in AQP4-deficient mice post-CSD (99).
Determining the binding state of NAD(P)H through fluorescence lifetime measurements is of particular interest in neuroscience, because it can provide metabolic information without potential hemodynamic artifacts. Four lifetime components were identified during the first TPEF-based NADH lifetime measurements of the rat cortex in vivo (125). These components could indicate specific oxidative phosphorylation pathways and were shown to differ between astrocytes, blood vessels, and synaptically dense regions. The four components were identified using a multiexponential fit, with two lifetimes constrained to a reference NADH solution (0.395 and 1 ns) and two obtained experimentally in vivo (1.7, 3.2 ns). Each of the components saw an increase in lifetime after a period of anoxia, with the shortest component showing the most dramatic increase. The third and fourth components are thought to be bound to mitochondrial enzymes, however, these two components are strongly detected in blood vessels (125). Further classification of these components in vivo indicated the possibility of identifying interactions among impaired metabolic processes (126).
NAD(P)H FLIM methods have also been used in monitoring the differentiation of progenitor cells toward neurons (Fig. 4). The ratio of free to bound NADH can distinguish cell fate decided in the E12 and E16 developmental stages in neural cells, which is not possible based solely on cell morphology or marker expression (94). During the E12 phase, neural progenitors have a higher free to bound NADH ratio and a shift toward glycolytic activity. In comparison, E16 has a lower free to bound NADH ratio, indicating a shift toward oxidative phosphorylation, and is descriptive of glial progenitors. In addition, differentiated neurons also can be distinguished from neural progenitor stem cells based on their reliance on oxidative phosphorylation (94). For both developmental and functional studies in neuroscience, NAD(P)H FLIM continues to emerge as a promising tool to understand metabolism.
FIG. 4.

The developmental stages of NPSCs can be distinguished from one another and from neurons using FLIM. The intensity images and FLIM maps of free to bound NADH of neurons and NPSCs in the E16 and E12 developmental stages are shown with their corresponding phasor FLIM distributions (A–C). The cell phasor scatter plot (D) evinces the M-trajectory (E) from glycolytic activity to oxidative phosphorylation of NPSCs in the E12 stage in red, E16 stage in blue, and neurons in green. M-trajectory, metabolic trajectory; NPSCs, neural progenitor stem cells. Figure taken from Stringari et al. (94). To see this illustration in color, the reader is referred to the web version of this article at www.liebertpub.com/ars
Tissue engineering and stem cell differentiation
The analysis of tissue-engineered constructs during development and before implantation is important in optimizing culture protocols and determining their viability for eventual use in humans. Traditional methods of determining viability, such as biochemical assays or histology, either lack any spatial resolution or are inherently destructive. Optical characterization of metabolic state within these constructs is an attractive method analysis due to nondestructive nature (19, 72).
The viability of an ex vivo produced oral mucosa equivalent (EVPOME) that is used in intraoral grafting was assessed using an optical redox ratio and FLIM (19, 20). Thermal or metabolic stress was induced in EVPOMEs to characterize the ability of NAD(P)H and FAD fluorescence imaging to detect nonviable samples. Both stressed constructs exhibited higher redox ratios compared to controls, with thermally stressed constructs having a greater bound NAD(P)H lifetime component (19). The authors suggested a redox ratio of 0.23 and a short lifetime component contribution (parameter A1) of 0.28 may be potential thresholds for discriminating thermally stressed constructs from controls.
Other studies have evaluated the differentiation status of cells within 3D adipose tissue constructs (18, 72, 115). Human adipose-derived stem cells seeded within a silk scaffold were continuously monitored over 6 months, exhibiting a decrease of ∼0.1 in the optical redox ratio over the first 2 months of culture, then returning to baseline redox ratio values over the final 4 months (72). In that study, a link between lipogenesis and the decrease in optical redox ratio was proposed, and follow-up work by the same authors later confirmed that the decrease in optical redox ratio during adipogenic differentiation is sensitive to the increased biosynthetic demands of de novo fatty acid synthesis (75) (Fig. 5). Additional follow-up studies demonstrated an ability to use an optical redox ratio to monitor 3D adipogenic culture status in a perfusion bioreactor (115), as well as monitor lipid droplet formation using a combination of TPEF and third-harmonic generation imaging (18). In addition to adipogenic differentiation, studies have reported decreases of varying magnitude in the optical redox ratio during osteogenic and chondrogenic differentiation (29, 60, 61, 75, 78). Interestingly, an elevated contribution of bound NADH was also reported in osteogenic cultures relative to undifferentiated stem cells and chondrogenic cultures (60).
FIG. 5.

Treatment of exogenous FAs during adipogenic differentiation attenuated the decrease in optical redox ratio associated with de novo FA synthesis. Figure modified from Quinn et al. (75). FA, fatty acid. To see this illustration in color, the reader is referred to the web version of this article at www.liebertpub.com/ars
Stem cell differentiation has also been monitored in vivo using NAD(P)H lifetime imaging (34, 92, 93). A decrease of free to bound NADH ratio was observed in the small intestine of mice, extending as a gradient from the base of the crypt to the top of villi (93). This decrease in free NADH is associated with a decrease in glycolytic metabolism of epithelial stem cells undergoing differentiation, following the same path from crypt to villi. In vivo monitoring of mouse and rat kidneys revealed that S1 and S2 tubules have distinct metabolic FLIM phasor signatures, with S1 tubules leaning toward free NADH and S2 toward bound NADH (34). In addition, phasor analysis revealed a shift toward bound NADH in the urinary lumen, more free NADH in the interstitium, and a glomerulus signature that was similar to tubules (34). The effect of the circadian clock on mouse epidermal basal layer stem cells was also studied in vivo (95). An increase in the free to bound NADH ratio at night indicated a shift to glycolytic activity. This coincided with an increase in the number of stem cells in S phase and is thought to be a mechanism for avoidance of DNA damage during the most vulnerable point in the cell cycle (95).
Collectively, these in vivo and in vitro studies in a variety of cell types demonstrate transient changes in the redox ratio and lifetime outcomes occurring during stem cell differentiation (Table 2). The observed changes during the process of differentiation generally indicate a sensitivity to increased glucose catabolism to satisfy the carbon requirements of macromolecule biosynthesis.
Other biomedical applications
While the majority of NAD(P)H imaging has focused on cancer, neuroscience, and tissue engineering research, the metabolic effects of other diseases and repair processes have been studied through these imaging techniques (Table 2).
FLIM showed, for the first time, the metabolic changes induced by the hepatitis C virus (HCV) in human hepatoma cells (Huh 7) (58). Cells were transfected with the core D2 protein from HCV, which upregulates lipid biosynthesis and the production of lipid droplets necessary for pathogenesis. D2-expressing cells had a lower average NAD(P)H lifetime, a decrease in free and bound NAD(P)H lifetimes, and a threefold increase in the ratio of free to bound NAD(P)H in comparison to nonexpressing cells (58).
FLIM also was utilized to characterize Huntington disease, a neurodegenerative disorder that is marked by expansion of glutamine repeats in exon 1 of the Huntingtin (HTT) protein and results in metabolic impairment (80). While conflicting reports exist regarding the metabolic changes associated with Huntington disease, researchers demonstrated a shift toward free NADH accompanied by a higher free to bound ratio of NADH in the nucleus of HEK293 cells and transgenic Drosophila, expressing expanded HTT exon1. This suggests a possible relationship between metabolic dysfunction and transcriptional regulation in Huntington disease (80).
Metabolic imaging has shown promise in understanding and detecting cardiovascular disease. Calorie restriction has been studied in relation to aging and has a protective effect against myocardial ischemia (111). The Chance redox scanner was utilized to obtain a 3D metabolic map of rat hearts to determine the effect of normal feeding or fasting conditions on bioenergetics (122). Fasting produced a homogeneous decrease in NADH by 28.6% with an increase in the optical redox ratio (∼0.474) in comparison to normal feeding (∼0.44) (122), consistent with a reduction in glucose catabolism relative to oxidative phosphorylation. Recently, valvular interstitial cell imaging revealed that a lower redox ratio is correlated with increased contractility and proliferation, which may provide an early marker of valve disease progression (50). A higher optical redox ratio in infarcted regions of the heart has also been reported with differences in infarct metabolism between fetal and preadolescent sheep (89). Insights into proregenerative metabolic phenotypes after myocardial infarction through TPEF, particularly in combination with second-harmonic generation (SHG) imaging of collagen, could contribute to the evaluation of treatments restoring function to damaged heart regions.
Monitoring tissue repair and regeneration through NAD(P)H imaging is not just limited to cardiac applications. Recent work has also demonstrated distinct temporal and spatial patterns of skin wound healing through TPEF and SHG imaging (Fig. 6) (43, 73). An overall lower redox ratio was found in the proliferative epidermis at the wound edge (0.559 ± 0.058) compared to noninjured regions (0.678 ± 0.024), and delayed healing in diabetic wounds was evident by a significantly lower redox ratio in the epidermis at later postwound time points (74). Furthermore, an overall lower redox ratio was observed in diabetic mice relative to controls, and these findings suggest the potential for optical biomarkers of impaired healing in diabetic wounds.
FIG. 6.
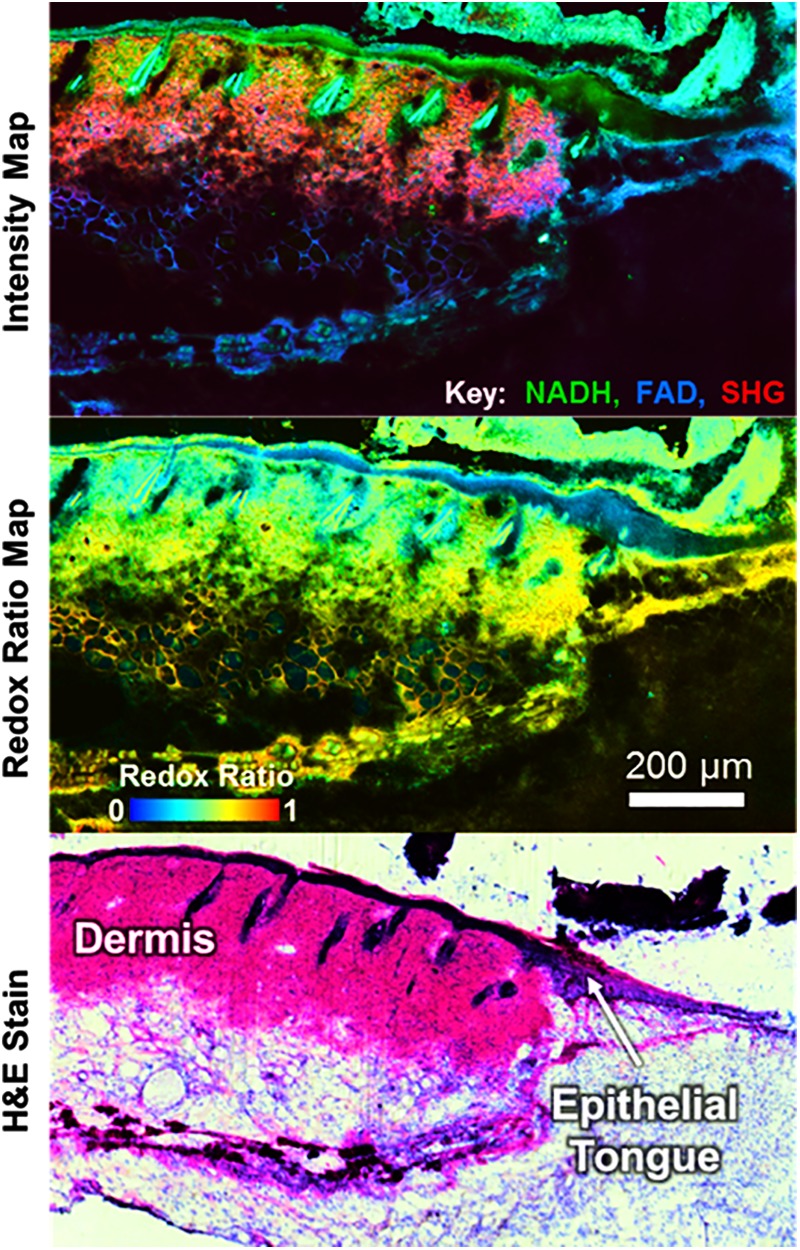
Maps of TPEF/SHG intensity and the optical redox ratio from an unstained skin wound section enable clear identification of the proliferative epithelial tongue at the edge of a skin wound. SHG, second-harmonic generation; TPEF, two-photon excited fluorescence. Images courtesy of Jake D. Jones and Kyle P. Quinn. To see this illustration in color, the reader is referred to the web version of this article at www.liebertpub.com/ars
An optical redox ratio may also have broader applications in evaluating treatments for diabetes. In the liver, a decrease in the optical redox ratio was observed in diabetic rats relative to normal controls, and this lower redox ratio was correlated with increased levels of glutathione, which is indicative of increased oxidative stress (1). Mulberry-mediated gold nanoparticles (MAuNPs) were administered to diabetic rats, and this treatment resulted in an increase in the redox ratio and restoration of glutathione levels, suggesting MAuNPs are effective in reversing diabetes progression as an antioxidant (1). A novel “oxidative stress axis” has also been proposed based on FLIM phasor analysis of oxidative stress that identified a unique long lifetime component thought to be a product of lipid oxidation (22). Collectively, this range of applications spanning different disease states or tissue repair processes highlights the broad sensitivity of the optical redox ratio and NAD(P)H imaging to changes in cellular function.
Conclusions and Future Outlook
This review demonstrates that an optical redox ratio of FAD/[NAD(P)H+FAD] autofluorescence intensity can be a useful metric to noninvasively assess metabolic and functional cellular changes across a broad spectrum of biomedical applications. NAD(P)H fluorescence imaging techniques were initially used to monitor hypoxia and cancer development, and since then, new research avenues utilizing these methods in tissue engineering and regenerative medicine have shown great promise.
In the applications surveyed, a great variety of lenses, filter sets, laser power and wavelengths, normalization techniques, experimental conditions, and summary statistics were used in reporting NAD(P)H fluorescence measurements. This lack of standardization within the field currently makes direct comparisons among studies and cell/tissue types challenging. However, the redox ratio has generally demonstrated a sensitivity to the relative balance between oxidative phosphorylation and glucose catabolism (Fig. 2). Specifically, decreases in the redox ratio have been reported for cells undergoing significant biosynthetic demands that require increased glucose catabolism, or conditions such as hypoxia in which oxidative phosphorylation is inhibited. The increased use of NAD(P)H fluorescence lifetime measurements over the last 5–10 years has revealed a similar sensitivity, with a decrease in mean lifetime corresponding to a number of conditions involving an increase in glycolysis or decrease in oxygen tension.
As research involving NAD(P)H imaging increases and expands to new in vivo applications, accounting for additional intrinsic chromophores will be a critical challenge. Depth-resolved imaging techniques, such as TPEF, can be used to image epithelia in vivo with minimal concerns for artifacts produced by the underlying blood flow or stromal matrix autofluorescence. However, for imaging of well-perfused tissues, such as the brain, FLIM may be the only suitable NAD(P)H imaging approach. The potential wealth of information available through these time-resolved fluorescence measurements, including the ability to discriminate NAD(P)H protein binding changes within cells, could be very powerful. However, a better understanding of the limitations and potential of current FLIM analysis approaches is needed. Furthermore, a systematic evaluation of how different experimental conditions can affect these readouts is necessary. Future work is also needed to robustly evaluate whether the optical redox ratio, fluorescence lifetime, and mitochondrial organization measurements offer truly complementary information or can generally serve as alternative metrics of the same metabolic phenomena. In summary, it is expected that continued improvements to the instrumentation and analysis involved in NAD(P)H and FAD autofluorescence imaging will allow for impactful advances in basic science, preclinical research, and the clinical management of disease.
Acknowledgments
This work was supported by grant No. R00EB017723 from the National Institutes of Health and the Arkansas Biosciences Institute. We thank Jake D. Jones for providing us with images included in Figure 6.
Abbreviations Used
- 2D
two dimensional
- 3D
three dimensional
- AQP4
aquaporin-4
- CSD
cortical spreading depression
- ER
endoplasmic reticulum
- ER+
estrogen receptor positive
- ER−
estrogen receptor negative
- ETC
electron transport chain
- EVPOME
ex vivo produced oral mucosa equivalent
- FD-FLIM
frequency domain fluorescence lifetime imaging
- FLIM
fluorescence lifetime imaging
- HCV
hepatitis C virus
- HFKs
human foreskin keratinocytes
- HTT
Huntingtin
- LDH
lactate dehydrogenase
- LipDH
lipoamide dehydrogenase
- MAuNPs
mulberry-mediated gold nanoparticles
- OMI
optical metabolic imaging
- PDHC
pyruvate dehydrogenase complex
- PDK1
pyruvate dehydrogenase kinase-1
- PSD
power spectral density
- SHG
second-harmonic generation
- TCSPC
time-correlated single-photon counting
- TPEF
two-photon excited fluorescence
- UV
ultraviolet
References
- 1. Adavallan K, Gurushankar K, Nazeer SS, Gohulkumar M, Jayasree RS, and Krishnakumar N. Optical redox ratio using endogenous fluorescence to assess the metabolic changes associated with treatment response of bioconjugated gold nanoparticles in streptozotocin-induced diabetic rats. Laser Phys Lett 14: 065901, 2017 [Google Scholar]
- 2. Alhallak K, Rebello LG, Muldoon TJ, Quinn KP, and Rajaram N. Optical redox ratio identifies metastatic potential-dependent changes in breast cancer cell metabolism. Biomed Opt Express 7: 4364–4374, 2016 [DOI] [PMC free article] [PubMed] [Google Scholar]
- 3. Awasthi K, Moriya D, Nakabayashi T, Li L, and Ohta N. Sensitive detection of intracellular environment of normal and cancer cells by autofluorescence lifetime imaging. J Photochem Photobiol B 165: 256–265, 2016 [DOI] [PubMed] [Google Scholar]
- 4. Barros LF. Metabolic signaling by lactate in the brain. Trends Neurosci 36: 396–404, 2013 [DOI] [PubMed] [Google Scholar]
- 5. Barry NP, Hanson KM, Gratton E, Clegg RM, Behne MJ, and Mauro T. Applications of ultrafast lasers to two-photon fluorescence and lifetime imaging. High Power Lasers Appl 4633: 50–61, 2002 [Google Scholar]
- 6. Becker W, Bergmann A, Hink MA, Konig K, Benndorf K, and Biskup C. Fluorescence lifetime imaging by time-correlated single-photon counting. Microsc Res Tech 63: 58–66, 2004 [DOI] [PubMed] [Google Scholar]
- 7. Berezin MY. and Achilefu S. Fluorescence lifetime measurements and biological imaging. Chem Rev 110: 2641–2684, 2010 [DOI] [PMC free article] [PubMed] [Google Scholar]
- 8. Bird DK, Yan L, Vrotsos KM, Eliceiri KW, Vaughan EM, Keely PJ, White JG, and Ramanujam N. Metabolic mapping of MCF10A human breast cells via multiphoton fluorescence lifetime imaging of the coenzyme NADH. Cancer Res 65: 8766–8773, 2005 [DOI] [PubMed] [Google Scholar]
- 9. Blacker TS. and Duchen MR. Investigating mitochondrial redox state using NADH and NADPH autofluorescence. Free Radic Biol Med 100: 53–65, 2016 [DOI] [PMC free article] [PubMed] [Google Scholar]
- 10. Blacker TS, Mann ZF, Gale JE, Ziegler M, Bain AJ, Szabadkai G, and Duchen MR. Separating NADH and NADPH fluorescence in live cells and tissues using FLIM. Nat Commun 5: 3936, 2014 [DOI] [PMC free article] [PubMed] [Google Scholar]
- 11. Blinova K, Carroll S, Bose S, Smirnov AV, Harvey JJ, Knutson JR, and Balaban RS. Distribution of mitochondrial NADH fluorescence lifetimes: steady-state kinetics of matrix NADH interactions. Biochemistry 44: 2585–2594, 2005 [DOI] [PubMed] [Google Scholar]
- 12. Brigelius-Flohe R. and Flohe L. Basic principles and emerging concepts in the redox control of transcription factors. Antioxid Redox Signal 15: 2335–2381, 2011 [DOI] [PMC free article] [PubMed] [Google Scholar]
- 13. Chance B. Spectra and reaction kinetics of respiratory pigments of homogenized and intact cells. Nature 169: 215–221, 1952 [DOI] [PubMed] [Google Scholar]
- 14. Chance B. and Baltscheffsky H. Respiratory enzymes in oxidative phosphorylation. VII. Binding of intramitochondrial reduced pyridine nucleotide. J Biol Chem 233: 736–739, 1958 [PubMed] [Google Scholar]
- 15. Chance B, Cohen P, Jobsis F, and Schoener B. Intracellular oxidation-reduction states in vivo. Science 137: 499–508, 1962 [DOI] [PubMed] [Google Scholar]
- 16. Chance B, Schoener B, Oshino R, Itshak F, and Nakase Y. Oxidation-reduction ratio studies of mitochondria in freeze-trapped samples. NADH and flavoprotein fluorescence signals. J Biol Chem 254: 4764–4771, 1979 [PubMed] [Google Scholar]
- 17. Chance B. and Thorell B. Localization and kinetics of reduced pyridine nucleotide in living cells by microfluorometry. J Biol Chem 234: 3044–3050, 1959 [PubMed] [Google Scholar]
- 18. Chang T, Zimmerley MS, Quinn KP, Lamarre-Jouenne I, Kaplan DL, Beaurepaire E, and Georgakoudi I. Non-invasive monitoring of cell metabolism and lipid production in 3D engineered human adipose tissues using label-free multiphoton microscopy. Biomaterials 34: 8607–8616, 2013 [DOI] [PMC free article] [PubMed] [Google Scholar]
- 19. Chen LC, Lloyd WR, Kuo S, Kim HM, Marcelo CL, Feinberg SE, and Mycek MA. The potential of label-free nonlinear optical molecular microscopy to non-invasively characterize the viability of engineered human tissue constructs. Biomaterials 35: 6667–6676, 2014 [DOI] [PMC free article] [PubMed] [Google Scholar]
- 20. Chen LC, Lloyd WR, Wilson RH, Kuo S, Marcelo CL, Feinberg SE, and Mycek M-A. Nonlinear optical molecular imaging enables metabolic redox sensing in tissue-engineered constructs. Molecular Imaging III (2011), Paper 80890J, 2011
- 21. Cicchi R. and Pavone FS. Non-linear fluorescence lifetime imaging of biological tissues. Anal Bioanal Chem 400: 2687–2697, 2011 [DOI] [PubMed] [Google Scholar]
- 22. Datta R, Alfonso-Garcia A, Cinco R, and Gratton E. Fluorescence lifetime imaging of endogenous biomarker of oxidative stress. Sci Rep 5: 9848, 2015 [DOI] [PMC free article] [PubMed] [Google Scholar]
- 23. Deberardinis RJ, Sayed N, Ditsworth D, and Thompson CB. Brick by brick: metabolism and tumor cell growth. Curr Opin Genet Dev 18: 54–61, 2008 [DOI] [PMC free article] [PubMed] [Google Scholar]
- 24. Demas JN. and Crosby GA. Measurement of photoluminescence quantum yields—review. J Phys Chem 75: 991–1024, 1971 [Google Scholar]
- 25. Duckworth HW. and Tong EK. The binding of reduced nicotinamide adenine dinucleotide to citrate synthase of Escherichia coli K12. Biochemistry 15: 108–114, 1976 [DOI] [PubMed] [Google Scholar]
- 26. Fukushima T, Decker RV, Anderson WM, and Spivey HO. Substrate channeling of NADH and binding of dehydrogenases to complex I. J Biol Chem 264: 16483–16488, 1989 [PubMed] [Google Scholar]
- 27. Gaigalas AK. and Wang LL. Measurement of the fluorescence quantum yield using a spectrometer with an integrating sphere detector. J Res Natl Inst Stand Technol 113: 17–28, 2008 [DOI] [PMC free article] [PubMed] [Google Scholar]
- 28. Galeotti T, van Rossum GD, Mayer DH, and Chance B. On the fluorescence of NAD(P)H in whole-cell preparations of tumours and normal tissues. Eur J Biochem 17: 485–496, 1970 [DOI] [PubMed] [Google Scholar]
- 29. Georgakoudi I, Rice WL, Hronik-Tupaj M, and Kaplan DL. Optical spectroscopy and imaging for the noninvasive evaluation of engineered tissues. Tissue Eng Part B Rev 14: 321–340, 2008 [DOI] [PMC free article] [PubMed] [Google Scholar]
- 30. Gordon GRJ, Choi HB, Ellis-Davies GCR, and MacVicar BA. Brain metabolic state dictates the polarity of astrocyte control over the cerebrovasculature. Nature 456: 745–749, 2008 [DOI] [PMC free article] [PubMed] [Google Scholar]
- 31. Gratton E, Limkeman M, Lakowicz JR, Maliwal BP, Cherek H, and Laczko G. Resolution of mixtures of fluorophores using variable-frequency phase and modulation data. Biophys J 46: 479–486, 1984 [DOI] [PMC free article] [PubMed] [Google Scholar]
- 32. Guo HW, Yu JS, Hsu SH, Wei YH, Lee OK, Dong CY, and Wang HW. Correlation of NADH fluorescence lifetime and oxidative phosphorylation metabolism in the osteogenic differentiation of human mesenchymal stem cell. J Biomed Opt 20: 017004, 2015 [DOI] [PubMed] [Google Scholar]
- 33. Hanley QS, Subramaniam V, Arndt-Jovin DJ, and Jovin TM. Fluorescence lifetime imaging: multi-point calibration, minimum resolvable differences, and artifact suppression. Cytometry 43: 248–260, 2001 [DOI] [PubMed] [Google Scholar]
- 34. Hato T, Winfree S, Day R, Sandoval RM, Molitoris BA, Yoder MC, Wiggins RC, Zheng Y, Dunn KW, and Dagher PC. Intravital imaging of the kidney. Methods 128: 33–39, 2017 [DOI] [PMC free article] [PubMed] [Google Scholar]
- 35. This reference has been deleted.
- 36. Huang SH, Heikal AA, and Webb WW. Two-photon fluorescence spectroscopy and microscopy of NAD(P)H and flavoprotein. Biophys J 82: 2811–2825, 2002 [DOI] [PMC free article] [PubMed] [Google Scholar]
- 37. Islam MS, Honma M, Nakabayashi T, Kinjo M, and Ohta N. pH dependence of the fluorescence lifetime of FAD in solution and in cells. Int J Mol Sci 14: 1952–1963, 2013 [DOI] [PMC free article] [PubMed] [Google Scholar]
- 38. Islam SDM, Susdorf T, Penzkofer A, and Hegemann P. Fluorescence quenching of flavin adenine dinucleotide in aqueous solution by pH dependent isomerisation and photo-induced electron transfer. Chem Phys 295: 137–149, 2003 [Google Scholar]
- 39. Itoh K, Isobe K, and Watanabe W. Functional Imaging by Controlled Nonlinear Optical Phenomena. Hoboken, NJ: John Wiley & Sons, Inc., 2014 [Google Scholar]
- 40. Itoh K, Isobe K, and Watanabe W. Nonlinear microscopy. In: Functional Imaging by Controlled Nonlinear Optical Phenomena, edited by Hoboken Chang K., NJ: John Wiley & Sons, Inc., 2014, pp. 368–395 [Google Scholar]
- 41. Jameson DM, Thomas V, and Zhou DM. Time-resolved fluorescence studies on NADH bound to mitochondrial malate dehydrogenase. Biochim Biophys Acta 994: 187–190, 1989 [DOI] [PubMed] [Google Scholar]
- 42. Jones DP. and Sies H. The redox code. Antioxid Redox Signal 23: 734–746, 2015 [DOI] [PMC free article] [PubMed] [Google Scholar]
- 43. Jones J, Belov V, and Quinn KP. Functional imaging of wound metabolism. In: Bioengineering in Wound Healing: A Systems Approach, edited by Yarmush ML, Golberg A. Singapore: World Scientific, 2017, pp. 201–230 [Google Scholar]
- 44. Kisler K, Nelson AR, Rege SV, Ramanathan A, Wang Y, Ahuja A, Lazic D, Tsai PS, Zhao Z, Zhou Y, Boas DA, Sakadzic S, and Zlokovic BV. Pericyte degeneration leads to neurovascular uncoupling and limits oxygen supply to brain. Nat Neurosci 20: 406–416, 2017 [DOI] [PMC free article] [PubMed] [Google Scholar]
- 45. Kunz WS. Spectral properties of fluorescent flavoproteins of isolated rat liver mitochondria. FEBS Lett 195: 92–96, 1986 [DOI] [PubMed] [Google Scholar]
- 46. Kunz WS. and Gellerich FN. Quantification of the content of fluorescent flavoproteins in mitochondria from liver, kidney cortex, skeletal muscle, and brain. Biochem Med Metabol Biol 50: 103–110, 1993 [DOI] [PubMed] [Google Scholar]
- 47. Kunz WS. and Kunz W. Contribution of different enzymes to flavoprotein fluorescence of isolated rat liver mitochondria. Biochim Biophys Acta 841: 237–246, 1985 [DOI] [PubMed] [Google Scholar]
- 48. Lakner PH, Monaghan MG, Moller Y, Olayioye MA, and Schenke-Layland K. Applying phasor approach analysis of multiphoton FLIM measurements to probe the metabolic activity of three-dimensional in vitro cell culture models. Sci Rep 7: 42730, 2017 [DOI] [PMC free article] [PubMed] [Google Scholar]
- 49. Lakowicz JR, Szmacinski H, Nowaczyk K, and Johnson ML. Fluorescence lifetime imaging of free and protein-bound NADH. Proc Natl Acad Sci U S A 89: 1271–1275, 1992 [DOI] [PMC free article] [PubMed] [Google Scholar]
- 50. Lam NT, Muldoon TJ, Quinn KP, Rajaram N, and Balachandran K. Valve interstitial cell contractile strength and metabolic state are dependent on its shape. Integr Biol (Camb) 8: 1079–1089, 2016 [DOI] [PMC free article] [PubMed] [Google Scholar]
- 51. Levitt JM, Hunter M, Mujat C, McLaughlin-Drubin M, Munger K, and Georgakoudi I. Diagnostic cellular organization features extracted from autofluorescence images. Opt Lett 32: 3305–3307, 2007 [DOI] [PubMed] [Google Scholar]
- 52. Li LZ, Zhou R, Xu HN, Moon L, Zhong T, Kim EJ, Qiao H, Reddy R, Leeper D, Chance B, and Glickson JD. Quantitative magnetic resonance and optical imaging biomarkers of melanoma metastatic potential. Proc Natl Acad Sci U S A 106: 6608–6613, 2009 [DOI] [PMC free article] [PubMed] [Google Scholar]
- 53. Ma N, Digman MA, Malacrida L, and Gratton E. Measurements of absolute concentrations of NADH in cells using the phasor FLIM method. Biomed Opt Express 7: 2441–2452, 2016 [DOI] [PMC free article] [PubMed] [Google Scholar]
- 54. MacDonald DH, Hunter M, Quinn KP, and Georgakoudi I. Autocorrelation method for fractal analysis in nonrectangular image domains. Opt Lett 38: 4477–4479, 2013 [DOI] [PubMed] [Google Scholar]
- 55. Martelo L, Fedorov A, and Berberan-Santos MN. Fluorescence phasor plots using time domain data: effect of the instrument response function. J Phys Chem B 119: 10267–10274, 2015 [DOI] [PubMed] [Google Scholar]
- 56. Masters BR, Kriete A, and Kukulies J. Ultraviolet confocal fluorescence microscopy of the in vitro cornea: redox metabolic imaging. Appl Opt 32: 592–596, 1993 [DOI] [PubMed] [Google Scholar]
- 57. Mayevsky A. and Chance B. Oxidation-reduction states of NADH in vivo: from animals to clinical use. Mitochondrion 7: 330–339, 2007 [DOI] [PubMed] [Google Scholar]
- 58. Mazumder N, Lyn RK, Singaravelu R, Ridsdale A, Moffatt DJ, Hu CW, Tsai HR, McLauchlan J, Stolow A, Kao FJ, and Pezacki JP. Fluorescence lifetime imaging of alterations to cellular metabolism by domain 2 of the hepatitis C virus core protein. PLoS One 8: e66738, 2013 [DOI] [PMC free article] [PubMed] [Google Scholar]
- 59. Meier JD, Xie H, Sun Y, Sun Y, Hatami N, Poirier B, Marcu L, and Farwell DG. Time-resolved laser-induced fluorescence spectroscopy as a diagnostic instrument in head and neck carcinoma. Otolaryngol Head Neck Surg 142: 838–844, 2010 [DOI] [PMC free article] [PubMed] [Google Scholar]
- 60. Meleshina AV, Dudenkova VV, Bystrova AS, Kuznetsova DS, Shirmanova MV, and Zagaynova EV. Two-photon FLIM of NAD(P)H and FAD in mesenchymal stem cells undergoing either osteogenic or chondrogenic differentiation. Stem Cell Res Ther 8: 15, 2017 [DOI] [PMC free article] [PubMed] [Google Scholar]
- 61. Meleshina AV, Dudenkova VV, Shirmanova MV, Shcheslavskiy VI, Becker W, Bystrova AS, Cherkasova EI, and Zagaynova EV. Probing metabolic states of differentiating stem cells using two-photon FLIM. Sci Rep 6: 21853, 2016 [DOI] [PMC free article] [PubMed] [Google Scholar]
- 62. Mokry M, Gal P, Vidinsky B, Kusnir J, Dubayova K, Mozes S, and Sabo J. In vivo monitoring the changes of interstitial pH and FAD/NADH ratio by fluorescence spectroscopy in healing skin wounds. Photochem Photobiol 82: 793–797, 2006 [DOI] [PubMed] [Google Scholar]
- 63. Nichols MG, Ward K, Zholudeva LV, Jensen Smith H, and Hallworth R. Autofluorescene Lifetime Imaging. In: Natural Biomarkers for Cellular Metabolism: Biology, Techniques, and Applications, edited by Ghukasyan VV, Heikal AA. Boca Raton, FL: CRC Press, 2015, pp. 77–80 [Google Scholar]
- 64. Niesner R, Peker B, Schlusche P, and Gericke KH. Noniterative biexponential fluorescence lifetime imaging in the investigation of cellular metabolism by means of NAD(P)H autofluorescence. Chemphyschem 5: 1141–1149, 2004 [DOI] [PubMed] [Google Scholar]
- 65. Ohta N. and Nakabayashi T. Intracellular Autofluorescent Species: Structure, Spectroscopy, and Photophysics. In: Natural Biomarkers for Cellular Metabolism: Biology, Techniques, and Applications, edited by Ghukasyan VV, Heikal AA. Boca Raton, FL: CRC Press, 2015, pp. 41–52 [Google Scholar]
- 66. Ostrander JH, McMahon CM, Lem S, Millon SR, Brown JQ, Seewaldt VL, and Ramanujam N. Optical redox ratio differentiates breast cancer cell lines based on estrogen receptor status. Cancer Res 70: 4759–4766, 2010 [DOI] [PMC free article] [PubMed] [Google Scholar]
- 67. Pate KT, Stringari C, Sprowl-Tanio S, Wang K, TeSlaa T, Hoverter NP, McQuade MM, Garner C, Digman MA, Teitell MA, Edwards RA, Gratton E, and Waterman ML. Wnt signaling directs a metabolic program of glycolysis and angiogenesis in colon cancer. EMBO J 33: 1454–1473, 2014 [DOI] [PMC free article] [PubMed] [Google Scholar]
- 68. Patterson GH, Knobel SM, Arkhammar P, Thastrup O, and Piston DW. Separation of the glucose-stimulated cytoplasmic mitochondrial NAD(P)H responses in pancreatic islet beta cells. Proc Natl Acad Sci U S A 97: 5203–5207, 2000 [DOI] [PMC free article] [PubMed] [Google Scholar]
- 69. Piston DW, Masters BR, and Webb WW. Three-dimensionally resolved NAD(P)H cellular metabolic redox imaging of the in situ cornea with two-photon excitation laser scanning microscopy. J Microsc 178: 20–27, 1995 [DOI] [PubMed] [Google Scholar]
- 70. Pollak N, Niere M, and Ziegler M. NAD kinase levels control the NADPH concentration in human cells. J Biol Chem 282: 33562–33571, 2007 [DOI] [PubMed] [Google Scholar]
- 71. Pouli D, Balu M, Alonzo CA, Liu Z, Quinn KP, Rius-Diaz F, Harris RM, Kelly KM, Tromberg BJ, and Georgakoudi I. Imaging mitochondrial dynamics in human skin reveals depth-dependent hypoxia and malignant potential for diagnosis. Sci Transl Med 8: 367ra169, 2016 [DOI] [PMC free article] [PubMed] [Google Scholar]
- 72. Quinn KP, Bellas E, Fourligas N, Lee K, Kaplan DL, and Georgakoudi I. Characterization of metabolic changes associated with the functional development of 3D engineered tissues by non-invasive, dynamic measurement of individual cell redox ratios. Biomaterials 33: 5341–5348, 2012 [DOI] [PMC free article] [PubMed] [Google Scholar]
- 73. Quinn KP, Leal EC, Auster ME, Veves A, and Georgakoudi I. Characterizing diabetic wound metabolism and microstructure using multi-photon microscopy. Biomedical Optics BT4A.4, 2014 [Google Scholar]
- 74. Quinn KP, Leal EC, Tellechea A, Kafanas A, Auster ME, Veves A, and Georgakoudi I. Diabetic wounds exhibit distinct microstructural and metabolic heterogeneity through label-free multiphoton microscopy. J Invest Dermatol 136: 342–344, 2016 [DOI] [PMC free article] [PubMed] [Google Scholar]
- 75. Quinn KP, Sridharan GV, Hayden RS, Kaplan DL, Lee K, and Georgakoudi I. Quantitative metabolic imaging using endogenous fluorescence to detect stem cell differentiation. Sci Rep 3: 3432, 2013 [DOI] [PMC free article] [PubMed] [Google Scholar]
- 76. Quistorff B, Haselgrove JC, and Chance B. High spatial resolution readout of 3-D metabolic organ structure: an automated, low-temperature redox ratio-scanning instrument. Anal Biochem 148: 389–400, 1985 [DOI] [PubMed] [Google Scholar]
- 77. Ramanujan VK, Zhang JH, Biener E, and Herman B. Multiphoton fluorescence lifetime contrast in deep tissue imaging: prospects in redox imaging and disease diagnosis. J Biomed Opt 10: 051407, 2005 [DOI] [PubMed] [Google Scholar]
- 78. Rice WL, Kaplan DL, and Georgakoudi I. Two-photon microscopy for non-invasive, quantitative monitoring of stem cell differentiation. PLoS One 5: e10075, 2010 [DOI] [PMC free article] [PubMed] [Google Scholar]
- 79. Roy M, Reddy PH, Iijima M, and Sesaki H. Mitochondrial division and fusion in metabolism. Curr Opin Cell Biol 33: 111–118, 2015 [DOI] [PMC free article] [PubMed] [Google Scholar]
- 80. Sameni S, Syed A, Marsh JL, and Digman MA. The phasor-FLIM fingerprints reveal shifts from OXPHOS to enhanced glycolysis in Huntington disease. Sci Rep 6: 34755, 2016 [DOI] [PMC free article] [PubMed] [Google Scholar]
- 81. San Martin A, Sotelo-Hitschfeld T, Lerchundi R, Fernandez-Moncada I, Ceballo S, Valdebenito R, Baeza-Lehnert F, Alegria K, Contreras-Baeza Y, Garrido-Gerter P, Romero-Gomez I, and Barros LF. Single-cell imaging tools for brain energy metabolism: a review. Neurophotonics 1: 011004, 2014 [DOI] [PMC free article] [PubMed] [Google Scholar]
- 82. Scholz R, Thurman RG, Williamson JR, Chance B, and Bucher T. Flavin and pyridine nucleotide oxidation-reduction changes in perfused rat liver. I. Anoxia and subcellular localization of fluorescent flavoproteins. J Biol Chem 244: 2317–2324, 1969 [PubMed] [Google Scholar]
- 83. Schroeder T, Yuan H, Viglianti BL, Peltz C, Asopa S, Vujaskovic Z, and Dewhirst MW. Spatial heterogeneity and oxygen dependence of glucose consumption in R3230Ac and fibrosarcomas of the Fischer 344 rat. Cancer Res 65: 5163–5171, 2005 [DOI] [PubMed] [Google Scholar]
- 84. Scott TG, Spencer RD, Leonard NJ, and Weber G. Emission properties of NADH. Studies of fluorescence lifetimes and quantum efficiencies of NADH, AcPyADH, and simplified synthetic models. J Am Chem Soc 92: 687–695, 1970 [Google Scholar]
- 85. Shah AT, Demory Beckler M, Walsh AJ, Jones WP, Pohlmann PR, and Skala MC. Optical metabolic imaging of treatment response in human head and neck squamous cell carcinoma. PLoS One 9: e90746, 2014 [DOI] [PMC free article] [PubMed] [Google Scholar]
- 86. Shah AT, Heaster TM, and Skala MC. Metabolic imaging of head and neck cancer organoids. PLoS One 12: e0170415, 2017 [DOI] [PMC free article] [PubMed] [Google Scholar]
- 87. Shiino A, Haida M, Beauvoit B, and Chance B. Three-dimensional redox image of the normal gerbil brain. Neuroscience 91: 1581–1585, 1999 [DOI] [PubMed] [Google Scholar]
- 88. Skala MC, Riching KM, Gendron-Fitzpatrick A, Eickhoff J, Eliceiri KW, White JG, and Ramanujam N. In vivo multiphoton microscopy of NADH and FAD redox states, fluorescence lifetimes, and cellular morphology in precancerous epithelia. Proc Natl Acad Sci U S A 104: 19494–19499, 2007 [DOI] [PMC free article] [PubMed] [Google Scholar]
- 89. Sorvina A, Bader CA, Lock MC, Brooks DA, Morrison JL, and Plush SE. Label-free imaging of healthy and infarcted fetal sheep hearts by two-photon microscopy. J Biophotonics 11, 2017 [DOI] [PubMed] [Google Scholar]
- 90. Stefl M, James NG, Ross JA, and Jameson DM. Applications of phasors to in vitro time-resolved fluorescence measurements. Anal Biochem 410: 62–69, 2011 [DOI] [PMC free article] [PubMed] [Google Scholar]
- 91. Stobart JL. and Anderson CM. Multifunctional role of astrocytes as gatekeepers of neuronal energy supply. Front Cell Neurosci 38: 1–21, 2013 [DOI] [PMC free article] [PubMed] [Google Scholar]
- 92. Stringari C, Cinquin A, Cinquin O, Digman MA, Donovan PJ, and Gratton E. Phasor approach to fluorescence lifetime microscopy distinguishes different metabolic states of germ cells in a live tissue. Proc Natl Acad Sci U S A 108: 13582–13587, 2011 [DOI] [PMC free article] [PubMed] [Google Scholar]
- 93. Stringari C, Edwards RA, Pate KT, Waterman ML, Donovan PJ, and Gratton E. Metabolic trajectory of cellular differentiation in small intestine by phasor fluorescence lifetime microscopy of NADH. Sci Rep 2: 568, 2012 [DOI] [PMC free article] [PubMed] [Google Scholar]
- 94. Stringari C, Nourse JL, Flanagan LA, and Gratton E. Phasor fluorescence lifetime microscopy of free and protein-bound NADH reveals neural stem cell differentiation potential. PLoS One 7: e48014, 2012 [DOI] [PMC free article] [PubMed] [Google Scholar]
- 95. Stringari C, Wang H, Geyfman M, Crosignani V, Kumar V, Takahashi JS, Andersen B, and Gratton E. In vivo single-cell detection of metabolic oscillations in stem cells. Cell Rep 10: 1–7, 2015 [DOI] [PMC free article] [PubMed] [Google Scholar]
- 96. Stuntz E, Gong Y, Sood D, Liaudanskaya V, Pouli D, Quinn KP, Alonzo C, Liu Z, Kaplan DL, and Georgakoudi I. Endogenous two-photon excited fluorescence imaging characterizes neuron and astrocyte metabolic responses to manganese toxicity. Sci Rep 7: 1041, 2017 [DOI] [PMC free article] [PubMed] [Google Scholar]
- 97. Sun N, Xu HN, Luo Q, and Li LZ. Potential indexing of the invasiveness of breast cancer cells by mitochondrial redox ratios. Adv Exp Med Biol 923: 121–127, 2016 [DOI] [PMC free article] [PubMed] [Google Scholar]
- 98. Szulczewski JM, Inman DR, Entenberg D, Ponik SM, Aguirre-Ghiso J, Castracane J, Condeelis J, Eliceiri KW, and Keely PJ. In vivo visualization of stromal macrophages via label-free FLIM-based metabolite imaging. Sci Rep 6: 25086, 2016 [DOI] [PMC free article] [PubMed] [Google Scholar]
- 99. Thrane AS, Takano T, Rangroo Thrane V, Wang F, Peng W, Ottersen OP, Nedergaard M, and Nagelhus EA. In vivo NADH fluorescence imaging indicates effect of aquaporin-4 deletion on oxygen microdistribution in cortical spreading depression. J Cereb Blood Flow Metab 33: 996–999, 2013 [DOI] [PMC free article] [PubMed] [Google Scholar]
- 100. Torikata T, Forster LS, O'Neal CC, Jr., and Rupley JA. Lifetimes and NADH quenching of tryptophan fluorescence in pig heart lactate dehydrogenase. Biochemistry 18: 385–390, 1979 [DOI] [PubMed] [Google Scholar]
- 101. Tucker KR, Cavolo SL, and Levitan ES. Elevated mitochondria-coupled NAD(P)H in endoplasmic reticulum of dopamine neurons. Mol Biol Cell 27: 3214–3220, 2016 [DOI] [PMC free article] [PubMed] [Google Scholar]
- 102. Valeur B. and Brochon J. New Trends in Fluorescence Spectroscopy: Applications to Chemical and Life Sciences. Germany: Springer Science & Business Media, 2012 [Google Scholar]
- 103. Vander Heiden MG, Cantley LC, and Thompson CB. Understanding the Warburg effect: the metabolic requirements of cell proliferation. Science 324: 1029–1033, 2009 [DOI] [PMC free article] [PubMed] [Google Scholar]
- 104. Vander Heiden MG. and DeBerardinis RJ. Understanding the intersections between metabolism and cancer biology. Cell 168: 657–669, 2017 [DOI] [PMC free article] [PubMed] [Google Scholar]
- 105. Varone A, Xylas J, Quinn KP, Pouli D, Sridharan G, McLaughlin-Drubin ME, Alonzo C, Lee K, Munger K, and Georgakoudi I. Endogenous two-photon fluorescence imaging elucidates metabolic changes related to enhanced glycolysis and glutamine consumption in precancerous epithelial tissues. Cancer Res 74: 3067–3075, 2014 [DOI] [PMC free article] [PubMed] [Google Scholar]
- 106. Walsh AJ, Castellanos JA, Nagathihalli NS, Merchant NB, and Skala MC. Optical imaging of drug-induced metabolism changes in murine and human pancreatic cancer organoids reveals heterogeneous drug response. Pancreas 45: 863–869, 2016 [DOI] [PMC free article] [PubMed] [Google Scholar]
- 107. Walsh AJ, Cook RS, Manning HC, Hicks DJ, Lafontant A, Arteaga CL, and Skala MC. Optical metabolic imaging identifies glycolytic levels, subtypes, and early-treatment response in breast cancer. Cancer Res 73: 6164–6174, 2013 [DOI] [PMC free article] [PubMed] [Google Scholar]
- 108. Walsh AJ, Cook RS, Sanders ME, Aurisicchio L, Ciliberto G, Arteaga CL, and Skala MC. Quantitative optical imaging of primary tumor organoid metabolism predicts drug response in breast cancer. Cancer Res 74: 5184–5194, 2014 [DOI] [PMC free article] [PubMed] [Google Scholar]
- 109. Walsh AJ, Sharick JT, Skala MC, and Beier HT. Temporal binning of time-correlated single photon counting data improves exponential decay fits and imaging speed. Biomed Opt Express 7: 1385–1399, 2016 [DOI] [PMC free article] [PubMed] [Google Scholar]
- 110. Walsh AJ. and Skala MC. Optical metabolic imaging quantifies heterogeneous cell populations. Biomed Opt Express 6: 559–573, 2015 [DOI] [PMC free article] [PubMed] [Google Scholar]
- 111. Wang LF, Ramasamy R, and Schaefer S. Regulation of glycogen utilization in ischemic hearts after 24 hours of fasting. Cardiovasc Res 42: 644–650, 1999 [DOI] [PubMed] [Google Scholar]
- 112. Wang M, Tang F, Pan X, Yao L, Wang X, Jing Y, Ma J, Wang G, and Mi L. Rapid diagnosis and intraoperative margin assessment of human lung cancer with fluorescence lifetime imaging microscopy. BBA Clin 8: 7–13, 2017 [DOI] [PMC free article] [PubMed] [Google Scholar]
- 113. Warburg O. The metabolism of carcinoma cells. J Cancer Res 9: 148–163, 1925 [Google Scholar]
- 114. Warburg O, Wind F, and Negelein E. The metabolism of tumors in the body. J Gen Physiol 8: 519–530, 1927 [DOI] [PMC free article] [PubMed] [Google Scholar]
- 115. Ward A, Quinn KP, Bellas E, Georgakoudi I, and Kaplan DL. Noninvasive metabolic imaging of engineered 3D human adipose tissue in a perfusion bioreactor. PLoS One 8: e55696, 2013 [DOI] [PMC free article] [PubMed] [Google Scholar]
- 116. Wilson-Fritch L, Burkart A, Bell G, Mendelson K, Leszyk J, Nicoloro S, Czech M, and Corvera S. Mitochondrial biogenesis and remodeling during adipogenesis and in response to the insulin sensitizer rosiglitazone. Mol Cell Biol 23: 1085–1094, 2003 [DOI] [PMC free article] [PubMed] [Google Scholar]
- 117. Xu C. and Webb WW. Measurement of two-photon excitation cross sections of molecular fluorophores with data from 690 to 1050 nm. J Opt Soc Am B 13: 481–491, 1996 [Google Scholar]
- 118. Xu HN, Feng M, Moon L, Dolloff N, El-Deiry W, and Li LZ. Redox imaging of the p53-dependent mitochondrial redox state in colon cancer ex vivo. J Innov Opt Health Sci 6: 1350016, 2013 [DOI] [PMC free article] [PubMed] [Google Scholar]
- 119. Xu HN, Nioka S, and Li LZ. Imaging heterogeneity in the mitochondrial redox state of premalignant pancreas in the pancreas-specific PTEN-null transgenic mouse model. Biomark Res 1: 6, 2013 [DOI] [PMC free article] [PubMed] [Google Scholar]
- 120. Xu HN, Tchou J, Feng M, Zhao H, and Li LZ. Optical redox imaging indices discriminate human breast cancer from normal tissues. J Biomed Opt 21: 114003, 2016 [DOI] [PMC free article] [PubMed] [Google Scholar]
- 121. Xu HN, Tchou J, and Li LZ. Redox imaging of human breast cancer core biopsies: a preliminary investigation. Acad Radiol 20: 764–768, 2013 [DOI] [PMC free article] [PubMed] [Google Scholar]
- 122. Xu HN, Zhou R, Moon L, Feng M, and Li LZ. 3D imaging of the mitochondrial redox state of rat hearts under normal and fasting conditions. J Innov Opt Health Sci 7: 1350045, 2014 [DOI] [PMC free article] [PubMed] [Google Scholar]
- 123. Xylas J, Quinn KP, Hunter M, and Georgakoudi I. Improved Fourier-based characterization of intracellular fractal features. Opt Express 20: 23442–23455, 2012 [DOI] [PMC free article] [PubMed] [Google Scholar]
- 124. Xylas J, Varone A, Quinn KP, Pouli D, McLaughlin-Drubin ME, Thieu HT, Garcia-Moliner ML, House M, Hunter M, Munger K, and Georgakoudi I. Noninvasive assessment of mitochondrial organization in three-dimensional tissues reveals changes associated with cancer development. Int J Cancer 136: 322–332, 2015 [DOI] [PMC free article] [PubMed] [Google Scholar]
- 125. Yaseen MA, Sakadzic S, Wu W, Becker W, Kasischke KA, and Boas DA. In vivo imaging of cerebral energy metabolism with two-photon fluorescence lifetime microscopy of NADH. Biomed Opt Express 4: 307–321, 2013 [DOI] [PMC free article] [PubMed] [Google Scholar]
- 126. Yaseen MA, Sutin J, Wu W, Fu B, Uhlirova H, Devor A, Boas DA, and Sakadžić S. Fluorescence lifetime microscopy of NADH distinguishes alterations in cerebral metabolism in vivo. Biomed Opt Express 8: 2368, 2017 [DOI] [PMC free article] [PubMed] [Google Scholar]
- 127. Youle RJ. and van der Bliek AM. Mitochondrial fission, fusion, and stress. Science 337: 1062–1065, 2012 [DOI] [PMC free article] [PubMed] [Google Scholar]
- 128. Zhang YD, Khan AA, Vigil GD, and Howard SS. Super-sensitivity multiphoton frequency-domain fluorescence lifetime imaging microscopy. Opt Express 24: 20862–20867, 2016 [DOI] [PubMed] [Google Scholar]
- 129. Zhang Z, Blessington D, Li H, Busch TM, Glickson J, Luo Q, Chance B, and Zheng G. Redox ratio of mitochondria as an indicator for the response of photodynamic therapy. J Biomed Opt 9: 772–778, 2004 [DOI] [PubMed] [Google Scholar]