

Abstract
Paulownia is a tree species grown in many countries. Our previous study reveals that tetraploid Paulownia fortunei is more tolerant to salt stress than its corresponding diploid tree. To investigate the molecular mechanisms of salt stress tolerance in P. fortunei, the transcriptomes of normal and salt-stressed diploid and tetraploid were investigated. After assembling the clean reads, we obtained 130,842 unigenes. The unigenes were aligned against six public databases (Nr, Nt, Swiss-Prot, COG, KEGG, GO) to discover homologs and assign functional annotations. We retrieved 7983 and 15,503 differentially expressed unigenes (DEUs) between the normal and the salt-stressed diploid and tetraploid P. fortunei, respectively. We identified dozens of important DEUs including 3 related to photosynthesis, 10 related to plant growth and development and 11 related to osmolytes. Some of these DEUs were upregulated in tetraploid compared to diploid and others were upregulated under salt stress. Quantitative reverse transcriptase polymerase chain reaction verified the expression patterns of 15 unigenes. Our results provided insights into the molecular aspects why tetraploid is stronger and more energetic than diploid under saline environment. This study provides useful information for further studies on the molecular mechanisms of salt tolerance in other tree plants.
Electronic supplementary material
The online version of this article (10.1007/s12298-018-0578-4) contains supplementary material, which is available to authorized users.
Keywords: Paulownia fortunei, Transcriptome, Salt stress, Diploid, Tetraploid
Introduction
Soil salinization is an increasingly severe agricultural problem that can cause a combination of dehydration and osmotic-related stress effects (Gong et al. 2005). Approximately 894 million hectares were reported to be under salt stress (Ismail and Horie 2017). Primary sources of salinity include natural processes such as mineral weathering or fluctuations in sea-water levels, along with anthropogenic activities such as irrigation. Various strategies have been proposed regarding the use of the salt-affected lands, including reclamation of salt-affected soils, halophyte cultivation, and breeding salt-tolerant crops.
Salt stress causes two main adverse effects. First, osmotic stress reduces water uptake by roots and causes internal dehydration. Second, abnormal accumulation of salts results in ion toxicity which disturb metabolic pathways, especially in photosynthetic cells (Ismail and Horie 2017). The pathways associated with regulation of salt movement and accumulation have been illustrated, and so are metabolites involved in signaling, osmoregulation, and protection of cellular metabolism under salt stress (Ismail and Horie 2017). The mechanisms of salinity tolerance are highly complex processes in which many genes and pathways are involved (Magnan et al. 2008; Xu et al. 2009). For example, cotton GhWRKY34 is a stress-related gene that belongs to WRKY family and its overexpression in Arabidopsis enhances the transgenic plant tolerance to salt stress (Zhou et al. 2015). Wheat TaWRKY44 also improves salinity tolerance through activation of the cellular antioxidant systems in transgenic tobacco (Wang et al. 2015). Another example is glutathione S-transferases gene from tomato which plays a positive role in salt avoidance in Arabidopsis (Xu et al. 2015). Some studies have shown that the plants with higher ploidy levels seem to be more adaptable to stressful conditions than their diploid relatives (Chao et al. 2013; Deng et al. 2011; Dong et al. 2014; Li et al. 2012).
Paulownia is a genus of fast-growing deciduous trees native to China, where it has been used for afforestation and improvement of the ecological environment (Essl 2007). Paulownia species have been introduced in many countries for their important ecological, economic, and social significance (Ipekci and Gozukirmizi 2003). Tetraploid Paulownia has much stronger tolerance to extreme soils than diploid (Deng et al. 2013; Dong et al. 2014; Wang et al. 2017). In the studies of Paulownia spp. under salt stress, some pathways associated with accumulation of compatible solutes, oxidative stress detoxification, ion homeostasis and transportation, and plant hormone signal transduction and photosynthetic activities have been revealed (Deng et al. 2017; Dong et al. 2017; Fan et al. 2016a, b; Zhao et al. 2017). Mechanistic studies about Paulownia response to salt stress have been done at the levels of transcription (Dong et al. 2017; Fan et al. 2016b, 2017; Zhao et al. 2017), post-transcription (Fan et al. 2016a, 2017) and translation (Deng et al. 2017; Fan et al. 2017). However, there is a lack of direct comparison at the transcriptomic levels between diploid and autotetraploid Paulownia fortunei under salt stress.
In this study, the transcriptomes analysis of normal and salt-treated diploid and tetraploid P. fortunei were performed for better understanding the mechanisms of salinity tolerance. We compared the transcript profiling of diploid and tetraploid P. fortunei under salt stress, and identified a number of salt-related genes which were related to photosynthesis, plant growth and development and osmolytes. These results might be useful for understanding the difference in salt tolerance between diploid and tetraploid P. fortunei.
Materials and methods
Experimental material
Plant materials were obtained from the Institute of Paulownia, Henan Agricultural University, Zhengzhou, Henan Province, China. The tissue culture seedlings of diploid P. fortunei (PF2) and tetraploid P. fortunei (PF4) were derived from the same tissue culture without genetic variation (Fan et al. 2007) and grown in the greenhouse under 16-h light and 8-h dark cycle for 30 days before being moved to the outdoor. Seedlings with approximately the same crown size and height were planted in plastic pots (30 cm in diameter at the bottom and 20 cm deep) that contained the same garden soil. The plants were housed randomly in an outdoor nursery for 50 days before being subjected to stress treatments (NaCl/dry soil: 0, 0.2, 0.4, and 0.6%). The seedlings in triplicate were subjected to the salt treatments as described (Deng et al. 2013). Based on our previous study (Fan et al. 2016a), the P. fortunei seedlings treated with 0% (control) and 0.4% NaCl (salt-treated) were used to construct four cDNA libraries: control and salt-treated (0.4% NaCl) diploid (PF2 and PF2S) and tetraploid (PF4 and PF4S) libraries. The fully expanded leaves (second leaf from the apex) from each of the four treatments were mixed in equal numbers from each plant in each of the replicate groups, frozen in liquid nitrogen, and then stored at − 80 °C for later use.
RNA extraction and construction of cDNA libraries
Total RNA was extracted from 8 mg of the leaf samples using TRIzol reagent (Invitrogen, Carlsbad, CA, USA). The RNA was purified with the Qiagen Kit according to the manufacturer’s protocol (Qiagen, Valencia, CA, USA). After purification, magnetic beads with oligo (dT) were used to isolate mRNA. The mRNA was fragmented into short fragments by mixing it with fragmentation buffer. Then, single-stranded cDNAs were synthesized using the mRNA fragments as templates. Short cDNA fragments were purified and resolved with EB buffer for end repair and addition of a single nucleotide A (adenine). The short cDNA fragments were ligated with adaptors and suitable fragments were selected as templates for the polymerase chain reaction (PCR) amplification step. The cDNA libraries were assessed using a 2100 Bioanalyzer (Agilent Technologies, Inc., Santa Clara, CA) and sequenced on an Illumina Genome Analyzer IIx (GAIIx) platform (Illumina, San Diego, CA) by Beijing Genomics Institute (BGI)-Shenzhen, Shenzhen, China, following the manufacturer’s standard cBot and sequencing protocols.
Assembly and annotation
The image data obtained from the sequencing platform were transformed by base calling into raw reads, which were stored in FASTQ format. Processing of the raw reads and filtering out dirty raw reads, such as reads with adaptors, unknown nucleotides larger than 5%, and low-quality reads in which the percentage of low-quality bases (base quality ≤ 10) is more than 20%, were performed using Dynamic Trim in the Solexa QA package (DynamicTrim.pl, p = 0.05; LengthSort.pl, min length = 25). Transcriptome de novo assembly was carried out using the short reads assembly program, Trinity (the options: -seqType fq -min_contig_length 200 -group_pairs_distance 250 -min_kmer_cov 2) (Grabherr et al. 2011). The assembled sequences that were produced by Trinity were called unigenes. Non-redundant unigenes were obtained after removing redundancy and splicing the unigenes by the TIGR Gene Indices clustering tools (TGICL) (Pertea et al. 2003). The unigenes were of two types, clusters and singletons. Clusters contained two or more unigenes that shared more than 70% of the identity and were named using the prefix “CL” followed by the cluster id. Singletons were named using the prefix “unigene”. More details are in the supplementary material 1. The unigene sequences were aligned to the NCBI non-redundant protein sequence database (Nr), Swiss-Prot, Kyoto Encyclopedia of Genes and Genomes (KEGG), and Cluster of Orthologous Groups (COG) using BLASTX (e-value < 1.0e−5), and to the NCBI nucleotide sequence database (Nt) using BLASTN (e-value < 1.0e−5). The best alignments were used to decide the sequence direction of the unigenes. If the results from different databases conflicted, a priority order of Nr, Swiss-Prot, KEGG, and COG was followed in deciding the sequence direction of the unigenes. For unigenes that did not align to any of the above databases, ESTScan (Iseli et al. 1999) was used to decide the sequence direction. Using the Nr annotations of the homologous sequences, Gene Ontology (GO) annotations were assigned to the unigenes using Blast2GO (Conesa et al. 2005). Then, WEGO (Ye et al. 2006) was used to classify the GO annotation results. Pathway annotations were obtained by aligning the unigenes with the KEGG database (Kanehisa and Goto 2000).
Detection of differentially expressed unigenes
Unigene expression levels in each of the four libraries were calculated by the FPKM (fragments per kilobase per million fragments). We chose false discovery rate (FDR) ≤ 0.001 and |log2Ratio| > 2 as the cutoffs for DEUs. The DEUs were then subjected to GO functional and KEGG Pathway analyses.
Quantitative real-time polymerase chain reaction (PCR) Analysis
The RNA samples from PF2, PF4, PF2S-10D (PF2 with salt treated for 10 days), PF4S-10D (PF4 with salt treated for 10 days), PF2S and PF4S leaves were extracted with Trizol (Sangon, Shanghai, China). 15 DEUs were selected for quantitative real-time PCR analysis (Table 2). Primers were designed using Beacon Designer version 7.7 (Premier Biosoft International, Ltd., Palo Alto, CA, USA). The quantitative real-time PCR reactions were run in So Fast Eva Green Supermix (Bio-Rad, Hercules, CA, USA) starting with 1 µL cDNA template in a standard 20 µL reaction. The cDNAs were then amplified in a Bio-Rad CFX96TM Real-Time System (Bio-Rad, Hercules, CA, USA) with SYBR Premix Ex Taq TM II (Takara, Dalian, China). The PCR cycles were as follows: 95 °C for 1 min, followed by 40 cycles of 95 °C for 10 s, and 55 °C for 15 s. Three biological replicates (with 3 technical replicates for each biological replication) were analyzed for each gene. Relative expression levels of the genes were calculated using the 2−ΔΔCt method and normalized with 18S rRNA from P. fortunei.
Table 2.
The primers used for the quantitative real-time PCR analysis
| Unigene | Sense primer | Anti-sense primer | Predicted gene names |
|---|---|---|---|
| Unigene18169 | ATGCTGATGCCGCCGATG | TTTGCCGTTTGCTCCTAATGG | putative WEE1 kinase |
| CL4231.Contig6 | GATGTGCTGTGCCCTTTC | TGTTGATGTAGTTGTTGTTACC | GDSL esterase |
| CL7685.Contig1 | CTTGGCAGAGATGACAGTGAG | GCAGCAACGGCAATAGGG | CASP-like protein |
| CL9721.Contig3 | GCAGACAGAGTTGGAATGAG | TGGAAGTAGGCTATGAGTGG | LEDI-5c protein |
| Unigene36820 | TCTTGCTGCTTCAAATCC | TATTCTCCTGCTGCTACC | Uncharacterized protein |
| CL12910.Contig1 | ATCGTTGTGGAGGAGAATCG | CTGGTGGTTGTGGCTGAG | Protein GAST1 |
| Unigene43174 | GCTCCTTCAACACGCTCTC | GTATGATAACAACTGCCAACTCC | Cytosolic NADP-malic enzyme |
| Unigene22247 | GGACATAACTCTTCGTATCATCAG | ATCGCCAACATCGCTTAGG | Arginase 1 |
| CL1552.Contig2 | CTTCATCAACTTCAGCATCC | TGACTCCAGCAAGACTCC | Protein tesmin |
| Unigene1241 | CACCACCTTCACACCCTTCAAC | GCACCAATAGCCATCGTAGAGAC | Flavonol 3-sulfotransferase |
| CL14828.Contig2 | GGAGAACAGGTGTGCTTCAGTG | GCCTTGCTTGTGGACTTGTGG | Dihydroflavonol-4-reductase |
| CL2159.Contig3 | GGATGTATTCAGGTCTTACTTATG | GCAGCAGTGGATATAGCAG | Outer envelope pore protein |
| Unigene34442 | TGCTTGTTCTTGACGCTTTC | TTGATTCTGCTGTGTTGTATCC | Predicted protein |
| CL10606.Contig1 | GTGGTGGCTATGGTGGTG | GCTTGGCTTCAGGTTCAG | Glycine-rich protein |
| CL3293.Contig3 | GGCTGTGGCGGATAGTAACC | GTGTTCAGTTCAGTCATCAAGAGG | PIN1-like auxin transport protein |
Results
Sequencing and assembly
The high-throughput RNA sequencing of the four cDNA libraries generated a total of 287,714,442 raw reads (73,251,168 from PF2, 68,693,814 from PF4, 69,672,008 from PF2S, and 76,097,452 from PF4S). 266,053,238 clean reads (67,705,202 from PF2, 65,589,796 from PF4, 63,993,094 from PF2S, and 68,765,146 from PF4S) were obtained from the four cDNA libraries after filtering out adaptor sequences, low-quality sequences. The sequencing raw data have been submitted to the Short Reads Archive (SRA) under the accession numbers SRP060682. The Q20 was more than 97.32%. The N percentage was 0.01% in PF2 and PF2S, and 0.00% in PF4 and PF4S. The clean reads were assembled by Trinity, resulted in a total of 638,242 unigenes (104,212 from PF2, 97,537 from PF4, 114,976 from PF2S, and 124,988 from PF4S). The four libraries of unigenes were combined which resulted in 130,842 unique unigenes, with an average length of 939 nt and an N50 of 1575 nt. Details of the sequencing and assembly of the transcriptome are shown in Table 1. All the assembled unigenes were aligned against the Nr, Swiss-Prot, KEGG, and COG protein databases, and a total of 89,005 coding sequences (CDSs) were predicted. 83,038 CDSs were inferred using BLASTX hits and 5967 were assigned using ESTScan. These results indicated that the sequencing of the P. fortunei transcriptomes was in high depth and good quality. Both duplicates showed linear correlations with their corresponding ones. The Spearman r values of the diploids and tetraploids were 0.83 and 0.74, respectively, while the Pearson r values were 0.83 and 0.79, respectively (Figure S1).
Table 1.
Overview of the sequencing and assembly of the transcriptome of P. fortunei
| Statistics of data production | PF2 | PF4 | PF2S | PF4S |
|---|---|---|---|---|
| Number of clean reads | 67,705,202 | 65,589,796 | 63,993,094 | 68,765,146 |
| Total nucleotides (nt) | 6,093,468,180 | 5,903,081,640 | 5,759,378,460 | 6,188,863,140 |
| Q20 percentage (%) | 97.41 | 98.69 | 97.32 | 97.63 |
| N percentage (%) | 0.01 | 0.00 | 0.01 | 0.00 |
| GC percentage (%) | 45.52 | 46.18 | 45.68 | 44.84 |
| PF2 | PF4 | PF2S | PF4S | |
|---|---|---|---|---|
| Unigenes | ||||
| Number of unigenes | 104,212 | 97,537 | 114,976 | 124,988 |
| Total nucleotides (nt) | 69,516,463 | 59,199,964 | 78,364,730 | 90,092,884 |
| Mean length (nt) | 667 | 607 | 682 | 721 |
| Length of N50 (nt) | 1124 | 1041 | 1171 | 1246 |
| Clusters | 40,010 | 32,993 | 44,665 | 51,516 |
| Singletons | 64,202 | 64,544 | 70,311 | 73,472 |
| All unigenes | ||||
| Number of all unigenes | 130,842 | |||
| Total nucleotides (nt) | 122,811,807 | |||
| Mean length (nt) | 939 | |||
| Length of N50 (nt) | 1575 | |||
| Clusters | 61,276 | |||
| Singletons | 69,566 | |||
Functional annotation of the unigenes
A total of 86,108 unigenes were annotated based on their alignments against sequences in the public databases (e-value < 1.0e−5). Of these, 82,546 unigenes (95.86%) were found to match against the Nr database, followed by Nt (70,373 unigenes, 81.73%), GO (67,348 unigenes, 78.21%), Swiss-Prot (53,830 unigenes, 62.51%), KEGG (50,950 unigenes, 59.17%), and COG (35,252 unigenes, 40.94%) (Table S1).
Three ontologies were divided for gene ontology (GO) analysis of the unigenes: molecular function, cellular component, and biological process. A total of 67,348 unigenes were categorized into 58 functional groups (Figure S2). Cell and cell part were the two largest groups, the smallest group was protein tag, with only 10 unigenes predicted for it.
The KEGG annotation system was used to conduct the unigene metabolic pathway analysis. A total of 50,950 unigenes were mapped to 128 KEGG pathways. Metabolic pathway (ko01100) group was the largest group with 12,557 unigenes, followed by biosynthesis of secondary metabolites, plant-pathogen interaction, plant hormone signal transduction, spliceosome, RNA transport. The smallest group was betalain biosynthesis with only six unigenes (Table S2).
After searching against the COG database, 35,252 unigenes were categorized into 25 specific functional groups (Figure S3). The largest group was “General function prediction only”, followed by “Transcription”, “Replication, recombination and repair”, “Posttranslational modification, protein turnover, chaperones”, and “Translation, ribosomal structure and biogenesis”. The smallest group was “Nuclear structure”.
Identification and analysis of differentially expressed unigenes
To identify transcriptional changes under salt stress, we performed four comparisons, normal seedlings versus salt-treated seedlings (PF2 vs. PF2S and PF4 vs. PF4S) and tetraploid P. fortunei versus diploid P. fortunei (PF2 vs. PF4 and PF2S vs. PF4S) (Tables S3 and Figure S4). The results of the pairwise comparisons of the DEUs are shown in Fig. 1. In order to obtain more information, another four comparisons (comparison A, B, C, D) were made using specific sets of DEUs. Comparison A used 1617 DEUs that were regulated consistently between PF2 versus PF2S and PF4 versus PF4S, which may offer some information about the response to salt in P. fortunei (Table S4). Comparison B used 409 DEUs (231 up-regulated in PF2 vs. PF2S and down-regulated in PF4 vs. PF4S, 178 down-regulated in PF2 vs. PF2S and up-regulated in PF4 vs. PF4S) that were regulated inconsistently between PF2 versus PF2S and PF4 versus PF4S, which could reveal information about the different response to salt stress between PF2 and PF4 (Table S4). Comparison C used 4021 DEUs (3877 up-regulated in PF2S vs. PF4S and PF2 vs. PF4, 144 DEUs up-regulated in PF2S vs. PF4S and down-regulated in PF2 vs. PF4). Comparison D used 2738 DEUs (2345 DEUs down-regulated in PF2S versus PF4S and down-regulated in PF2 versus PF4, 393 DEUs down-regulated in PF2S versus PF4S and up-regulated in PF2 vs. PF4) (Tables S4). These two sets (Fig. 2) of comparisons might help to explain the reason why PF4 has higher salt tolerance than PF2. The details of these comparisons are described below. The expression of unigenes in comparison A and B indicated that most of the unigenes in PF2 versus PF2S and PF4 versus PF4S display same response to salt stress (Figure S5a). The expression of unigenes in comparison C and D indicated that most of the unigenes in PF2 versus PF4 and PF2S versus PF4S show similar expression change regardless of salt treatment (Figure S5b).
Fig. 1.
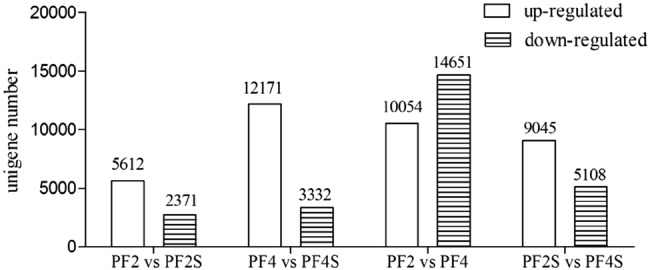
The number of differentially expressed genes. PF2, PF4, normal seedlings. PF2S, PF4S, salt-treated seedlings
Fig. 2.

Details of the comparison schemes. a Details of comparison A and B; b details of comparison C and D. up: up-regulated, down: down-regulated
GO enrichment analysis was performed to identify the functional categories that were significantly enriched among the DEUs. The DEUs in library A were enriched, the GO enrichment results are shown in Table S5. Similarly, DEUs in Tables S4 are enriched, the GO enrichment results are shown in Tables S5. The DEUs in library A were mapped to 99 KEGG metabolic pathways, the DEUs in library B were mapped to 75 metabolic pathways, the DEUs in library C were mapped to 120 metabolic pathways, the DEUs in library D were mapped to 114 metabolic pathways (Tables S6).
Identification of key DEUs related to photosynthesis
By pairwise comparison, we found three key photosynthesis-related unigenes that were differentially expressed in PF2 versus PF4 and normal versus salt conditions (Table S7). One of the DEUs (CL13291.Contig1) was predicted to encode transketolase (TKTA) that catalyzes glyceraldehyde-3-phosphate and sedoheptulose-7-phosphate to produce xylulose-5-phosphate and ribose-5-phosphate, both essential for synthesizing ribulose-1,5-bisphosphate (RuBP). The other DEU (Unigene64782) was predicted to encode the ATP synthase CF1 alpha subunit which was up-regulated in PF4 compared to PF2 in either normal or salt treated plants. The third DEU (Unigene4505) was predicted to encode chlorophyll a/b binding protein. It was also up-regulated in PF4 compared to PF2 regardless of culture conditions with or without salt (Table S7).
Identification of key DEUs related to plant growth
We found ten growth-related unigenes that were differentially expressed in PF2 versus PF4 and normal versus salt conditions (Table S7). Three of the DEUs (CL2574.Contig4, CL8577.Contig2, CL11064.Contig4) were predicted to be involved in primary cell wall biosynthesis and were upregulated in PF4 compared to PF2. CL2574.Contig4 was annotated as a glycosyltransferases (GT) involved in various biological processes such as cell wall formation, plant growth and development, storage polysaccharides biosynthesis, and glycosylation of various metabolites. CL8577.Contig2 was involved in multidimensional cell growth and cell wall cellulose and pectin metabolic processes. CL11064.Contig4 was involved in regulation of cellulose biosynthetic process. Two DEUs (CL8577.Contig2 and Unigene32735) related to cell wall pectin metabolic process were up-regulated in PF4. Unigene32735 was predicted to encode a pectin methyltransferase (PMT). We discovered three DEUs (CL1306.Contig3, Unigene60481, and Unigene37840) predicted to encode caffeoyl-CoA O-methyltransferase (CCoAOMT) essential for lignin biosynthesis. These three DEUs were up-regulated in PF2 versus PF4, PF2S versus PF4S. In addition, we identified two DEUs (Unigene36754 and CL10657.Contig8) encoding auxin response factor and auxin-responsive protein IAA, respectively, which are involved in plant hormone signal transduction. These DEUs were up-regulated in PF4 (Table S7).
Identification of key DEUs related to osmolytes
We found 11 DEUs involved in osmoregulation (Table S7). Among them, 10 DEUs were predicted to encode late embryogenesis abundant (LEA) proteins, including five DEUs up-regulated in PF4 (Unigene18913, CL15360.Contig2, CL6982.Contig9, CL6982.Contig7, and CL4052.Contig2) and five DEUs up-regulated after salt treatment (CL1764.Contig1, CL1764.Contig2, CL1764.Contig3, CL1764.Contig4 and Unigene39522). LEA proteins are composed mainly of hydrophilic amino acids that could protect cells from salt damage by replacing water molecules. The accumulation of LEAs may improve salt tolerance and reduce the damage of salt stress in plants. The other osmolyte-related DEU (Unigene17670) was predicted to encode aldehyde dehydrogenase (ALDH) and up-regulated in PF4. ALDH is involved in arginine and proline metabolism.
Quantitative real-time PCR verification of selected DEUs in Paulownia
To validate the reliability of the Illumina sequencing analysis, the expression profiles of 15 DEUs from leaves of PF4 and PF2 were assessed by quantitative real-time PCR. The primers used for the quantitative real-time PCR analysis are shown in Table 2. cDNA fragments from the samples used for the transcriptome sequencing were used as templates. The expression patterns revealed by quantitative real-time PCR (relative expressed level) of all the 15 unigenes were consistent with the expressions from the transcriptome analyses. The changing trend of unigenes expression was relevant to the time of salt-treated (Fig. 3). The spearman correlation coefficient between the results of RNA-seq and quantitative real-time PCR was 0.708. This result indicated the reliability of the gene expression variations obtained from our analysis of the unigene sequences.
Fig. 3.

The quantitative real-time PCR analysis of differently expressed unigenes. The 18S rRNA of Paulownia was chosen as an internal reference gene for normalization (sense primer: ACATAGTAAGGATTGACAGA; anti-sense primer: TAACGGAATTAACCAGACA). Standard error of the mean for three biological replicates is represented by the error bars. PF2, PF4, normal seedlings. PF2S, PF4S, salt-treated seedlings. PF2S-10D, PF4S-10D, seedlings with salt treated for 10 days
Discussion
In our earlier studies, tetraploid P. fortunei (PF4) was found to exhibit more vigorous growth than diploid P. fortunei (PF2) in both salt-treated and normal conditions. Salt-stress limits plant productivity because it decreases the photosynthesis rate. In the present study, we investigated the different responses of P. fortunei to salt stress at the molecular level by sequencing the transcriptomes of PF2 and PF4 with a high-throughput RNA sequencing technique. We identified two dozens of important differentially expressed unigenes (DEUs) including 3 DEUs related to photosynthesis, 10 DEUs related to plant growth and development and 11 DEUs related to osmolytes. These DEUs were upregulated in PF4 compared to PF2 and upregulated under salt stress. Our results provided insights into the molecular aspects why PF4 is stronger and more energetic than PF2 under saline environment. In order to confirm our sequence results, 15 DEUs were randomly selected for validation by quantitative real-time PCR. The results indicate that the unigenes identified by Illumina sequencing are reliable.
DEUs related to photosynthesis
We identified three photosynthesis-related unigenes (CL13291.Contig1, Unigene64782, Unigene4505) predicted to encode transketolase (TKTA), ATP synthase CF1 alpha subunit and chlorophyll a/b binding protein, respectively. These three DEUs were differentially expressed in PF2 versus PF4 and normal versus salt conditions. TKTA catalyzes glyceraldehyde-3-phosphate and sedoheptulose-7-phosphate to produce xylulose-5-phosphate and ribose-5-phosphate, both essential for synthesizing ribulose-1,5-bisphosphate (RuBP). TKTA plays important roles in the photosynthetic carbon reduction cycle (Calvin cycle) and is an ideal candidate for the regulation of metabolic flux because it connects the non-oxidative pentose phosphate pathway to glycolysis (Bi et al. 2015; McDonagh et al. 2013). For example, TKTA gene in Anabaena sp. was shown to be involved in glycolate metabolism and down-regulated after NaCl treatment (Srivastava et al. 2011). In cucumber seedlings, the activity of TKTA was found to influence the photosynthetic rate (Bi et al. 2011). In our study, this DEU was down-regulated in PF2 versus PF2S but up-regulated in PF4 versus PF4S, indicating that the influence of salt stress on TKTA in PF2 and PF4 is different.
The unigene coding for ATP synthase CF1 alpha subunit was up-regulated in PF4 compared to PF2 in either normal or salt treated plants. Plant ATP synthase is integrated into thylakoid membrane with the CF1 alpha subunit exposed to the stroma where dark reactions of photosynthesis and ATP synthesis take place. ATP synthase plays an important role in the energy transduction process in chloroplasts and mitochondria. The importance of ATP synthase in salt resistance has been demonstrated in several recent studies. Salt-treatment up-regulates ATP synthase gene expression in tobacco (Barreto et al. 2014) and barley (Mostek et al. 2015). In the present study, the up-regulation of Unigene64782 in PF4 may help to increase the synthesis of ATP and therefore provide more energy for PF4 growth than that for PF2 growth.
The unigene coding for chlorophyll a/b binding protein was also up-regulated in PF4 compared to PF2 regardless of culture conditions with or without salt. The major light-harvesting chlorophyll a/b binding complex of photosystem II (LHCb2) constitutes more than 40% of the photosynthetic membrane proteins and about half of the total thylakoid pigments in higher plants (Green and Durnford 1996). LHCb2 help the plant to adapt to the environment change (Mohanty et al. 2002). High expression levels of LHCb2 were found to be light-dependent and regulated at least partially at the transcriptional level by a photoreceptor phytochrome (Peer et al. 1996). Overall, up-regulation of these three photosynthesis-related DEUs (CL13291.Contig1, Unigene64782, Unigene4505) in PF4 supports the observation that PF4 is stronger and more energetic than PF2 under saline environment.
DEUs related to plant growth
We found ten growth-related unigenes that were differentially expressed in PF2 versus PF4 and normal versus salt conditions. Three of the DEUs (CL2574.Contig4, CL8577.Contig2, CL11064.Contig4) were predicted to be involved in primary cell wall biosynthesis and were upregulated in PF4 compared to PF2. CL2574.Contig4 was annotated as a glycosyltransferases (GT) involved in various biological processes such as cell wall formation, plant growth and development, storage polysaccharides biosynthesis, and glycosylation of various metabolites (Sado et al. 2009). In Arabidopsis thaliana, UDP-glucosyltransferase UGT74E2, one kind of GTs, plays a prominent role in stress-induced protective architectural changes in plants (Tognetti et al. 2010). CL8577.Contig2 was involved in multidimensional cell growth and cell wall cellulose and pectin metabolic processes. CL11064.Contig4 was involved in regulation of cellulose biosynthetic process. In our previous study, we found that the wood fiber length, fiber aspect ratio, wall thickness, wall cavity ratio, and diameter cavity ratio of PF4 were larger than those of PF2 (Wang et al. 2014). The up-regulation of these three DEUs in PF4 may be one of the reasons why PF4 grows bigger than PF2.
Plant cell wall pectic polysaccharides are arguably the most complex carbohydrates in nature. Pectin play an important role in plant growth, morphology, development, and plant defense (Mohnen 2008). In our study, two DEUs (CL8577.Contig2 and Unigene32735) related to cell wall pectin metabolic process were up-regulated in PF4. Unigene32735 was predicted to encode a pectin methyltransferase (PMT). PMTs control the extent and pattern of methyl-esterification in pectin within the primary cell wall, and thereby regulate cell–cell adhesion and cell elongation (Ishikawa et al. 2000). The up-regulation of these two DEUs may increase the pectin content in the cells and promote plant growth.
Three DEUs (CL1306.Contig3, Unigene60481, and Unigene37840) were predicted to encode caffeoyl-CoA O-methyltransferase (CCoAOMT). CCoAOMT is essential for lignin biosynthesis and the down-regulation of the enzyme led to a decrease in lignin content in maize (Li et al. 2013). These three DEUs were up-regulated in PF2 versus PF4, PF2S versus PF4S. Lignin, together with flavonoids and other secondary metabolites plays important roles in defense against abiotic stresses (Dixon and Paiva 1995). Lignin also confers the mechanical strength in woody tissue needed for plant growth and resistance to pathogen invasion (Hallac et al. 2010). Some up-regulated genes relate to lignin biosynthesis were reported to enhance the plant’s salt tolerance in tomato (Sanchez-Aguayo et al. 2004), Tamarix hispida and Arabidopsis (Li et al. 2009; Shen et al. 2014). All these findings suggest that the up-regulation of CCoAOMT may increase lignin content and salt stress tolerance.
Two DEUs (Unigene36754 and CL10657.Contig8) encoding auxin response factor and auxin-responsive protein IAA, respectively are involved in plant hormone signal transduction. These DEUs were up-regulated in PF4. The regulation of gene expression by auxin is a crucial mechanism in plant growth and development (Hayashi et al. 2008). Auxin facilitates plant resistance to environmental stresses by controlling the expression of auxin responsive family genes, such as Aux/IAA (auxin/indoleacetic acid), GH3 (Gretchen Hagen3) and SAUR (small auxin up RNA). Auxin-related transcriptional regulation is an essential process required for plants to survive and adapt to adverse environmental challenges (Jain and Khurana 2009). In maize, auxin-related genes are up-regulated under abiotic stresses (Feng et al. 2015). Up-regulation of these two auxin-related DEUs in PF4 suggests that these two genes promote stronger growth in PF4 than PF2.
DEUs related to osmolytes
We identified 11 DEUs involved in osmoregulation. Ten of them were predicted to encode late embryogenesis abundant (LEA) proteins, including five DEUs up-regulated in PF4 (Unigene18913, CL15360.Contig2, CL6982.Contig9, CL6982.Contig7, and CL4052.Contig2) and five DEUs up-regulated after salt treatment (CL1764.Contig1, CL1764.Contig2, CL1764.Contig3, CL1764.Contig4 and Unigene39522). LEA proteins are composed mainly of hydrophilic amino acids that could protect cells from salt damage by replacing water molecules. The accumulation of LEAs may improve salt tolerance and reduce the damage of salt stress in plants (Ashraf and Akram 2009; Dalal et al. 2009). LEA protein interacts with a zinc finger transcription factor to co-regulate ascorbate peroxidase which has the most affinity for H2O2 (Huang et al. 2018a). Furthermore, OsLEA5 participates in the accumulation of ABA by up-regulating ABA biosynthesis genes and down-regulating ABA metabolism genes. OsLEA5 might participates in the ABA-mediated antioxidant defense to function in salt stress response (Huang et al. 2018b). The other osmolyte-related DEU (Unigene17670) was predicted to encode aldehyde dehydrogenase (ALDH) and up-regulated in PF4. ALDH is involved in arginine and proline metabolism, and over-expression of ALDH in Arabidopsis was reported to confer salinity tolerance (Sunkar et al. 2003). In Arabidopsis, after a key gene involved in proline synthesis was knocked out, proline content decreased and the plant became ultra-sensitive to salt damage (Szekely et al. 2008). Proline has been considered to play multiple roles in osmoregulation, removing reactive oxygen species (ROS) and maintaining protein and membrane structure stability under salt stress (Ashraf and Foolad 2007; Verbruggen and Hermans 2008). The up-regulation of ALDH in PF4 may explain why proline content is higher in PF4 than PF2 (Deng et al. 2013). These DEUs related to osmolytes might through different pathways regulate the antioxidant, and then help the Paulownia to resist the salt-stress.
Conclusions
We sequenced the transcriptomes of tetraploid and diploid P. fortunei cultured under normal and salt treatment, by RNA-Seq and obtained a total of 638,242 unigenes, which could serve as a useful database for this species and provide an important resource for functional genomics studies. Many DEUs related to salt stress were retrieved, and the DEU profile data provided a dynamic view of biological process. We identified two dozens of important DEUs including 3 DEUs related to photosynthesis, 10 DEUs related to plant growth and development and 11 DEUs related to osmolytes. These DEUs were upregulated in PF4 compared to PF2 and upregulated under salt stress. They were involved in photosynthesis, biosynthesis of cellulose, pectin, lignin and proline, and plant hormone (auxin) signal transduction. Our data would provide important information for Paulownia tree improvement with superior tolerance to salt tress and also for studying salt resistance mechanisms in other plants.
Electronic supplementary material
Below is the link to the electronic supplementary material.
Correlation coefficients of the gene expression of duplicate samples. Y-axis represents the logarithmic value of diploid (A) or tetraploid (B) expression, while Xaxis represents the logarithmic value of the corresponding duplicate samples. (TIFF 517 kb)
Gene ontology (GO) classification of the P. fortunei unigenes. (TIFF 343 kb)
Clusters of orthologous groups (COG) function classification of the P. fortunei unigenes. (TIFF 339 kb)
The cluster chart of top 100 most heterogeneously expressed unigenes’ expression in PF2 vs. PF2S, PF4 vs. PF4S, PF2 vs. PF4 and PF2S vs. PF4S. (TIFF 393 kb)
The cluster chart of common unigens’ expression in PF2 vs. PF2S and PF4 vs. PF4S (TIFF 175 kb)
The cluster chart of common unigens’ expression in PF2 vs. PF4 and PF2S vs. PF4S (TIFF 285 kb)
Assembly process of the unigenes. (DOCX 14 kb)
Unigene annotations based on their BLASTX hits in the Nr, KEGG, Swiss-Prot, KOG, and GO database. (XLSX 2895 kb)
KEGG annotation of unigenes. (XLSX 15 kb)
Differentially expressed unigenes in PF2 vs. PF2S, PF4 vs. PF4S, PF2 vs. PF4 and PF2S vs. PF4S. (XLSX 3695 kb)
Differentially expressed unigenes in comparison A, B, C and D. comparison A: consistently differentially expressed unigenes in PF2 vs. PF2S and PF4 vs. PF4S. comparison B: Inconsistently differentially expressed unigenes in PF2 vs. PF2S and PF4 vs. PF4S. comparison C : differentially expressed unigenes up-regulated in both PF2S vs. PF4S and PF2 vs. PF4, up-regulated in PF2S vs. PF4S and down-regulated in PF2 vs. PF4. comparison D: differentially expressed unigenes down-regulated in both PF2S vs. PF4S and PF2 vs. PF4, down-regulated in PF2S vs. PF4S and up-regulated in PF2 vs. PF4 . (XLSX 564 kb)
GO enrichment result for differentially expressed unigenes comparison A, B, C and D. (XLSX 226 kb)
KEGG pathway analysis results for differentially expressed unigenes in comparison A, B, C and D (XLSX 39 kb)
Key DEUs related to photosynthesis, plant growth and osmolytes. (XLSX 12 kb)
Acknowledgements
This work was supported by the Key Science and Technology Program of Henan Province of China (No. 152107000097), the Natural Science Foundation of Henan Province of China (No. 162300410158), and the Distinguished Talents Foundation of Henan Province of China (No. 174200510001).
Compliance with Ethical Standards
Conflict of interest
The authors declare that they have no conflict of interests.
Contributor Information
Guoqiang Fan, Phone: +86-0371-63558605, Email: fanguoqiangdr@163.com.
Heping Cao, Phone: 504-286-4351, Email: Heping.Cao@ars.usda.gov.
References
- Ashraf M, Akram NA. Improving salinity tolerance of plants through conventional breeding and genetic engineering: an analytical comparison. Biotechnol Adv. 2009;27:744–752. doi: 10.1016/j.biotechadv.2009.05.026. [DOI] [PubMed] [Google Scholar]
- Ashraf M, Foolad MR. Roles of glycine betaine and proline in improving plant abiotic stress resistance. Environ Exp Bot. 2007;59:206–216. doi: 10.1016/j.envexpbot.2005.12.006. [DOI] [Google Scholar]
- Barreto P, Okura VK, Neshich IA, Maia Ide G, Arruda P. Overexpression of UCP1 in tobacco induces mitochondrial biogenesis and amplifies a broad stress response. BMC Plant Biol. 2014;14:144. doi: 10.1186/1471-2229-14-144. [DOI] [PMC free article] [PubMed] [Google Scholar]
- Bi H, Wang M, Jiang Z, Dong X, Ai X. Impacts of suboptimal temperature and low light intensity on the activities and gene expression of photosynthetic enzymes in cucumber seedling leaves. Chin J Appl Ecol. 2011;22:2894–2900. [PubMed] [Google Scholar]
- Bi H, Dong X, Wu G, Wang M, Ai X. Decreased TK activity alters growth, yield and tolerance to low temperature and low light intensity in transgenic cucumber plants. Plant Cell Rep. 2015;34:345–354. doi: 10.1007/s00299-014-1713-5. [DOI] [PubMed] [Google Scholar]
- Chao DY, Dilkes B, Luo H, Douglas A, Yakubova E, Lahner B, Salt DE. Polyploids exhibit higher potassium uptake and salinity tolerance in Arabidopsis. Science. 2013;341:658–659. doi: 10.1126/science.1240561. [DOI] [PMC free article] [PubMed] [Google Scholar]
- Conesa A, Gotz S, Garcia-Gomez JM, Terol J, Talon M, Robles M. Blast2GO: a universal tool for annotation, visualization and analysis in functional genomics research. Bioinformatics. 2005;21:3674–3676. doi: 10.1093/bioinformatics/bti610. [DOI] [PubMed] [Google Scholar]
- Dalal M, Tayal D, Chinnusamy V, Bansal KC. Abiotic stress and ABA-inducible Group 4 LEA from Brassica napus plays a key role in salt and drought tolerance. J Biotechnol. 2009;139:137–145. doi: 10.1016/j.jbiotec.2008.09.014. [DOI] [PubMed] [Google Scholar]
- Deng B, Du W, Liu C, Sun W, Tian S, Dong H. Antioxidant response to drought, cold and nutrient stress in two ploidy levels of tobacco plants: low resource requirement confers polytolerance in polyploids? Plant Growth Regul. 2011;66:37–47. doi: 10.1007/s10725-011-9626-6. [DOI] [Google Scholar]
- Deng M, Zhang X, Fan G, Zhao Z, Dong Y, Wei Z. Physiological responses to salt stress of tetraploid Paulownia australis and Paulownia fortunei plants. J Henan Agric Univ. 2013;47:698–975. [Google Scholar]
- Deng M, Dong Y, Zhao Z, Li Y, Fan G. Dissecting the proteome dynamics of the salt stress induced changes in the leaf of diploid and autotetraploid Paulownia fortunei. PLoS ONE. 2017;12:e0181937. doi: 10.1371/journal.pone.0181937. [DOI] [PMC free article] [PubMed] [Google Scholar]
- Dixon RA, Paiva NL. Stress-induced phenylpropanoid metabolism. Plant Cell. 1995;7:1085–1097. doi: 10.1105/tpc.7.7.1085. [DOI] [PMC free article] [PubMed] [Google Scholar]
- Dong Y, Fan G, Zhao Z, Deng M. Compatible solute, transporter protein, transcription factor, and hormone-related gene expression provides an indicator of drought stress in Paulownia fortunei. Funct Integr Genomics. 2014;14:479–491. doi: 10.1007/s10142-014-0373-4. [DOI] [PMC free article] [PubMed] [Google Scholar]
- Dong YP, Fan GQ, Zhao ZL, Xu EK, Deng MJ, Wang LM, Niu SY. Transcriptome-wide profiling and expression analysis of two accessions of Paulownia australis under salt stress. Tree Genet Genomes. 2017 [Google Scholar]
- Essl F. From ornamental to detrimental? The incipient invasion of Central Europe by Paulownia tomentosa. Preslia. 2007;79:377–389. [Google Scholar]
- Fan G, Cao Y, Zhao Z, Yang Z. Induction of Autotetraploid of Paulownia fortunei. Scientia Silvae Sinicae. 2007;43:31–35. [Google Scholar]
- Fan G, Li X, Deng M, Zhao Z, Yang L. Comparative analysis and Identification of miRNAs and their target genes responsive to salt stress in diploid and tetraploid Paulownia fortunei seedlings. PLoS ONE. 2016;11:e0149617. doi: 10.1371/journal.pone.0149617. [DOI] [PMC free article] [PubMed] [Google Scholar]
- Fan G, Wang L, Deng M, Zhao Z, Dong Y, Zhang X, Li Y. Changes in transcript related to osmosis and intracellular ion homeostasis in Paulownia tomentosa under salt stress. Front Plant Sci. 2016;7:384. doi: 10.3389/fpls.2016.00384. [DOI] [PMC free article] [PubMed] [Google Scholar]
- Fan G, et al. Genome of Paulownia (Paulownia fortunei) illuminates the related transcripts, miRNA and proteins for salt resistance. Sci Rep. 2017;7:1285. doi: 10.1038/s41598-017-01360-9. [DOI] [PMC free article] [PubMed] [Google Scholar]
- Feng S, et al. Genome-wide identification, expression analysis of auxin-responsive GH3 family genes in maize (Zea mays L.) under abiotic stresses. J Integr Plant Biol. 2015;57:783–795. doi: 10.1111/jipb.12327. [DOI] [PubMed] [Google Scholar]
- Gong Q, Li P, Ma S, Indu Rupassara S, Bohnert HJ. Salinity stress adaptation competence in the extremophile Thellungiella halophila in comparison with its relative Arabidopsis thaliana. Plant J. 2005;44:826–839. doi: 10.1111/j.1365-313X.2005.02587.x. [DOI] [PubMed] [Google Scholar]
- Grabherr MG, et al. Full-length transcriptome assembly from RNA-Seq data without a reference genome. Nat Biotechnol. 2011;29:644–652. doi: 10.1038/nbt.1883. [DOI] [PMC free article] [PubMed] [Google Scholar]
- Green BR, Durnford DG. The chlorophyll–carotenoid proteins of oxygenic photosynthesis. Annu Rev Plant Physiol Plant Mol Biol. 1996;47:685–714. doi: 10.1146/annurev.arplant.47.1.685. [DOI] [PubMed] [Google Scholar]
- Hallac BB, Pu Y, Ragauskas AJ. Chemical transformations of Buddleja davidii lignin during ethanol organosolv pretreatment. Energy Fuels. 2010;24:2723–2732. doi: 10.1021/ef901556u. [DOI] [Google Scholar]
- Hayashi K, Tan X, Zheng N, Hatate T, Kimura Y, Kepinski S, Nozaki H. Small-molecule agonists and antagonists of F-box protein-substrate interactions in auxin perception and signaling. Proc Natl Acad Sci USA. 2008;105:5632–5637. doi: 10.1073/pnas.0711146105. [DOI] [PMC free article] [PubMed] [Google Scholar]
- Huang L, et al. The ascorbate peroxidase APX1 is a direct target of a zinc finger transcription factor ZFP36 and a late embryogenesis abundant protein OsLEA5 interacts with ZFP36 to co-regulate OsAPX1 in seed germination in rice. Biochem Biophys Res Commun. 2018;495:339–345. doi: 10.1016/j.bbrc.2017.10.128. [DOI] [PubMed] [Google Scholar]
- Huang L et al (2018b) An atypical late embryogenesis abundant protein OsLEA5 plays a positive role In ABA-induced antioxidant defense. In: Oryza Sativa L. Plant and Cell Physiology. 10.1093/pcp/pcy035 [DOI] [PubMed]
- Ipekci Z, Gozukirmizi N. Direct somatic embryogenesis and synthetic seed production from Paulownia elongata. Plant Cell Rep. 2003;22:16–24. doi: 10.1007/s00299-003-0650-5. [DOI] [PubMed] [Google Scholar]
- Iseli C, Jongeneel CV, Bucher P (1999) ESTScan: a program for detecting, evaluating, and reconstructing potential coding regions in EST sequences. In: ISMB, pp 138–148 [PubMed]
- Ishikawa M, Kuroyama H, Takeuchi Y, Tsumuraya Y. Characterization of pectin methyltransferase from soybean hypocotyls. Planta. 2000;210:782–791. doi: 10.1007/s004250050680. [DOI] [PubMed] [Google Scholar]
- Ismail AM, Horie T. Genomics, Physiology, and Molecular Breeding Approaches for Improving Salt Tolerance. Annu Rev Plant Biol. 2017;68:405–434. doi: 10.1146/annurev-arplant-042916-040936. [DOI] [PubMed] [Google Scholar]
- Jain M, Khurana JP. Transcript profiling reveals diverse roles of auxin-responsive genes during reproductive development and abiotic stress in rice. FEBS J. 2009;276:3148–3162. doi: 10.1111/j.1742-4658.2009.07033.x. [DOI] [PubMed] [Google Scholar]
- Kanehisa M, Goto S. KEGG: kyoto encyclopedia of genes and genomes. Nucleic Acids Res. 2000;28:27–30. doi: 10.1093/nar/28.1.27. [DOI] [PMC free article] [PubMed] [Google Scholar]
- Li H, Wang Y, Jiang J, Liu G, Gao C, Yang C. Identification of genes responsive to salt stress on Tamarix hispida roots. Gene. 2009;433:65–71. doi: 10.1016/j.gene.2008.12.007. [DOI] [PubMed] [Google Scholar]
- Li X, Yu E, Fan C, Zhang C, Fu T, Zhou Y. Developmental, cytological and transcriptional analysis of autotetraploid Arabidopsis. Planta. 2012;236:579–596. doi: 10.1007/s00425-012-1629-7. [DOI] [PubMed] [Google Scholar]
- Li X, Chen W, Zhao Y, Xiang Y, Jiang H, Zhu S, Cheng B. Downregulation of caffeoyl-CoA O-methyltransferase (CCoAOMT) by RNA interference leads to reduced lignin production in maize straw. Genet Mol Biol. 2013;36:540–546. doi: 10.1590/S1415-47572013005000039. [DOI] [PMC free article] [PubMed] [Google Scholar]
- Magnan F, Ranty B, Charpenteau M, Sotta B, Galaud JP, Aldon D. Mutations in AtCML9, a calmodulin-like protein from Arabidopsis thaliana, alter plant responses to abiotic stress and abscisic acid. Plant J. 2008;56:575–589. doi: 10.1111/j.1365-313X.2008.03622.x. [DOI] [PubMed] [Google Scholar]
- McDonagh B, Pedrajas JR, Padilla CA, Barcena JA (2013) Thiol redox sensitivity of two key enzymes of heme biosynthesis and pentose phosphate pathways: uroporphyrinogen decarboxylase and transketolase. Oxid Med Cell Longev Article ID 932472. 10.1155/2013/932472 [DOI] [PMC free article] [PubMed]
- Mohanty P, Vani B, Prakash JS. Elevated temperature treatment induced alteration in thylakoid membrane organization and energy distribution between the two photosystems in Pisum sativum. Z Naturforsch C. 2002;57:836–842. doi: 10.1515/znc-2002-9-1014. [DOI] [PubMed] [Google Scholar]
- Mohnen D. Pectin structure and biosynthesis. Curr Opin Plant Biol. 2008;11:266–277. doi: 10.1016/j.pbi.2008.03.006. [DOI] [PubMed] [Google Scholar]
- Mostek A, Borner A, Badowiec A, Weidner S. Alterations in root proteome of salt-sensitive and tolerant barley lines under salt stress conditions. J Plant Physiol. 2015;174:166–176. doi: 10.1016/j.jplph.2014.08.020. [DOI] [PubMed] [Google Scholar]
- Peer W, Silverthorne J, Peters JL. Developmental and light-regulated expression of individual members of the light-harvesting complex b gene family in Pinus palustris. Plant Physiol. 1996;111:627–634. doi: 10.1104/pp.111.2.627. [DOI] [PMC free article] [PubMed] [Google Scholar]
- Pertea G, et al. TIGR Gene Indices clustering tools (TGICL): a software system for fast clustering of large EST datasets. Bioinformatics. 2003;19:651–652. doi: 10.1093/bioinformatics/btg034. [DOI] [PubMed] [Google Scholar]
- Sado PE, Tessier D, Vasseur M, Elmorjani K, Guillon F, Saulnier L. Integrating genes and phenotype: a wheat–Arabidopsis–rice glycosyltransferase database for candidate gene analyses. Funct Integr Genomics. 2009;9:43–58. doi: 10.1007/s10142-008-0100-0. [DOI] [PubMed] [Google Scholar]
- Sanchez-Aguayo I, Rodriguez-Galan JM, Garcia R, Torreblanca J, Pardo JM. Salt stress enhances xylem development and expression of S-adenosyl-l-methionine synthase in lignifying tissues of tomato plants. Planta. 2004;220:278–285. doi: 10.1007/s00425-004-1350-2. [DOI] [PubMed] [Google Scholar]
- Shen X, et al. Transcriptomic profiling revealed an important role of cell wall remodeling and ethylene signaling pathway during salt acclimation in Arabidopsis. Plant Mol Biol. 2014;86:303–317. doi: 10.1007/s11103-014-0230-9. [DOI] [PubMed] [Google Scholar]
- Srivastava AK, Alexova R, Jeon YJ, Kohli GS, Neilan BA. Assessment of salinity-induced photorespiratory glycolate metabolism in Anabaena sp. PCC 7120. Microbiology. 2011;157:911–917. doi: 10.1099/mic.0.045682-0. [DOI] [PubMed] [Google Scholar]
- Sunkar R, Bartels D, Kirch HH. Overexpression of a stress-inducible aldehyde dehydrogenase gene from Arabidopsis thaliana in transgenic plants improves stress tolerance. Plant J. 2003;35:452–464. doi: 10.1046/j.1365-313X.2003.01819.x. [DOI] [PubMed] [Google Scholar]
- Szekely G, et al. Duplicated P5CS genes of Arabidopsis play distinct roles in stress regulation and developmental control of proline biosynthesis. Plant J. 2008;53:11–28. doi: 10.1111/j.1365-313X.2007.03318.x. [DOI] [PubMed] [Google Scholar]
- Tognetti VB, et al. Perturbation of indole-3-butyric acid homeostasis by the UDP-glucosyltransferase UGT74E2 modulates Arabidopsis architecture and water stress tolerance. Plant cell. 2010;22:2660–2679. doi: 10.1105/tpc.109.071316. [DOI] [PMC free article] [PubMed] [Google Scholar]
- Verbruggen N, Hermans C. Proline accumulation in plants: a review. Amino Acids. 2008;35:753–759. doi: 10.1007/s00726-008-0061-6. [DOI] [PubMed] [Google Scholar]
- Wang X, Deng M, Shen L, Zhang X, Zhai X, Liu Y, Fan G. Differential analysis of fiber characteristics and chemical properties between tetraploid Paulownia fortunei and its diploid. J Henan Agric Univ. 2014;5:585–589. [Google Scholar]
- Wang X, et al. Expression of TaWRKY44, a wheat WRKY gene, in transgenic tobacco confers multiple abiotic stress tolerances. Front Plant Sci. 2015;6:615. doi: 10.3389/fpls.2015.00615. [DOI] [PMC free article] [PubMed] [Google Scholar]
- Wang Z, et al. Implications of polyploidy events on the phenotype, microstructure, and proteome of Paulownia australis. PLoS ONE. 2017;12:e0172633. doi: 10.1371/journal.pone.0172633. [DOI] [PMC free article] [PubMed] [Google Scholar]
- Xu P, et al. Wheat cryptochromes: subcellular localization and involvement in photomorphogenesis and osmotic stress responses. Plant Physiol. 2009;149:760–774. doi: 10.1104/pp.108.132217. [DOI] [PMC free article] [PubMed] [Google Scholar]
- Xu J, Xing X-J, Tian Y-S, Peng R-H, Xue Y, Zhao W, Yao Q-H. Transgenic Arabidopsis plants expressing tomato glutathione S-transferase showed enhanced resistance to salt and drought stress. PLoS ONE. 2015;10:e0136960. doi: 10.1371/journal.pone.0136960. [DOI] [PMC free article] [PubMed] [Google Scholar]
- Ye J, et al. WEGO: a web tool for plotting GO annotations. Nucleic Acids Res. 2006;34:W293–W297. doi: 10.1093/nar/gkl031. [DOI] [PMC free article] [PubMed] [Google Scholar]
- Zhao Z, Li Y, Liu H, Zhai X, Deng M, Dong Y, Fan G. Genome-wide expression analysis of salt-stressed diploid and autotetraploid Paulownia tomentosa. PLoS ONE. 2017;12:e0185455. doi: 10.1371/journal.pone.0185455. [DOI] [PMC free article] [PubMed] [Google Scholar]
- Zhou L, Wang NN, Gong SY, Lu R, Li Y, Li XB. Overexpression of a cotton (Gossypium hirsutum) WRKY gene, GhWRKY34, in Arabidopsis enhances salt-tolerance of the transgenic plants. Plant Physiol Biochem. 2015;96:311–320. doi: 10.1016/j.plaphy.2015.08.016. [DOI] [PubMed] [Google Scholar]
Associated Data
This section collects any data citations, data availability statements, or supplementary materials included in this article.
Supplementary Materials
Correlation coefficients of the gene expression of duplicate samples. Y-axis represents the logarithmic value of diploid (A) or tetraploid (B) expression, while Xaxis represents the logarithmic value of the corresponding duplicate samples. (TIFF 517 kb)
Gene ontology (GO) classification of the P. fortunei unigenes. (TIFF 343 kb)
Clusters of orthologous groups (COG) function classification of the P. fortunei unigenes. (TIFF 339 kb)
The cluster chart of top 100 most heterogeneously expressed unigenes’ expression in PF2 vs. PF2S, PF4 vs. PF4S, PF2 vs. PF4 and PF2S vs. PF4S. (TIFF 393 kb)
The cluster chart of common unigens’ expression in PF2 vs. PF2S and PF4 vs. PF4S (TIFF 175 kb)
The cluster chart of common unigens’ expression in PF2 vs. PF4 and PF2S vs. PF4S (TIFF 285 kb)
Assembly process of the unigenes. (DOCX 14 kb)
Unigene annotations based on their BLASTX hits in the Nr, KEGG, Swiss-Prot, KOG, and GO database. (XLSX 2895 kb)
KEGG annotation of unigenes. (XLSX 15 kb)
Differentially expressed unigenes in PF2 vs. PF2S, PF4 vs. PF4S, PF2 vs. PF4 and PF2S vs. PF4S. (XLSX 3695 kb)
Differentially expressed unigenes in comparison A, B, C and D. comparison A: consistently differentially expressed unigenes in PF2 vs. PF2S and PF4 vs. PF4S. comparison B: Inconsistently differentially expressed unigenes in PF2 vs. PF2S and PF4 vs. PF4S. comparison C : differentially expressed unigenes up-regulated in both PF2S vs. PF4S and PF2 vs. PF4, up-regulated in PF2S vs. PF4S and down-regulated in PF2 vs. PF4. comparison D: differentially expressed unigenes down-regulated in both PF2S vs. PF4S and PF2 vs. PF4, down-regulated in PF2S vs. PF4S and up-regulated in PF2 vs. PF4 . (XLSX 564 kb)
GO enrichment result for differentially expressed unigenes comparison A, B, C and D. (XLSX 226 kb)
KEGG pathway analysis results for differentially expressed unigenes in comparison A, B, C and D (XLSX 39 kb)
Key DEUs related to photosynthesis, plant growth and osmolytes. (XLSX 12 kb)