Abstract
Sucrose synthesis/accumulation in sugarcane depends on the source–sink communication wherein source responds to sink demand for photoassimilate supply. Sucrose in stalk (sink) acts as signal, and sends feedback to restrain further synthesis of sucrose by regulating photosynthetic efficiency of leaves (source). Hence sucrose synthesis/accumulation is controlled by many genes and regulatory sequences including 3 invertases (SAI, CWI, NI), sucrose synthase (SuSy) and sucrose phosphate synthase (SPS). SPS and invertase play key role in enhancing sink strength which ultimately promotes greater sucrose accumulation in the sink tissues. In present study, a significant positive correlation was found between sucrose% of source and sink tissues which was greater in the top (R2= 0.679) than middle (R2= 0.580) and bottom (R2= 0.518) internodes, depicting that sucrose accumulation in the stalk bears a direct relation with sucrose translocation efficiency from source. Results indicated an increased sucrose% with maturity, while reducing sugar content decreased with crop growth. qRT-PCR results exhibited an elevated expression of invertase in immature sink tissues depicting increased sink requirement, which declined with maturity. Similarly, increased PEP carboxylase gene expression as observed supported the fact that higher sink demand results in enhanced photosynthetic rate and thus influences the source activity. SPS was found active at initial stage of cane development indicating its role in sucrose synthesis. Thus by studying expression patterns of the different genes both, in source and sink tissues, a better understanding of the sucrose accumulation pathway in sugarcane is possible, which in turn can help in elucidating ways to enhance sucrose concentration in sink.
Keywords: Source–sink, qRT-PCR, Sucrose accumulation, Sink strength, Sink demand
Introduction
Sucrose is the main essence of sugarcane (Saccharum spp.) that makes it one of the important cash crops globally (Gayler and Glasziou 1972). It is the primary product of photosynthesis translocated to the stalk where it is utilized as source of energy in growth and metabolism (ap Rees 1987). Sugarcane is mainly grown in tropical and subtropical areas and fixes carbon through C4 mechanism and produces around 70% sucrose worldwide. The crop is used both for food and biofuel/ethanol (Grof et al. 2007). In many un-selected sugarcane genotypes, the level of sucrose that has been reported ranged from 500 to 600 mg g−1 stalk dry mass under experimental field conditions (Berding 1997; Inman-Bamber et al. 2008; Bull and Glasziou 1963; Moore 1995), and was found to be substantially higher than reported in commercial sugarcane varieties grown under standard conditions (Chandra et al. 2015). Studies based on biophysical limit had shown that theoretically, sugarcane stalks can store around 30% sucrose (fresh mass) (Bull and Glasziou 1963; Grof and Campbell 2001) indicating that the current sugar yield is still only 65% of the predicted capacity of sugarcane culm tissue (Moore et al. 1997; Jackson 2005). This suggest that sugarcane stalk has enough potential to store good amount of sucrose in its stalk (Grof and Campbell 2001) and at the same time indicates the presence of complex mechanism that control the sucrose storage in stalk (Chandra et al. 2015).To reduce transport cost, sugar industries worldwide preferred enhanced sucrose content in cane rather cane yield so that gain in sucrose content could be exploited economically. To make breeding practice successful, studies are required for better understanding of sucrose accumulation pathway, by gaining information as to how sucrose formation, transportation and accumulation is controlled by source–sink communication. This in fact is considered as one of the key aspect that can help in improving sucrose content (Moore et al. 1997; McCormick et al. 2009; Chandra et al. 2012).
Functionally plants are divided into ‘source’ where net carbon dioxide fixation take place and ‘sink’ where assimilates finally get stored. In case of sugarcane, the leaves are considered as source whereas assimilate in the form of sucrose get stored in stalk, thus functioning as sink. The quantity of sucrose supplied by the source depends on photosynthetic activity and partitioning between different processes, like starch synthesis in the chloroplast and export of triose-phosphates from the chloroplast, and these processes govern synthesis and storage of sucrose in vacuole. Alteration in any of these factors affects source–sink relationship in plant (Lemoine et al. 2013). Sugarcane represents complex source–sink system, where sucrose storage occurs in the stalk parenchymatic cells but not in the ultimate sink tissues. In various plant species including sugarcane, a close coordination is observed between source photosynthetic activity and sink carbon demand (McCormick et al. 2008). A decline in source photoassimilate is observed when limited sink demand for carbohydrate is desired (Franck et al. 2006). Contrary to this, increased photosynthetic rate is observed in source tissues when sink demand is higher (Jeschke and Hilpert 1997; McCormick et al. 2006). These studies indicated that source–sink relationship in plants is mainly directed by sink (Paul and Foyer 2001; Watt et al. 2005; McCormick et al. 2006).
In sugarcane, sink demand for photoassimilate is the main driving factor that guides accumulation of sucrose in maturing sugarcane stalk (Marcelis 1996). As sucrose production, transportation and accumulation is regulated by many genes and regulatory sequences, the expression profile of the essential genes and pattern of sucrose accumulation in both source and sink tissues in totality is needed to better understand the source–sink relationship (McCormick et al. 2006, 2009; Chandra 2011; Chandra et al. 2011). Studies so far has primarily focused on sink tissues. Presence of variable concentration of sucrose in the sugarcane culm that depends on their developmental stages, growing conditions, genotype and enzymes namely sucrose synthase (SuSy), sucrose phosphate synthase (SPS) and three invertases (cell wall, neutral and soluble acid invertase) play important role in synthesis, breakdown and transport of sucrose in both leaf and stem tissues (Lingle and Smith 1991; Buczynski et al. 1993; Moore 1995). Invertases are the main enzyme in maintaining strong source–sink relationship (Roitsch et al. 2003). In the present investigation, a high sucrose accumulating variety CoJ 64 was contemplated in studying source–sink communication by visualizing the expression patterns of the different genes that are involved in the sucrose metabolism along with pattern of sucrose accumulation in source and sink tissues at different stages of the crop.
Materials and methods
Plant material
An early maturing, high sucrose accumulating sugarcane variety, namely, CoJ 64, was preferred for the study. It was grown at the ICAR-Indian Institute of Sugarcane Research farm (26.78° N, 80.99° E, 111 msl) Lucknow, India. Three bud sets of sugarcane were planted under irrigated condition with a row-to-row distance of 90 cm, in the last week of February, 2016 referred to as spring planting following normal agronomical practices. Cane maturation begins in September when minimum and maximum temperatures are 14–20 °C and 28–32 °C respectively that favour sugar synthesis and its storage. All analyses were performed in three biological replications. Samplings were accomplished at 210 DAP (days after planting) and then at every 30 days interval viz., 240 DAP, 270 DAP, 300 DAP and 330 DAP. Plant height was determined from the bottom most internode to the LTM (last transverse mark). Sampling was performed by dividing the stalk into three equal portions depending on their internode number, and then specific internode was selected in each portion, marked as bottom middle and top internode for further analysis. Sample from the leaves were also collected designated as source leaf (young leaves), LTM (last transverse mark) leaf and sink leaf (that is found attached to the stalk and below the LTM leaf).
Extraction and estimation of total and reducing sugars
Sucrose% and reducing sugar% were determined in bottom, middle and top internodes of cane and in the three types of leaf i.e. source, LTM and sink leaf at 210, 240, 270, 300 and 330 DAP (days after planting). Fresh cane juice was diluted 100 times and was used to estimate sugar content whereas in case of leaf, sugar was extracted by grinding freshly weighed sample in distilled water. Sugar was determined by Nelson’s method (1944). Total sugar was estimated by hydrolyzing the total sugar by adding 0.1 N HCl solution and then boiling the samples for 15 min on the water bath. After adding arseno-molybdate reagent, the optical density of the solution was estimated at 540 nm. Sucrose% was estimated by deducting the value of the reducing sugar% from the total sugar%. Brix value depicts the total soluble solids present in juice that includes both sugars and non-sugar molecules. Brix values, an indicator of sucrose% in juice were determined using digital hand refractometer (PAL-1, Atago, Tokyo).
Enzyme extraction and assay
Enzyme extraction was performed by grinding weighed samples in extraction buffer (Zhu et al. 1997) from bottom, middle and top internodes and from three leaves of the cane. Invertase activity was estimated at 37 °C. Assay mixture contained 250 µl of enzyme extract and 2 ml of 0.1 M citrate buffer (pH 5.2). The reaction was initiated by the addition of 1 ml of 2% sucrose solution. For the control, sucrose was not added in the assay solution. Control sample was boiled for 20 min on water bath to stop the hydrolysis of the endogenous sucrose present in the extract. Reactions were incubated at 37 °C for 2 h, and then, reaction was stopped by boiling for 10 min. Hexoses produced after the incubation was estimated by Nelson’s method in both experimental and control tubes. Absorbance was measured at 540 nm and differences in the absorbance of control and experiment depicted the invertase activity. Activity of SPS enzyme was analyzed by the synthesis of sucrose at 37 °C at pH 7.5 (Hubbard et al. 1989). 12.5 µl of enzyme extract was added to 12.5 µl of assay solution. The assay solution consists of 100 mM HEPES (pH 7.5), 20 mM Glu-6-P, 4 mM Fru-6-P, 3 mM UDP-Glc, 5 mM MgCl2 and 1 mM EDTA. For the control, UDP-Glc was not added in assay solutions. Reactions were then incubated at 37 °C for 1 h and then reaction was stopped by boiling for 3 min. Sucrose produced was then estimated by using anthrone method postulated by Van Handel (1968) that involved addition of 20 µl of 30% KOH to 20 µl of reaction mixture and then boiled for 10 min, cooled down at room temperature. Synthesized sucrose was then estimated by adding 2 ml of freshly prepared anthrone reagent to 5 µl reaction mixture and then incubated at 37 °C for 20 min. Absorbance was measured at 650 nm of control and experimental samples. Protein content in enzyme extract was estimated by the Lowry method (1951) using BSA as the standard protein.
Extraction of the total RNA and semi-quantitative RT-PCR (end-point) analysis
Samples from bottom, middle, and top internodes and three kinds of leaves was collected at different DAP viz. 210, 240, 270, 300 and 330 DAP. Total RNA from these samples was isolated using TRIzol (Invitrogen, USA) reagent. The quantity and integrity of the isolated RNA was checked on 1.0% agarose gels. RNA concentration in all the samples was first normalized on agarose gel and on the nanodrop (Quawell UV–visible spectrophotometer). cDNA synthesis and reverse transcriptase PCR was performed using one-step reverse transcriptase PCR kit (Qiagen, USA). 25S ribosomal RNA (25S rRNA) was used as reference gene to normalize gene expression (Iskandar et al. 2004). As per Table 1, specific primers were used to carry out the expression analysis. The reaction cycles for the end-point PCR were as follows: 50 °C for 30 min, 95 °C for 15 min and then 40 cycles consisting each cycle of 94 °C for 1 min, 58 °C for 1 min, 72 °C for 1 min, and final extension of 72 °C for 10 min. End-point PCR was performed using Surecycler 8800 (Agilent Technologies, USA). Amplified products were separated on 1.6% agarose gel and visualized using gel documentation system (Alpha Innotech, San Leandro, CA, USA).
Table 1.
Primers used in semi-quantitative reverse transcriptase PCR (end point) analysis
| Target gene | Forward primer (5′–3′) | Reverse primer (5′–3′) |
|---|---|---|
| 25S rRNA | GCAGCCAAGCGTTCATAGC | CCTATTGGTGGGTGAACAATCC |
| Soluble acid invertase (SAI) | GCAGCGCACGGGATTCCACT | GCCAGGTGTTGTCCGACGGG |
| Cell wall invertase (CWI) | CTCAAGAACAGCCTCGACCT | AGGTTTGGGTTCAGAGACGA |
| Neutral invertase (NI) | TGTGAACAATGGATCAAAA | GCTGGGTAGCATATCTTGAG |
| Sucrose synthase (SuSy) | CAGCATAGCTTGTTTAAGTAATAC | CTGGTGATGATGAAATCAGTGTG |
| Phosphoenol pyruvate carboxylase (PEPC) | ATCAAGGAGAAACTGGATG | TCAGGAAAGAACTAGACTGC |
| Sucrose transporter (SUT 1) | GTGCTCATCTGCATTGCTGT | CTTGTGCCAATTGTTTGTGG |
Quantitative real-time PCR (qRT-PCR) analysis
First strand cDNA synthesis was done using 2 µg of total RNA, oligo-dT and RevertAid H minus Reverse Transcriptase (Thermo Scientific), as per the manufacturer’s instructions. Gene-specific primers designed corresponding to SAI, CWI, SPS and SuSy (Chandra et al. 2015) (Table 2), were utilized to estimate the genes expression by real-time PCR analysis. The real time PCR was carried out in 48-well plates on a Step One Real-Time PCR system (Applied Biosystems, USA) using SYBR Green PCR Master mix (Applied Biosystems, USA).The cycling conditions used were as follows: 50 °C for 2 min, and 95 °C for 10 min, as holding stage, 40 cycles of 95 °C for 15 s, and 60 °C for 1 min. The gene encoding 25S rRNA (Table 1) was used as reference (i.e. for calibration) in all reactions. Real time PCR was carried out using the relative quantification method and expression ratios were computed from cycle threshold values to obtain 2−∆∆CT or RQ values, depicting fold change.
Table 2.
Primers used in qRT-PCR analysis
| Target gene | Forward primer (5′–3′) | Reverse primer (5′–3′) |
|---|---|---|
| Soluble acid invertase (SAI) | CAGAGGAACTGGATGAACGA | CCGCTTGAAATGTCAATGTC |
| Cell wall invertase (CWI) | TCTGTACAAGCCAACCTTCG | CCGCTTGAAATGTCAATGTC |
| Sucrose synthase (SuSy) | GGCTGTTGCCTGATGCTGTT | TGCTCGGTTCCAATGACCTT |
| Sucrose phosphate synthase (SPS) | CCCGAACATTGCAAGAATTA | CTCCGCTCCTCTCTGTTACC |
Data analysis
Statistical data analysis was conducted on the data derived from three independent experiments conducted on the three biological replicates. Results were depicted as mean ± SD. Real time and end point PCR were also executed in three replications from the three biological replicates.
Results and discussion
Total sugar and hexoses in early maturing high sugar variety
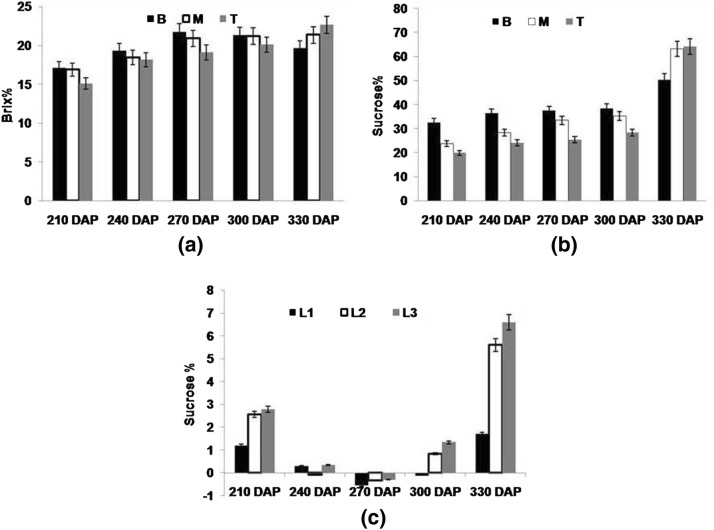
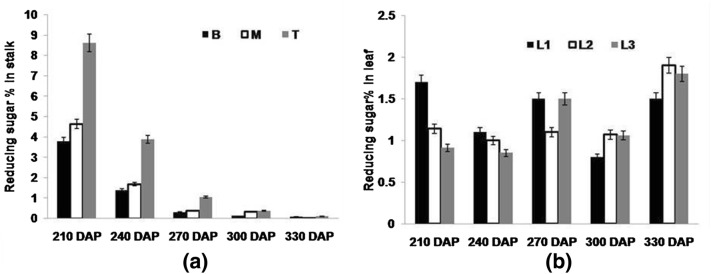
Total sugar and reducing sugars (hexoses) were measured at 210, 240, 270, 300 and 330 DAP in both stalk (sink) and leaf (source) of early maturing high sugar variety (CoJ 64) of sugarcane. Both Brix and sucrose as depicted in Fig. 1a, b showed significant variability among top, middle and bottom internodes. In general, brix% was higher in bottom internode than those in middle and top internodes. It ranged between 17.1 and 21.7% in bottom while in middle and top internodes, it ranged between 15 and 22%. Sucrose, the major sugar present in cane juice decreased from bottom mature to top immature internodes of the cane. Similarly, reducing sugars in general were found higher in the initial growth stages which declined with maturity whereas within cane, it decreases from top to bottom internodes. In bottom internodes reducing sugar% ranged from 3.78 to 0.075%, in middle internodes from 4.63 to 0.02% and in top internodes, it ranged from 8.62% to 0.1% (Fig. 2a). The level of decline in the reducing sugar % was found almost eight times higher in the top internodes from 210 DAP to 270 DAP as it is immature and needs more hexoses for growth and metabolism leading to improved sink strength needed for accumulation of sucrose in its active sucrose accumulating phase i.e. 300 DAP and onwards. As depicted in Fig. 2, both reducing sugar and sucrose content (Fig. 1c) in source leaves decreased with crop growth, which later increased at 330 DAP indicating that they start accumulating in source tissues as the cane reaches maturity. Normally sucrose is synthesized in cytosol of leaf mesophyll cells, enters into phloem cells by proton-sucrose sympoter and finally unloaded in stem parenchyma through cleavage and re-synthesis of sucrose (Jacobsen et al. 1992; Welbaum et al. 1992; Roitsch et al. 1995). In the present study, source leaf being youngest and immature depicted less sucrose% than last transverse mark (LTM) and sink leaves. Though being metabolically active, a drastic decline in the sucrose% was visualized in LTM leaf vis a vis higher sucrose% in sink leaf over source and LTM leaves. No definite pattern was observed with respect to the level of sucrose in source tissues, possibly due to variation in the photosynthetic efficiency of leaves and demand from sink tissues. Hibberd and Covshoff (2010) reported that increased sink demand was found to be associated with increased photosynthetic rate of leaf and a decrease in leaf total sugar content. This was further found in accordance with the up regulation of the C4 photosynthesis related genes. In the present study, a significant positive correlation was observed between sucrose% of source and sink tissues, inferring that sucrose content in sink tissue depends on source efficiency to synthesize it (Table 3). At 210 DAP, leaf (source tissues) showed higher level of sucrose and reducing sugar content. This was in tune with the fact that sink tissues were in its elongation phase and sugar accumulating tendency was less, depicted by highest reducing sugar and lowest sucrose content at 210 DAP in sink tissues indicating greater affinity of metabolic substrates in developing cells of stalk. This was also supported by the fact that a higher correlation was observed in top internode (R2= 0.679) than those observed in middle (R2= 0.580) and bottom (R2= 0.518) internodes (Table 3). At 330 DAP, higher sucrose content in leaf was observed when stalk attains maturity and had no scope for further accumulation of sucrose.
Fig. 1.
a Brix percentage and b sucrose percentage measured in bottom (B) middle (M) and top (T) portions c sucrose percentage in source leaf (L1), LTM leaf (L2) and sink leaf (L3) of CoJ64 at 210, 240, 270, 300 and 330 DAP. Errors bars indicate ± SD from three independent experiments
Fig. 2.
Reducing sugar percentage measured a in bottom (B) middle (M) and top (T) portions b in source leaf (L1), LTM leaf (L2) and sink leaf (L3) of CoJ64 at 210, 240, 270, 300 and 330 DAP. Errors bars indicate ± SD from three independent experiments
Table 3.
Analysis of correlation between different parameters (invertase specific activity, sink sucrose%, source sucrose%, reducing sugar% of sink and SPS specific activity) in bottom, middle and top internodes
| Invertase specific activity vs sucrose% | Invertase specific activity vs reducing sugar% | Source sucrose% vs Sink Sucrose% | Sucrose% vs SPS specific activity | |
|---|---|---|---|---|
| Bottom internodes | y = − 0.097x + 5.20 R2 = 0.723 |
y = 0.433x + 0.901 R2 = 0.790 |
y = 1.962x + 35.64 R2 = 0.518 |
y = − 0.036x + 49.08 R2 = 0.45 |
| Middle internodes | y = − 0.082x + 5.270 R2 = 0.545 |
y = 0.482x + 1.559 R2 = 0.288 |
y = 4.797x + 28.58 R2 = 0.580 |
y = − 0.103x + 63.29 R2 = 0.373 |
| Top internodes | y = − 0.058x + 4.35 R2 = 0.269 |
y = 0.556x + 0.892 R2 = 0.954 |
y = 6.071x + 21.97 R2 = 0.679 |
y = − 0.035x + 43.50 R2 = 0.108 |
Enzyme activity
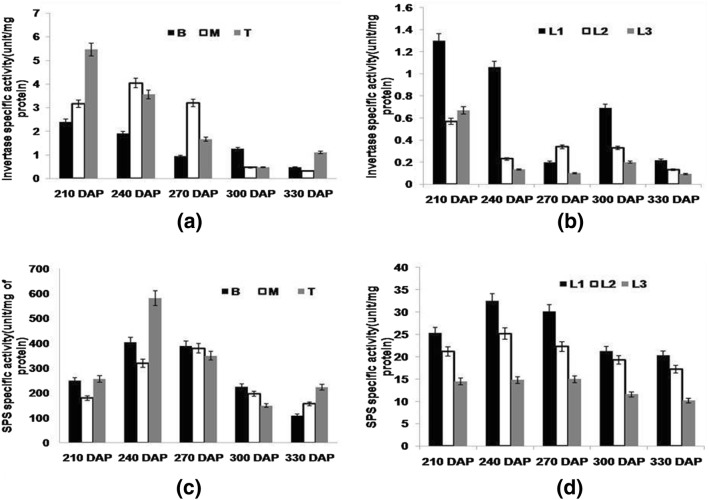
Sucrose content in storage parenchyma of sugarcane stalk has been reported to be mainly regulated by invertase enzyme (Hatch and Glasziou 1963). In the current study, in the grand-growth phase including early maturing period (210–270 DAP) when elongation in cane was still seen, invertase activity was found elevated and was highest in the top immature internodes than those in bottom internodes (Fig. 3a). Invertases cause hydrolysis of sucrose and provide mono-saccharides for cell elongation and there is a greater requirement of this enzyme in the developing cells. As cane begins to accumulate sucrose, invertase activity starts to decline with growth phase, as observed in the present study where a significant negative correlation between sucrose% and invertase activity is observed (Table 3). This correlation was more pronounced in bottom internode (R2= 0.723) than in the middle (R2= 0.545) and top (R2= 0.269) internodes. At active sucrose accumulation phase (300–330 DAP), decline in invertase activity was observed maximum. Moreover, this has started even earlier (210–240 DAP) in the bottom internodes. Talking about reducing sugar, its level was found higher at the initial growth stage concomitant with higher invertase activity (R2= 0.954; Table 3). LaLonde et al. (2003) reported that the sink demand for growth and respiration is fulfilled by the young leaves. In leaf samples at initial stage i.e. at 210 DAP, a higher invertase activity was observed which declined with the growth phase i.e. from 240 to 330 DAP (Fig. 3b). In present study, invertase activity was in correspondence to the reducing sugar content in leaf. Elevated invertase activity was seen in leaves as they were also in their early growth stages and needed higher content of hexoses for their development.
Fig. 3.
Invertase specific activity measured a in bottom (B) middle (M) and top (T) portions b in source leaf (L1), LTM leaf (L2) and sink leaf (L3). c SPS specific activity measured in bottom (B) middle (M) and top (T) portions d in source leaf (L1), LTM leaf (L2) and sink leaf (L3) of CoJ64 at 210, 240, 270, 300 and 330 DAP. Errors bars indicate ± SD from three independent experiments
Activity of sucrose phosphate synthase (SPS) enzyme was observed to be higher during elongation cum early maturing phase i.e. 210–270 DAP and was maximum in immature top internodes (Fig. 3c). With growth, SPS activity improved, but declined with the start of sucrose accumulation in stalk, confirming the involvement of SPS in the synthesis of sucrose. If the changing patterns of the activities of the invertase and SPS enzymes are taken together, the increased activities especially at the early developmental stages helped in enhancing sink strength and sink demand, resulting in increased sucrose content in the stalk. A similar pattern of change in SPS activity was observed in leaf samples (Fig. 3d). A non-significant negative correlation was observed between SPS activity and sucrose% of stalk leading to inference that SPS activity decreases with maturity of cane due to decrease in the sink demand. Results indicated that SPS in the leaf is mainly involved in sucrose biosynthesis whereas in the stalk, it is involved in the re-synthesis of sucrose from the hexoses, which were initially transported during growth phase. Therefore, SPS activity was found higher in the initial growth phases than in final sucrose accumulation phase i.e. 300–330 DAP. Zhu et al. (1997) and Lingle (1999) have reported that SPS and invertase play key role in regulating sucrose accumulation in sugarcane. Stitt et al. (1987) suggested that if loading capacity of phloem decreased, assimilate supply will decline.
End-point PCR analysis of genes associated with sucrose accumulation in high sugar variety
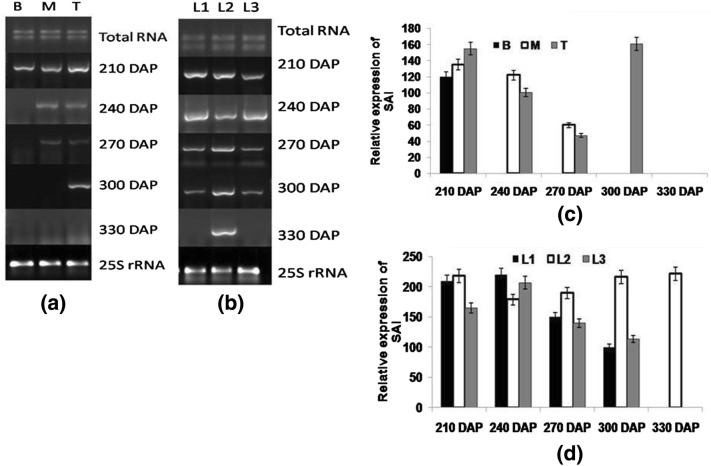
In order to visualize the expression of genes associated with sucrose metabolism, quantitative reverse transcriptase PCR (end point) of SAI, CWI, NI, SuSy and SPS genes was performed in bottom, middle and top internodes (sink tissues) and SAI, CWI, NI, PEP carboxylase and sucrose transporter (SUT1) genes in source tissues encompassing last transverse mark (LTM) source and sink leaves at different growth stages. At early stage (210 DAP), SAI expression was significantly higher and this was more towards top internodes. At later stages, the expression of SAI was not distinct as both increasing and decreasing trend was observed in middle and top internodes. Nevertheless at 300 DAP, a higher level of SAI expression was observed in top internodes possibly preparing the top portion of the cane to gather more sucrose as higher sucrose content was observed at 330 DAP (Fig. 4a, c). In leaf sample at 210 DAP, higher SAI expression was found in source leaf than in LTM and sink leaf. Increased invertase activity was observed at 240 DAP in all three leaves; whereas in source and sink leaf specifically, a gradual suppression was observed with due course of maturity while no definite pattern was observed in LTM leaf (Fig. 4b, d). In general, upregulation of invertase gene causes hydrolysis of sucrose thus raising hexose content and declining sucrose content (Hammond et al. 1984).
Fig. 4.
Semi-quantitative reverse transcriptase PCR (end-point) analysis of SAI a stalk samples viz. bottom (B) middle (M) top (T) b leaf samples viz. source (L1), LTM(L2), sink (L3) in CoJ64 at 210, 240, 270, 300 and 330 DAP. Intensities of amplified bands depicting variations in expression of SAI gene in c stalk and d leaf samples
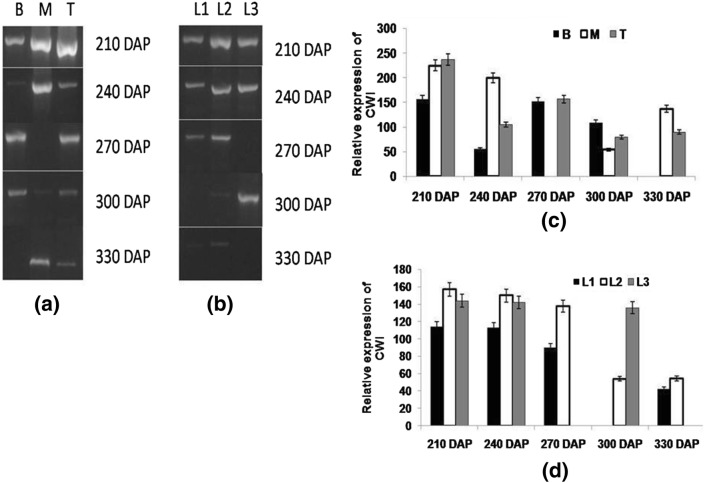
Cell wall invertase plays an important role in phloem loading and assimilate uptake, especially in sink tissues, resulting in steep concentration gradient from source to sink (Verma et al. 2017). In the initial growth phase (210 DAP), higher CWI expression was found which declined with maturity in stalk. At 210 DAP, highest CWI expression was observed in top internodes whereas it was lowest in bottom and this gradient continued at maturity albeit with a decline in level with maturity (Fig. 5a, c). A gradual decrease in the expression of CWI with hexose content with increasing maturity of internodes has been reported in sugarcane (Albertson et al. 2001; McCormick et al. 2008), signifying the importance of gradient generated by CWI. Ruan and Chourey (2006) reported the importance of both SAI and CWI in plant development. In leaf samples, higher CWI expression was observed at early stage of the crop which declined with maturity and was found the lowest at 330 DAP, indicating a better leaf growth and higher photosynthetic rate at the initial stage (Fig. 5b, d). Tang et al. (1999) reported that in carrot (Daucus carota) reduced leaf growth was observed due to suppression of vacuolar acid invertase and cell wall bound invertase.
Fig. 5.
Semi-quantitative reverse transcriptase PCR (end-point) analysis of CWI a stalk samples viz. bottom (B) middle (M) top (T) b leaf samples viz. source (L1), LTM(L2), sink (L3) in CoJ64 at 210, 240, 270, 300 and 330 DAP. Intensities of amplified bands depicting variations in expression of CWI gene in c stalk and d leaf samples
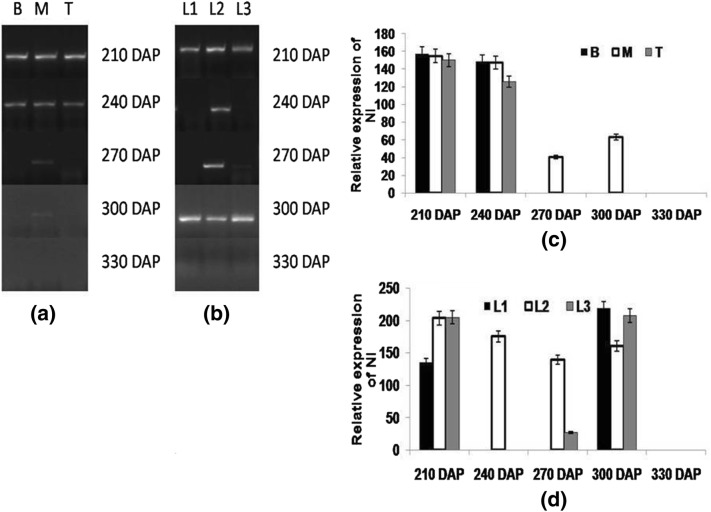
Though physiological role of neutral invertase is still inconclusive, its expression was highest at 210 DAP in both source and sink tissues which declined at 240 and 270 DAP and at 300 and 330 DAP, negligible expression was visualized in both stalk and leaf samples (Fig. 6). Bosch et al.(2004) reported higher NI transcripts and protein in young sugarcane tissues that have low sucrose level, suggesting its involvement in providing hexoses to the young tissues. However, Sturm (1999) reported steady-state expression of NI genes. All three invertases (SAI, CWI and NI) hydrolyzes sucrose and provide hexoses for carrying out the metabolic function, resulting in increased sink strength, which in turn helped in sugar signaling that play supportive role in the sucrose accumulation in spatial and temporal manner (Nonis et al. 2007; Chandra et al. 2015; Verma et al. 2017).
Fig. 6.
Semi-quantitative reverse transcriptase PCR (end-point) analysis of NI a stalk samples viz. bottom (B) middle (M) top (T) b leaf samples viz. source (L1), LTM(L2), sink (L3) in CoJ64 at 210, 240, 270, 300 and 330 DAP. Intensities of amplified bands depicting variations in expression of NI gene in c stalk and d leaf samples
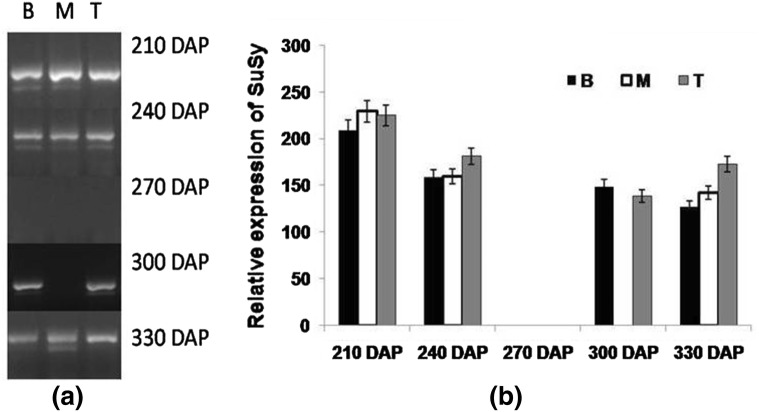
Sucrose synthase (SuSy) and neutral invertase (NI) are the two important enzymes that play key role in degradation of the sucrose in cytosol. In-vivo sucrose synthase catalyses reversible reaction, that causes sucrose cleavage in those sink tissue which are supplied with ample amount of sucrose and with high demand from respiratory and carbon biosynthetic pathways (Geigenberger and Stitt 1993). Expression study as performed at different growth intervals in the stalk tissue indicated a very high and significant expression of SuSy at 210 DAP which gradually declined at 240 DAP and became negligible at 270 DAP. At the verge of maturity and sucrose accumulation (300 DAP), its expression was visualized in bottom and top internodes, whereas at 330 DAP, expression was observed in the whole cane (Fig. 7). Our results were in accordance to the results reported by Gutierrez-Miceli et al. (2002), wherein high expression of SuSy was found associated with sucrose content. Barratt et al. (2001) reported that developmental and environmental factors including plant sugar status regulated the expression of SuSy gene.
Fig. 7.
Semi-quantitative reverse transcriptase PCR (end-point) analysis of SuSy a stalk samples viz. bottom (B) middle (M) top (T) in CoJ64 at 210, 240, 270, 300 and 330 DAP. b Intensities of amplified bands depicting variations in expression of SuSy gene
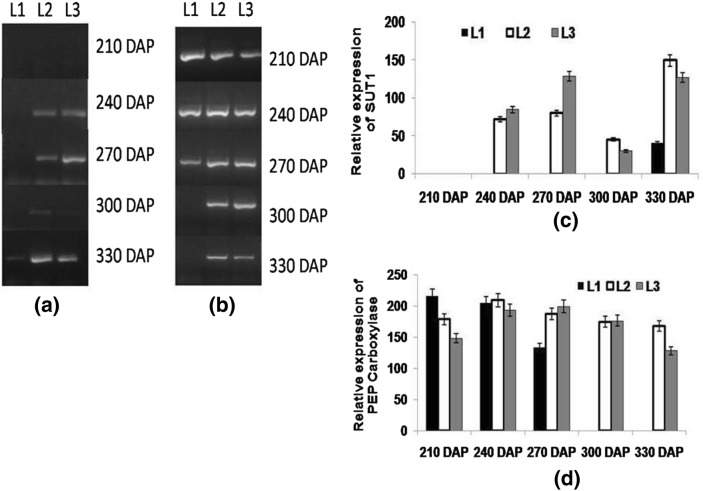
Expression of PEP carboxylase and sugar transporter gene was analyzed in all three sets of leaf samples (source, LTM and sink) collected at different DAPs. Expression of PEPC was found higher at 210 DAP in all leaves and among these, highest expression was seen in the source leaf followed by LTM and sink leaf. In source leaf, expression declined at 240 and 270 DAP while in LTM and sink leaf, it increased with maturity. At 300 and 330 DAP, negligible transcripts were detected in source while at 300 DAP, higher expression was seen in the sink leaf, at 330 DAP, a lower expression was observed in LTM and sink leaf (Fig. 8b). Phosphoenol pyruvate carboxylase play important function in the initial steps of carbon fixation in C4 plants and its expression changes with temperature and in stress condition (Lian et al. 2014). Increased expression of photosynthetic genes result in increased photosynthetic activity leading to increased photoassimilate supply to the stalk tissues to fulfill its demand for the same (McCormick et al. 2008). The present results indicated differential expression of PEPC, however higher expression supported increased supply of photoassimilates. Expression of sucrose transporter (ShSUT1) gene was negligible at early stage of the crop (210 DAP) but at 330 DAP, a higher expression of the gene was observed in LTM and sink leaves (Fig. 8a). Rae et al. (2005) reported predominant expression of SUT1 in mature leaves involved in exporting sucrose.
Fig. 8.
Semi-quantitative reverse transcriptase PCR (end-point) analysis of a SUT1 and b PEP carboxylase in different leaf samples viz. source (L1), LTM(L2), sink (L3) in CoJ64 at 210, 240, 270, 300 and 330 DAP. Intensities of amplified bands depicting variations in expression c SUT1 and d PEP carboxylase
Real time PCR analysis of genes associated with sucrose accumulation in high sugar variety at early and late stage of growth
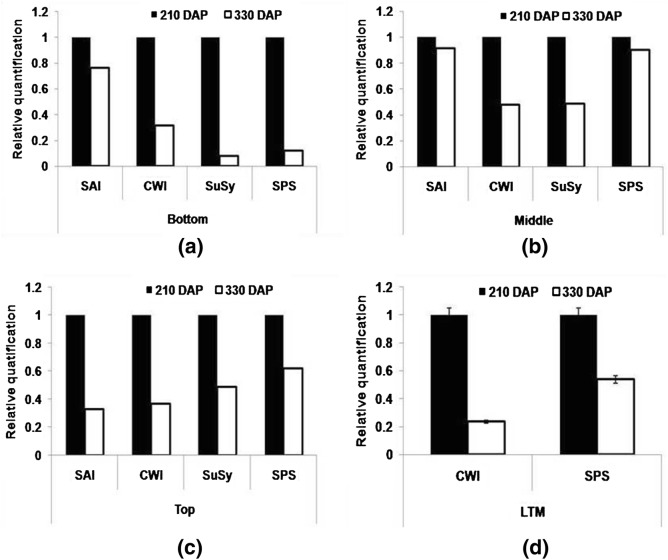
To visualize the expression of genes on real time basis, expression analysis of selected genes namely SAI, CWI, SuSy and SPS in sink tissues and CWI and SPS in LTM leaf was carried out at early (210 DAP) and later stages (330 DAP). Differential expression through real time PCR was estimated in terms of RQ value (RQ = Relative quantification). Decreased expression of these genes was visualized in all internodes at 330 DAP (Table 4). Expression of CWI and SPS declined in leaf samples (Fig. 9). Pattern of expression of genes as visualized through real time PCR analysis were similar to those observed with end point PCR. Expression of invertase was high in sink tissues at an early stage, favouring a decreased sucrose concentration in the sink tissue. An increased sink capacity directed more accumulation of sucrose. Higher invertase and SPS activity in the initial phase of the crop helped in increasing sink potential for enhanced sucrose accumulation. In leaf sample, higher CWI and SPS expression was found at 210 DAP that helped in the growth and development of the source and regulating the storage of the photoassimilates in sink tissues (Fig. 9d). Our earlier reports indicated a decreased expression of invertase at maturity and this was earlier in early maturing variety than in late maturing (Chandra et al. 2015). Results support the hypothesis that expression of invertase has to decline with maturity of the crop, but should be high at early stage to facilitate strengthening sink tissues.
Table 4.
Fold difference in level of gene expression from 210 to 330 DAP in bottom, middle, top internodes and LTM leaf tissues of CoJ 64
| Genes | Bottom internodes | Middle internodes | Top internodes | LTM leaf |
|---|---|---|---|---|
| Soluble acid invertase (SAI) | − 0.76 | − 0.91 | − 0.33 | – |
| Cell wall invertase (CWI) | − 0.31 | − 0.48 | − 0.37 | − 0.23 |
| Sucrose synthase (SuSy) | − 0.08 | − 0.49 | − 0.49 | – |
| Sucrose phosphate synthase (SPS) | − 0.12 | − 0.90 | − 0.62 | − 0.52 |
− down expression of genes. Based on RQ values obtained from real-time PCR data
Fig. 9.
Real time PCR (qRT-PCR) analysis of different sucrose metabolizing genes (SAI, CWI, SuSy, SPS) in a bottom b middle c top internodes and d LTM leaf of CoJ64 at 210 DAP and 330 DAP
Source–sink dynamics and expression patterns of associated gene(s)
As stated above, source tissues act as sucrose supplier to meet the sink demand. Sugarcane being C4 plant, carbon fixation is catalyzed by PEP carboxylase and SPS acts as key enzyme for sucrose synthesis in source. In the present pursuit, the elevated expressions of PEP carboxylase and SPS at 210 DAP as well as sucrose content as observed in source tissues, presumably happened in response to the increased sink demand as exhibited by higher invertase and SPS activity. However in sink tissues at 210 DAP, lower sucrose content was seen compared to later stages, as sink tissues were still in elongation phase (depicted by higher invertase activity) and still have not attained enough strength to store reasonably higher sucrose. Based on gene expression analysis, Tejera et al. (2007) reported that sink growth activity affects the sucrose yield. Later, at 240 and 270 DAP, a gradual decline in the sucrose content and increase in expression of SPS and PEP carboxylase was observed in source tissues and at the same time in sink tissues, gradual increase in SPS and sucrose content with steady decline in invertase activity was observed indicating influence of gene expression on sucrose content. These results propose that sink signals to source to supply sucrose to fulfill its need for gradual attainment of strength for storing substantial amount of sucrose in it. Contrary to this, at 300 and 330 DAP, source tissue depicted decrease in expression of SPS and PEP caboxylase and increase in sucrose content. In sink tissue, marked increase in sucrose content along with decline in SPS and invertase activity as noticed further suggested existence of source–sink relationship in sugarcane. This increase in sucrose content in the source tissues was due to decreased sink demand, as sink attains saturated concentration of sucrose and sends feedback signal to the source, resulting in decline in the expression of SPS and other photosynthetic gene as suggested by Paul and Foyer (2001) wherein net photosynthetic rate and carbon status of source organ is largely influenced by the sink carbon demand.
Conclusion
Sucrose accumulation in sugarcane is an intricate and complex process depending on the photosynthetic competency of source (leaf) and strength of the sink (culm/stalk) tissues. Leaf efficiency to ‘supply’ photoassimilate and sink ‘demand’ is mutually inter-dependent and guide sucrose storage in the sink. Differential expression especially over-expression of SAI and SPS genes at early stage of the growth helped in strengthening sink and thereafter reduced expression directed increased sucrose content in stalk. To keep the supply on, multisite modulation of the gene/s involved in the signaling pathway between source and sink is needed. Present results demonstrated that invertase and SPS are the main enzyme that regulate sink strength and also affects the sucrose content in the leaves that further regulate the photosynthetic efficiency (depicted by the expression study of PEP carboxylase) of leaves. Thus sucrose acts as a signal molecule in source–sink communication pathway that regulate its own synthesis. The present study provides a platform for advance research to build transgenic strategies to increase culm sucrose content and crop yield in sugarcane. Identifying and characterizing the genes that are involved in this signaling pathway and how these genes regulates source–sink dynamics has become a key focus of plant molecular and physiological research.
Acknowledgements
Authors are thankful to ICAR-Indian Institute of Sugarcane Research, Lucknow and Integral University, Lucknow for providing necessary facilities and guidance to carry out this work. IV thankful to Integral University for providing manuscript ID (IU/R&D/2018-MCN000393). Authors are thankful to the anonymous reviewer for critical review and improvement.
Compliance with ethical standards
Conflict of interest
All the authors declare that they have no conflicts of interest.
References
- Albertson PL, Peters KF, Grof CPL. An improved method for the measurement of cell wall invertase activity in sugarcane tissue. Funct Plant Biol. 2001;28:323–328. doi: 10.1071/PP00037. [DOI] [Google Scholar]
- Ap Rees T. Compartmentation of plant metabolism. In: Davies DD, editor. The biochemistry of plants. 12. San Diego: Academic Press; 1987. pp. 87–115. [Google Scholar]
- Barratt DHP, Barber L, Kruger NJ, Smith AM, Wang TL, Martin C. Multiple distinct isoforms of sucrose synthase in pea. Plant Physiol. 2001;127:655–664. doi: 10.1104/pp.010297. [DOI] [PMC free article] [PubMed] [Google Scholar]
- Berding N. Clonal improvement of sugarcane based on selection for moisture content: fact or fiction. Proc Aust Soc Sugarcane Technol. 1997;19:245–253. [Google Scholar]
- Bosch S, Grof CPL, Botha FC. Expression of neutral invertase in sugarcane. Plant Sci. 2004;166:1125–1133. doi: 10.1016/j.plantsci.2003.09.020. [DOI] [Google Scholar]
- Buczynski SR, Thom M, Chourey P, Maretzki A. Tissue distribution and characterization of sucrose synthase isozymes in sugarcane. J Plant Physiol. 1993;142:641–646. doi: 10.1016/S0176-1617(11)80895-3. [DOI] [Google Scholar]
- Bull TA, Glasziou KT. The evolutionary significance of sugar accumulation in Saccharum. Aust J Biol Sci. 1963;16:737–742. doi: 10.1071/BI9630737. [DOI] [Google Scholar]
- Chandra A. Physio-biochemical and molecular approaches to enhance sucrose content in sugarcane: Indian initiatives. Sugar Tech. 2011;13:315–321. doi: 10.1007/s12355-011-0100-6. [DOI] [Google Scholar]
- Chandra A, Jain R, Rai RK, Solomon S. Revisiting the source–sink paradigm in sugarcane. Curr Sci. 2011;100:978–980. [Google Scholar]
- Chandra A, Jain R, Solomon S. Complexities of invertases controlling sucrose accumulation and retention in sugarcane: the way forward. Curr Sci. 2012;102:857–866. [Google Scholar]
- Chandra A, Verma PK, Islam MN, Grisham MP, Jain R, Sharma A, Roopendra K, Singh K, Singh P, Verma I, Solomon S. Expression analysis of genes associated with sucrose accumulation in sugarcane (Saccharum spp. hybrids) varieties differing in content and time of peak sucrose storage. Plant Biol. 2015;17:608–617. doi: 10.1111/plb.12276. [DOI] [PubMed] [Google Scholar]
- Franck N, Vaast P, Ge´nard M, Dauzat J. Soluble sugars mediate sink feedback down-regulation of leaf photosynthesis in field-grown Coffea arabica. Tree Physiol. 2006;26:517–525. doi: 10.1093/treephys/26.4.517. [DOI] [PubMed] [Google Scholar]
- Gayler KR, Glasziou KT. Storage of sugars in stalks of sugarcane. Bot Rev. 1972;38:471–490. doi: 10.1007/BF02859248. [DOI] [Google Scholar]
- Geigenberger P, Stitt M. Sucrose synthase catalyzes a rapidly reversible reaction in vivo in developing potato tubers and other plant tissues. Planta. 1993;189:329–339. doi: 10.1007/BF00194429. [DOI] [PubMed] [Google Scholar]
- Grof CPL, Campbell JA. Sugarcane sucrose metabolism: scope for molecular manipulation. Aust J Plant Physiol. 2001;28:1–12. [Google Scholar]
- Grof CPL, Albertson PL, Bursle J, Perroux JM, Bonnett GD, Manners JM. Sucrose –Phosphate Synthase, a biochemical marker of high sucrose accumulation in Sugarcane. Crop Sci. 2007;47:1530–1539. doi: 10.2135/cropsci2006.12.0825. [DOI] [Google Scholar]
- Gutierrez-Miceli FA, Rodriguez-Mendiola MA, Ochoa-Alejo N, Mendez-Salas R, Dendooven L, Arias-Castro C. Relationship between sucrose accumulation and activities of sucrose-phosphatase, sucrose synthase, neutral invertase and soluble acid invertase in micropropagated sugarcane plants. Acta Physiol Plant. 2002;24:441–446. doi: 10.1007/s11738-002-0041-5. [DOI] [Google Scholar]
- Hammond JBW, Burton KS, Shaw AF, Ho LC. Source—sink relationships and carbon metabolism in tomato leaves 2. carbohydrate pools and catabolic enzymes. Ann Bot. 1984;53:307–314. doi: 10.1093/oxfordjournals.aob.a086694. [DOI] [Google Scholar]
- Hatch MD, Glasziou KT. Sugar accumulation cycle in sugarcane. II. Relationship of invertase activity to sugar content and growth rate in storage tissue of plants growth in controlled environments. Plant Physiol. 1963;38:344–348. doi: 10.1104/pp.38.3.344. [DOI] [PMC free article] [PubMed] [Google Scholar]
- Hibberd JM, Covshoff S. The regulation of gene expression required for C4 photosynthesis. Annu Rev Plant Biol. 2010;61:181–207. doi: 10.1146/annurev-arplant-042809-112238. [DOI] [PubMed] [Google Scholar]
- Hubbard NI, Huber SC, Pharr DM. Sucrose phosphate synthase and acid invertase as determinants of sucrose concentration in developing muskmelon (Cucumis melo L.) fruits. Plant Physiol. 1989;91:1527–1534. doi: 10.1104/pp.91.4.1527. [DOI] [PMC free article] [PubMed] [Google Scholar]
- Inman-Bamber NG, Bonnett GD, Spillman MF, Hewitt ML, Jackson J. Increasing sucrose accumulation in sugarcane by manipulating leaf extension and photosynthesis with irrigation. Aust J Agric Res. 2008;59:13–26. doi: 10.1071/AR07167. [DOI] [Google Scholar]
- Iskandar HM, Simpson RS, Casu RE, Bonnett GD, Maclean DJ, Manners JM. Comparison of reference genes for quantitative real-time polymerase chain reaction analysis of gene expression in sugarcane. Plant Mol Biol Rep. 2004;22:325–337. doi: 10.1007/BF02772676. [DOI] [Google Scholar]
- Jackson PA. Breeding for improved sugar content in sugarcane. Field Crops Res. 2005;92:277–290. doi: 10.1016/j.fcr.2005.01.024. [DOI] [Google Scholar]
- Jacobsen KR, Fisher DG, Maretzki A, Moore PH. Developmental changes in the anatomy of the sugarcane stem in relation to phloem unloading and sucrose storage. Plant Biol. 1992;105:70–80. [Google Scholar]
- Jeschke WD, Hilpert A. Sink-stimulated photosynthesis and sink-dependent increase in nitrate uptake: nitrogen and carbon relations of the parasitic association Cuscutareflexa-Ricinus communis. Plant, Cell Environ. 1997;20:47–56. doi: 10.1046/j.1365-3040.1997.d01-2.x. [DOI] [Google Scholar]
- Lalonde S, Tegeder M, Throne-Holst M, Frommer WB, Patrick JW. Phloem loading and unloading of sugars and amino acids. Plant, Cell Environ. 2003;26:37–56. doi: 10.1046/j.1365-3040.2003.00847.x. [DOI] [Google Scholar]
- Lemoine R, La Camera S, Atanassova R, Dédaldéchamp F, Allario T, Pourtau N, Bonnemain JL, Laloi M, Coutos-Thévenot P, Maurousset L, Faucher M. Source-to-sink transport of sugar and regulation by environmental factors. Front Plant Sci. 2013;4:1–21. doi: 10.3389/fpls.2013.00272. [DOI] [PMC free article] [PubMed] [Google Scholar]
- Lian L, Wang X, Zhu Y, He W, Cai Q, Xie H, Zhang M, Zhang J. Physiological and photosynthetic characteristics of indica Hang2 expressing the sugarcane PEPC gene. Mol Biol Rep. 2014;41:2189–2197. doi: 10.1007/s11033-014-3070-4. [DOI] [PMC free article] [PubMed] [Google Scholar]
- Lingle SE. Sugar metabolism during growth and development in sugarcane internodes. Crop Sci. 1999;39:480–486. doi: 10.2135/cropsci1999.0011183X0039000200030x. [DOI] [Google Scholar]
- Lingle SE, Smith RC. Sucrose metabolism related to growth and ripening in sugarcane internodes. Crop Sci. 1991;31:172–177. doi: 10.2135/cropsci1991.0011183X003100010039x. [DOI] [Google Scholar]
- Lowry OH, Rosebrough NJ, Farr AL, Randall RJ. Protein measurement with the Folin phenol reagent. J Biol Chem. 1951;193:265–275. [PubMed] [Google Scholar]
- Marcelis LFM. Sink strength as a determinant of dry matter partitioning in the whole plant. J Exp Bot. 1996;47:1281–1291. doi: 10.1093/jxb/47.Special_Issue.1281. [DOI] [PubMed] [Google Scholar]
- McCormick AJ, Cramer MD, Watt DA. Sink strength regulates photosynthesis in sugarcane. New Phytol. 2006;171:759–770. doi: 10.1111/j.1469-8137.2006.01785.x. [DOI] [PubMed] [Google Scholar]
- McCormick AJ, Cramer MD, Watt DA. Culm sucrose accumulation promotes physiological decline of mature leaves in ripening sugarcane. Fields Crops Res. 2008;108:250–258. doi: 10.1016/j.fcr.2008.06.004. [DOI] [Google Scholar]
- McCormick AJ, Watt DA, Cramer MD. Supply and demand: sink regulation of sugar accumulation in sugarcane. J Exp Bot. 2009;60:357–364. doi: 10.1093/jxb/ern310. [DOI] [PubMed] [Google Scholar]
- Moore PH. Temporal and spatial regulation of sucrose accumulation in the sugarcane stem. Aust J Plant Physiol. 1995;22:661–679. [Google Scholar]
- Moore PH, Botha FC, Furbank RT. Potential for overcoming physio-biochemical limits to sucrose accumulation. In: Keating BA, Wilson JR, editors. Intensive Sugarcane Production: Meeting the Challenges Beyond 2000. UK: CAB International, Wallinford; 1997. [Google Scholar]
- Nelson N. A photometric adaptation of Somogyi method for the determination of glucose. J Biol Chem. 1944;153:375–380. [Google Scholar]
- Nonis A, Ruperti B, Falchi R, Casatta E, Thamasebi Enferadi S, Vizzotto G. Differential expression and regulation of a neutral invertase encoding gene from peach (Prunus persica): evidence for a role in fruit development. Physiol Plant. 2007;129:436–446. doi: 10.1111/j.1399-3054.2006.00832.x. [DOI] [Google Scholar]
- Paul MJ, Foyer CH. Sink regulation of photosynthesis. J Exp Bot. 2001;52:1381–1400. doi: 10.1093/jexbot/52.360.1383. [DOI] [PubMed] [Google Scholar]
- Rae AL, Perroux JM, Grof CPL. Sucrose partitioning between vascular bundles and storage parenchyma in the sugarcane stem: a potential role for the ShSUT1 sucrose transporter. Planta. 2005;220:817–825. doi: 10.1007/s00425-004-1399-y. [DOI] [PubMed] [Google Scholar]
- Roitsch T, Bittne M, Godt DE. Induction of apoplastic invertase of Chenopodium rubrum by d-glucose and a glucose analog and tissue-specific expression suggest a role in sink-source regulation. Plant Physiol. 1995;108:285–294. doi: 10.1104/pp.108.1.285. [DOI] [PMC free article] [PubMed] [Google Scholar]
- Roitsch T, Balibrea ME, Hofmann M, Proels R, Singh AK. Extracellular invertase: key metabolic enzyme and PR protein. J Exp Bot. 2003;54:513–524. doi: 10.1093/jxb/erg050. [DOI] [PubMed] [Google Scholar]
- Ruan YL, Chourey PS. Carbon partitioning in developing seed. In: Basra AS, editor. Seed sciences and technology: trends and advances. New York: The Haworth Press; 2006. pp. 125–152. [Google Scholar]
- Stitt M, Gerhardt R, Wilke I, Heldt HW. The contribution of fructose 2, 6-bisphosphate to the regulation of sucrose synthesis during photosynthesis. Physiol Plant. 1987;69:377–386. doi: 10.1111/j.1399-3054.1987.tb04304.x. [DOI] [Google Scholar]
- Sturm A. Invertases. Primary structures, functions, and roles in plant development and sucrose partitioning. Plant Physiol. 1999;121:1–8. doi: 10.1104/pp.121.1.1. [DOI] [PMC free article] [PubMed] [Google Scholar]
- Tang GQ, Lüscher M, Sturm A. Antisense repression of vacuolar and cell wall invertase in transgenic carrot alters early plant development and sucrose partitioning. Plant Cell. 1999;11:177–189. doi: 10.1105/tpc.11.2.177. [DOI] [PMC free article] [PubMed] [Google Scholar]
- Tejera NA, Rodés R, Ortega E, Campos R, Lluch C. Comparative analysis of physiological characteristics and yield components in sugarcane cultivars. Field Crops Resh. 2007;102:64–72. doi: 10.1016/j.fcr.2007.02.002. [DOI] [Google Scholar]
- Van Handel E. Direct micro determination of sucrose. Anal Biochem. 1968;22:280–283. doi: 10.1016/0003-2697(68)90317-5. [DOI] [PubMed] [Google Scholar]
- Verma I, Roopendra K, Sharma A, Jain R, Singh RK, Chandra A. Expression analysis of genes associated with sucrose accumulation in sugarcane under normal and GA3-induced source–sink perturbed conditions. Acta Physiol Planta. 2017;39:133. doi: 10.1007/s11738-017-2433-6. [DOI] [Google Scholar]
- Watt DA, McCormick AJ, Govender C, Carson DL, Cramer MD, Huckett BI, Botha FC. Increasing the utility of genomics in unraveling sucrose accumulation. Field Crops Res. 2005;92:149–158. doi: 10.1016/j.fcr.2005.01.012. [DOI] [Google Scholar]
- Welbaum GE, Meinzer FC, Grayson RL, Thornham KT. Evidence for the consequences of a barrier to solute diffusion between the apoplast and vascular bundles in sugarcane stalk tissue. Funct Plant Biol. 1992;19:611–623. doi: 10.1071/PP9920611. [DOI] [Google Scholar]
- Zhu YJ, Albert HH, Moore PH. Sucrose accumulation in the sugarcane stem is regulated by the difference between the activities of soluble acid invertase and sucrose phosphate synthase. Plant Physiol. 1997;115:609–616. doi: 10.1104/pp.115.2.609. [DOI] [PMC free article] [PubMed] [Google Scholar]


