

Abstract
A systems-level view of cellular gene expression requires understanding the mechanistic principles governing each step of transcription. In this chapter, we describe a massively-multiplexed method for the analysis of the relationship between nucleic-acid sequence and transcription termed “MASTER,” for massively systematic transcript end readout. MASTER enables parallel measurements of transcription output from at least 410 (~1,000,000) individual template sequences in vitro and in vivo. MASTER involves constructing a DNA template library of barcoded sequences, generating RNA transcripts from the library during transcription in vitro or in vivo, and analyzing the relative abundance and 5'-end sequences of the RNA transcripts by high-throughput sequencing. MASTER provides a powerful, rapid, and versatile method to identify sequence determinants of each step of transcription and to define the mechanistic basis by which these sequence determinants dictate transcription output.
Keywords: transcription, RNA polymerase, promoter, high-throughput sequencing, transcription start site selection, transcription initiation, non-canonical initiating nucleotide, NCIN, RNA-seq, RNA capping
1. INTRODUCTION
1.1. Development of “massively systematic transcript end readout,” MASTER
Proper control of gene expression is essential for organismal development, cellular response to environmental signals, and the prevention of disease. Transcription is the first step in gene expression and is a primary target of regulation. Transcription in all cells is carried out by members of a family of multisubunit RNA polymerases (RNAPs) that are highly conserved in sequence, structure, and function across all organisms (Cramer, 2002; Darst, 2001; Ebright, 2000).
During each phase of transcription, RNAP makes extensive interactions with nucleic acids and is responsive to sequence context. Thus, understanding how cells ensure proper control of gene expression requires knowledge of RNAP activity in all sequence contexts for each phase of transcription. To achieve this goal, we have developed a method termed “MASTER,” for massively systematic transcript end readout (Vvedenskaya, Zhang, Goldman, Valenti, Visone, Taylor et al., 2015). MASTER enables the parallel analysis of transcription output from up to at least 410 (~1 million) template sequence variants in vitro and in vivo.
1.2. Application of MASTER to bacterial transcription
Bacterial RNAP is the smallest and best-characterized member of the multisubunit RNAP family (Cramer, 2002; Darst, 2001; Ebright, 2000). Thus, bacterial RNAP provides an excellent model system for defining mechanistic principles that are relevant to the function of all multisubunit RNAPs. The focus of this chapter is on the application of MASTER for studies of transcription initiation by bacterial RNAP. In particular, we describe methods suitable for analysis of the effects of promoter sequence on transcription output by Escherichia coli RNAP. These procedures can also be adapted for studies of post-initiation steps of transcription.
The bacterial RNAP core enzyme (subunit composition α2ββ’ω) can carry out non-specific transcription initiation and transcription elongation but must associate with a σ factor, forming the RNAP holoenzyme (subunit composition α2ββ’ω σ), to carry out promoter-specific transcription (Marchetti, Malinowska, Heller, & Wuite, 2017; Ruff, Record, & Artsimovitch, 2015). σ contains determinants for sequence-specific recognition of promoter DNA and, through those determinants, targets RNAP to promoters (Feklistov, Sharon, Darst, & Gross, 2014; Paget, 2015). During promoter-specific transcription initiation the RNAP holoenzyme binds promoter DNA, unwinds ~12–16 bp of promoter DNA to form an RNAP-promoter open complex containing an unwound “transcription bubble,” and selects a transcription start site (Marchetti et al., 2017; Ruff et al., 2015). RNAP remains bound to the promoter and uses a “scrunching” mechanism during the synthesis of the first ~10 nt of the transcript (Kapanidis, Margeat, Ho, Kortkhonjia, Weiss & Ebright, 2006; Revyakin, Liu, Ebright, & Strick, 2006). During this phase of transcription, termed “initial transcription,” the RNAP-promoter-initial-transcribing complex can engage in tens or hundreds of abortive cycles of synthesis and release of short RNA products. This process, termed “abortive initiation,” competes with, and limits, productive initiation. During initial transcription the RNAP-promoter-initial-transcribing complex can also enter into a paused state without releasing the RNA (Duchi, Bauer, Fernandez, Evans, Robb, Hwang et al., 2016; Lerner, Chung, Allen, Wang, Lee, Lu et al., 2016). This process, termed “initiation pausing,” can also limit productive initiation, and has been proposed to provide a regulatory checkpoint. Once the RNAP-promoter-initial-transcribing complex has synthesized a product of a threshold length of ~10 nt, RNAP breaks its interactions with promoter DNA, breaks some of its interactions with σ, and enters into the elongation phase of transcription. This last step of transcription initiation is termed “promoter escape.”
Each step of transcription initiation, from promoter binding to promoter escape, can be affected by multiple sequence determinants. Because each sequence determinant for each step of transcription initiation is only one of several determinants of transcription output, their quantitative significance for different promoters differs. In addition, each step of transcription initiation can be affected by reaction conditions. Thus, predicting transcription output for given promoter sequence under different reaction conditions represents an immense challenge. To address this challenge, we have developed and applied MASTER to measure transcription output for up to at least 410 (~1,000,000) individual promoter sequences in vitro and in vivo (Hochschild, 2015; Vvedenskaya et al., 2015; Winkelman, Vvedenskaya, Zhang, Zhang, Bird, Taylor et al., 2016).
Use of MASTER for studies of transcription initiation involves the construction of a promoter template library containing up to 410 (~1,000,000) barcoded sequences, production of RNA transcripts from the template library in vitro and in vivo, and analysis of transcript 5' ends and transcript yields (Figure 1). The sections that follow provide a detailed protocol for each of these steps.
Figure 1. Massively systematic transcript end readout, MASTER.
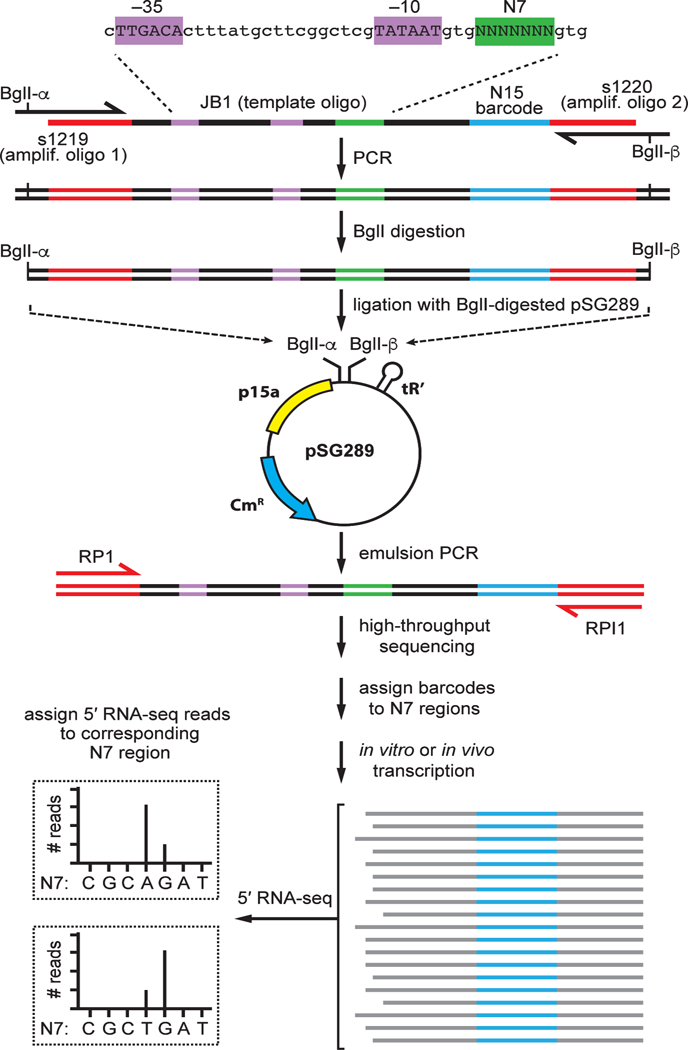
Top: steps in the construction of a representative MASTER template library. A representative template oligo (JB1; Table 1) carrying the lacCONS-N7 promoter, a 7-nt randomized region at positions 4–10 bps downstream of the lacCONS promoter −10 element (green), and a 15-nt barcode sequence (blue) is used as template in a PCR reaction using amplification primers (s1219 and s1220, see Table 1) that introduce BglI sites. The PCR product is digested with BglI and cloned into BglI-digested pSG289 to generate a MASTER template library that contains 47 (~16,000) sequence variants at positions 4–10 bps downstream of the lacCONS −10 element. Middle: product generated by ePCR is sequenced to assign barcodes to template-sequence variants. The PCR primers shown in red (RP1 and RPI1; Table 1) carry sequences required for analysis by the Illumina sequencer. Bottom: 5′ RNA-seq analysis of RNA produced from the library in vitro and in vivo. The sequence of the barcode is used to assign the RNA to template-sequence variant, the sequence of the 5′ end is used to define the transcription start site, and the number of reads is used to measure transcript yield from each template-sequence variant.
2. CONSTRUCTION OF MASTER TEMPLATE LIBRARY
2.1. Overview
To generate a MASTER template library, we use a procedure that provides a “self-assembling barcode,” in which for each DNA molecule in the library a first randomized sequence in a region of interest is associated with a known corresponding second randomized sequence that serves as a barcode. To do this, we first synthesize three oligodeoxyribonucleotides (oligos) for use in PCR. One of these oligos, termed the ‘template’ oligo, contains a first randomized sequence spanning the region of interest and a second, longer randomized sequence that serves as a barcode. The other two oligos, termed the ‘amplification’ oligos, carry ~20 nt of 3’-end sequence complementary to the template oligo along with 5'-end sequence that introduces a BglI recognition sequence that is used to clone the PCR product into a plasmid vector.
The double-stranded DNA (dsDNA) generated by PCR is digested, and the digested product is isolated and inserted into a vector backbone by ligation (Figure 1, top). The ligation mixture is transformed into cells, and recombinant plasmid DNA is isolated from ~106–107 transformants. This plasmid DNA is a MASTER template library that is negatively supercoiled. In the construction of the library, the barcodes have “self-assembled” such that for each DNA molecule in the library, the first randomized sequence in the region of interest is associated with a corresponding second randomized sequence in the barcode region.
The composition of the MASTER template library is determined through high-throughput sequencing analysis of a dsDNA product generated by emulsion PCR (ePCR) that spans the insert-containing region of the plasmid (Figure 1, middle). The sequencing results enable us to identify each unique template sequence in the library, and thereby to associate each randomized sequence in the region of interest with its corresponding randomized sequence that serves as its barcode. The sequencing results also provide a measure of the proportion of each DNA template sequence variant in the library. Use of ePCR instead of conventional PCR minimizes ‘template switching’ during DNA synthesis that could result in the generation of amplicons in which barcodes have been switched. The dsDNA product generated by ePCR also is a non-supercoiled, linear form of the MASTER template library suitable for use in experiments measuring transcription output in vitro.
Our goal is to obtain barcoded template libraries in which >95% of the theoretical maximum number of potential sequence variants in the region of interest are present and in which >95% of the barcodes are associated with a single sequence variant in the region of interest. Two steps of the procedure are designed to achieve this goal. First, the template oligo is designed so that the complexity of the randomized barcode region (typically 415; ~1 billion) is much larger than the complexity of the randomized region of interest (typically 47–410; ~16,000–1,000,000). Second, the procedure involves the transformation of a ligation mixture into bacterial cells. This step enables us to restrict the number of barcodes in the library to the total number of transformants obtained in this step. Consider the example of a library prepared from 2 million transformants where the complexity of the randomized region of interest is 47 (~16,000) and the complexity of the randomized barcode region is 415 (~1,000,000,000). Assuming each sequence variant and each barcode has an equal chance of being represented in the final library we expect each sequence variant to be present ~120 times. Conversely, the likelihood that any of the barcodes will be represented more than once in a library of 2 million is ~0.002.
2.2. Amplification of template oligo by PCR
2.2.1. Equipment
Low-binding P10-P1000 barrier tips, sterile
Low-binding 1.7 ml microtubes, nuclease-free
Horizontal electrophoresis apparatus
Single-channel pipettes for 2–1,000 μl
Stainless steel disposable scalpels, No. 10 blade
Table top centrifuge
Thermal cycler
Thin wall 200 μl PCR tubes
UV transilluminator, GelDoc
2.2.2. Reagents
6x DNA loading dye (30% glycerol (v/v), 0.25% bromophenol blue (w/v), 0.25% xylene cyanol FF (w/v))
Ethidium bromide, 10 mg/ml
LE Quick Dissolve agarose
Nuclease-free water, not DEPC-treated
Oligodeoxyribonucleotides (IDT, see Table 1; we recommend that synthesis of the ‘template’ oligo is performed using “hand mixed” custom base solutions to ensure this solution is prepared with precisely specified dNTP ratios)
Q5 High-Fidelity 2x Master Mix (NEB)
QIAQuick Gel Extraction Kit (Qiagen)
TAE buffer (40 mM Tris, 20 mM acetic acid, 1 mM EDTA)
Table 1.
Oligonucleotides used in MASTER
| Name | Sequence (5' to 3') | Description |
|---|---|---|
| s1206 | GUUCAGAGUUCUACAGUCCGACGAUCNNNNNNNNNNNNNNN | Standard 5′ adapter (HPLC purified) |
| i105 | GUUCAGAGUUCUACAGUCCGACGAUCCUGANNNNNNNNNNN | Barcoded 5′ adapter 1; CUGA barcode is underlined (HPLC purified) |
| i106 | GUUCAGAGUUCUACAGUCCGACGAUCGACUNNNNNNNNNNN | Barcoded 5′ adapter 2; GACU barcode is underlined (HPLC purified) |
| i107 | GUUCAGAGUUCUACAGUCCGACGAUCAGUCNNNNNNNNNNN | Barcoded 5′ adapter 3; AGUC barcode is underlined (HPLC purified) |
| i108 | GUUCAGAGUUCUACAGUCCGACGAUCUCAGNNNNNNNNNNN | Barcoded 5′ adapter 4; UCAG barcode is underlined (HPLC purified) |
| JB1 | GTTCAGAGTTCTACAGTCCGACGATCAGGCTTGACACTTTATGCTTCGGCTCGTATAATGTGNNNNNNNGTGAGCGGATAACAATNNNNNNNNNNNNNNNTGGAATTCTCGGGTGCCAAGG | Template oligo carrying placCONS sequence, a 7-nt randomized region, and a 15-nt randomized region; promoter −10 (TATAAT) and −35 elements (TTGACA) are in bold (PAGE purified) |
| RP1 | AATGATACGGCGACCACCGAGATCTACACGTTCAGAGTTCTACAGTCCGA | Illumina PCR primer (HPLC purified) |
| RPI1 | CAAGCAGAAGACGGCATACGAGATCGTGATGTGACTGGAGTTCCTTGGCACCCGAGAATTCCA | Illumina indexing PCR primer 1 (HPLC purified) |
| s128 | CCTTGGCACCCGAGAATTCC | RT Primer (HPLC purified) |
| s1115 | CTACACGTTCAGAGTTCTACAGTCCGACGATC | Custom Illumina sequencing primer (HPLC purified) |
| s1219 | TATAATGCCTGACCGGCGTTCAGAGTTCTACAGTCCGACGATC | Amplification oligo 1; BglI-α site is underlined (standard desalting) |
| s1220 | AATTAAGCCGCTGGGGCCCTTGGCACCCGAGAATTCC | Amplification oligo 2; BglI-β site is underlined (standard desalting) |
2.2.3. Protocol
- Thaw ssDNA template oligo and amplification oligos at room temperature. Thaw Q5 High-Fidelity 2x Master Mix on ice. Assemble PCR cocktail in 200 μl thin wall PCR tubes as follows.
Component Volume (μl) 1 μM template oligo (e.g. JB1) 1 100 μM amplification oligo 1 (e.g. s1219) 1 100 μM amplification oligo 2 (e.g. s1220) 1 Nuclease-free water 7 Q5 High-Fidelity 2x Master Mix 10 Total volume (μl) 20 - Place the tubes into a thermal cycler and run the following program
Step Temp (°C) Time (s) Cycles Initial denaturation 98 30 1 Denaturation 98 2 35 Annealing 64 5 Extension 72 5 Final extension 72 60 1 Hold 20 ∞ 1 Prepare a 1.5% agarose mini-gel in 1x TAE buffer. For convenience, ethidium bromide may be added to the gel solution to a final concentration 1 μg/ml prior to casting.
Add 7 μl of DNA loading dye to the PCR products from (2.2.3, 2), mix, and load the entire volume into a single well of the agarose gel. Electrophorese at 120 V until the bromophenol blue dye band has migrated 1/2 to 2/3 the length of the gel. Place the gel on a UV transilluminator. Using a new disposable scalpel quickly cut around all 4 sides of the PCR product band and switch off the UV light. Remove the excised band from the gel and transfer to a low binding 1.7 ml microfuge tube.
Recover the PCR product from the gel slice using a gel extraction kit such as the QIAQuick Gel Extraction Kit and elute DNA with 30 μl of nuclease-free water. If using the Qiagen kit, the optional QG buffer wash is omitted and the PE buffer is allowed to stand on the column for 5 min prior to centrifugation. This latter step helps remove trace guanidine salts. Store samples at −20 °C.
2.3. Digestion of PCR product and ligation with plasmid backbone
2.3.1. Equipment
Heat block
Qubit 2.0 fluorometer
Shaking platform
Sterile petri dishes
2.3.2. Reagents
Antarctic Phosphatase supplied with 10x Antarctic Phosphatase buffer
BglI, restriction enzyme
Chloramphenicol
Ethyl alcohol, absolute
10x NEBuffer 3.1
Phenol:Chloroform:IAA, pH 8
QIAquick PCR Purification Kit (Qiagen)
QIAprep Spin Miniprep Kit (Qiagen)
Qubit dsDNA BR Assay Kit
3 M Sodium acetate, pH 5.5
T4 DNA ligase, supplied with 10x buffer
XL1-Blue competent cells
2.3.3. Protocol
The cloning procedure for construction of MASTER libraries involves restriction digestion of the PCR product generated in (2.2) and plasmid pSG289 (Vvedenskaya et al., 2015) with BglI followed by ligation of the resultant DNA fragments. Plasmid pSG289 contains two, distinct recognition sequences for BglI (Bgll-α and BglI-β) upstream of the tR2 transcription terminator that enable the directional cloning of the digested PCR product (Figure 1, middle).
(A). Restriction digest with Bgll
- Prepare a restriction digest as described below and incubate on heat block at 37 °C for 90 min.
Component Volume (μl) pSG289 (20 ng/μl) 10 10x NEBuffer 3.1 5 Nuclease-free water 33 BglI (10 U/μl) 2 Total volume (μl) 50 Add 5.5 μl of 10x Antarctic Phosphatase buffer and 2 μl (10 U) of Antarctic Phosphatase, mix the reaction and return to 37 °C for an additional 30 min.
Purify DNA using a QIAquick PCR purification kit following the manufacturer’s standard protocol.
Perform digestion of the PCR product from (2.2.3, 5) as described in (2.3.3, A1) using ~0.5 μg of linear dsDNA and without addition of phosphatase.
(B). Ligation of dsDNA library into plasmid backbone
- Prepare a 100 μl reaction containing both the digested pSG289 (“backbone”) and the digested PCR product (“insert”). We recommend a molar ratio of 1:5 vector to insert. In addition, prepare a 20 μl control reaction containing only the digested pSG289. Prepare reactions on ice and transfer directly to a 16 °C dry bath and incubate approximately 16 h (i.e. overnight). After incubation samples can be stored at −20 °C.
Component Volume (μl) Volume (μl) (control reaction) Vector 5 2 Insert 5 - 10x T4 DNA ligase buffer 10 2 T4 DNA ligase 5 1 Nuclease-free water 75 15 Total volume (μl) 100 20 Withdraw a 10 μl aliquot of each reaction and transform chemically competent E. coli cells (e.g. XL1-Blue). Plate each transformation on selective medium containing 25 μg/ml chloramphenicol to determine the CFU for each reaction (Figure 2A). The CFU for the reaction containing both the backbone and insert should be at least 10 times greater than the CFU for the control reaction. If not, the ligation should be repeated from step (2.3.3, A).
Add 110 μl of nuclease-free water to the reaction containing both the backbone and insert and mix with 200 μl of phenol:chloroform:IAA (25:24:1, pH 8). Centrifuge at 21,000 x g for 5 min at 4 °C, remove the aqueous phase, and precipitate the DNA by adding 1/10 volume of 3 M sodium acetate (pH 5.5) and 3 volumes of 100% ethanol. Allow samples to incubate for ~16 h at −20 °C.
Pellet the DNA by centrifugation 21,000 x g for 30 min at 4 °C. To remove all traces of salt, wash the pellet three times with 1 ml portions of 75% ethanol. Briefly air-dry the pellet and suspend in nuclease-free water. Measure the concentration of the sample using Qubit dsDNA BR Assay Kit. Store suspended DNA at −20 °C.
Figure 2.
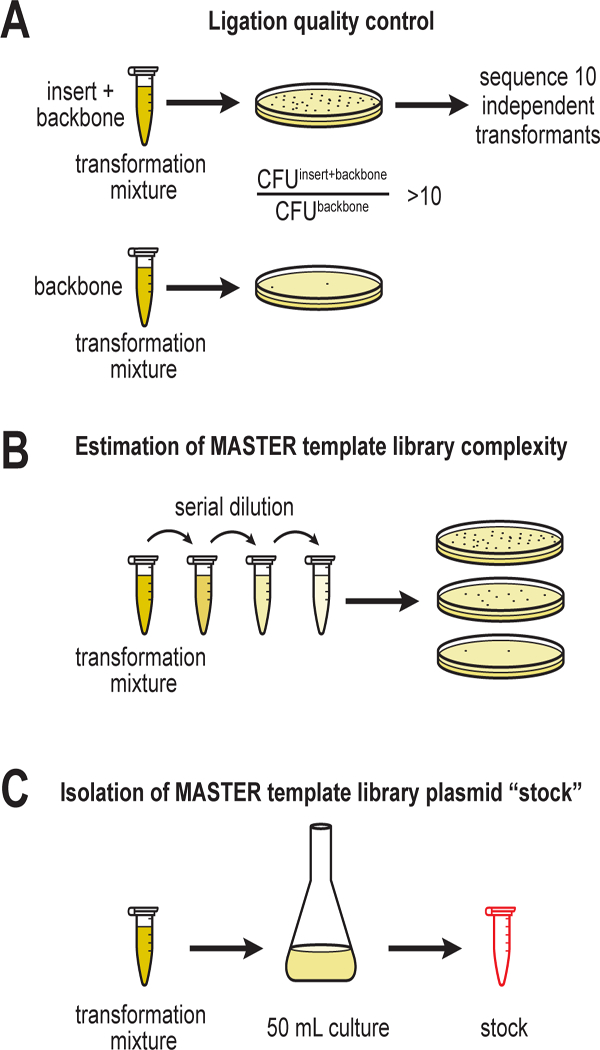
Steps in the generation of plasmid-borne MASTER “stock” library.
2.4. Isolation of recombinant plasmid DNA from cells
2.4.1. Equipment
250 ml DeLong flasks with Morton-style closure
Electroporator
Electroporation cuvettes with 1 mm gaps
Rotator
Shaking platform
Sterile petri dishes
2.4.2. Reagents
LB (10 g bacto tryptone, 5 g yeast extract, and 10 g sodium chloride per 1 L)
NEB 5-alpha competent E. coli (High Efficiency)
Plasmid Midi Kit (Qiagen)
Qubit dsDNA BR Assay Kit
SOC outgrowth medium
2.4.3. Protocol
Electroporation is required to obtain the high transformation efficiency necessary to produce a high complexity library. Combine 250 ng-1 μg of ligated plasmid from (2.3.3, B) with 25 μl of electrocompetent NEB 5-alpha cells in a chilled 0.1 mm gap electroporation cuvette and pulse at 1.8 kV. Add 975 μl of commercial SOC medium to the cuvette, transfer to a 1.7 ml low-binding microfuge tube, and incubate at 37 °C for 1 h with gentle inversion using rotator. (Several electroporations can be performed in parallel and the resulting recovery cell suspensions pooled prior to step 2.)
Withdraw a 10 μl aliquot of the recovered cells suspension, dilute serially, and plate for CFU determination (Figure 2B).
Inoculate the remaining recovery solution directly into 50 ml of LB containing 25 μg/ml chloramphenicol in a 250 ml DeLong flask with Morton-style closure and shake at 220 RPM for ~18 h at 37 °C and 50% relative humidity.
Collect the entire 50 ml overnight culture by centrifugation and isolate the plasmid by Qiagen Plasmid Midi Kit. This plasmid DNA is the MASTER template library stock (Figure 2C). The tube containing the library should be labeled with the number of CFU determined in (2.4.3, 2). Measure the DNA concentration using Qubit dsDNA BR Assay kit and store the plasmid library at −20 °C.
2.4.4. Notes
Use of low retention plastic pipette tips and tubes throughout the protocol is highly recommended.
As a quality control measure, we recommend sequencing the region of interest of ten individual transformants obtained at step (2.3.3, B).
The number of transformants obtained at step (2.4.3, 2) determines the total complexity of the library. As the complexity of the library increases, more sequencing depth is required to assign all of the barcodes to a corresponding sequence in the region of interest.
Obtaining plasmid-borne libraries with complexities greater than ~10 million using the protocol above is challenging based on the limitations imposed by transformation of a ligation mixture into bacterial cells.
3. TRANSCRIPTION ASSAYS
3.1. Overview
For analysis of transcription in vitro, the experimenter has precise control of the topology of the MASTER template library as well as the reaction conditions of the assays. For in vitro experiments that require use of negatively supercoiled DNA, the stock plasmid library prepared in (2.4.3, 4) can, in principle, be used. However, as large quantities of plasmid DNA is required for these experiments, we recommend generating additional quantities of the stock plasmid library for use in transcription assays (see 3.2.3, A) to avoid exhausting the stock supply. For in vitro experiments that require use of non-supercoiled, linear DNA we use an ePCR product generated using the stock plasmid library as the template (see 3.2.3, B).
For analysis of transcription in vivo, the stock plasmid library is introduced into E. coli cells by electroporation. To ensure isolation of transformants derived from most, if not all, of the template sequences in the library the number of transformants obtained at this step should be >10-fold the total number of distinct template sequences in the plasmid library. Transformants are pooled, cells are grown to the desired phase of growth, and total RNA is harvested. A portion of this total RNA will comprise transcripts produced during transcription from the MASTER template library in vivo.
3.2. Preparation of DNA templates
3.2.1. Equipment
2.8 L Fernbach flasks
Shaking platform
Spectrophotometer
Spectrophotometry cuvettes
Thermal cycler
3.2.2. Reagents
BSA fraction V, OmniPur 98%
Chloramphenicol
5x Detergent-free Phusion HF buffer
DNA oligonucleotides (IDT, see Table 1)
E. coli ElectroMax DH10B-T1R electrocompetent cells
Ethyl alcohol, absolute
HiSpeed Plasmid Maxi Kit (Qiagen)
LB (10 g bacto tryptone, 5 g yeast extract, and 10 g sodium chloride per 1 L)
Micellula DNA Emulsion and Purification Kit
dNTP solution mix, 10 mM of each NTP
Phusion HF DNA polymerase
Qubit dsDNA HS Assay Kit
Sodium acetate
Spectinomycin
3.2.3. Protocol
(A). Generation of negatively supercoiled DNA template
Combine 50 ng of plasmid library stock prepared in (2.4.3, 4) with 20 μl of electrocompetent DH10B-T1R cells and transform as described in (2.4.3). The resultant 50 ml overnight culture should contain ~20 million CFU.
Use 49.5 ml of overnight culture to inoculate 2.8 L baffled Fernbach flask containing 1 L of LB supplemented with chloramphenicol (25 μg/ml) [use the remaining 0.5 ml to inoculate 50 ml cultures in parallel for RNA isolation as described in (3.3.3, B)]. Shake the flask at 175 RPM until the cells reach late exponential phase (OD600 ~0.8) whereupon add spectinomycin to a final concentration of 100 μg/ml to increase the copy number of the MASTER plasmid. Continue shaking for an additional 16 h.
Divide the culture equally among six 500 ml centrifuge bottles and collect cells by centrifugation at 13000 x g at 4 °C for 15 min. Use a HiSpeed Plasmid Maxi Kit to isolate supercoiled plasmids from the cell pellets. This stock of the library will serve as (i) template for ePCR to generate a linear template for in vitro transcription experiments and (ii) as a template for in vitro transcription experiments performed using supercoiled templates.
(B). Generation of non-supercoiled, linear DNA template
- Dilute the plasmid isolated in (3.2.3, A) to ~109 molecules/μl in nuclease-free water and use as template in an ePCR reaction. The Micellula DNA Emulsion and Purification Kit is used with Phusion HF detergent-free buffer. The reaction mixture is prepared on ice and emulsions are formed per the manufacturer’s instructions.
omponent Final concentration Volume (μl) 109 molecules/μl template plasmid — 1 10 μM Illumina RP1 primer 0.5 μM 2.5 10 μM Illumina RPI 1 primer 0.5 μM 2.5 0.1 mg/ml BSA 5 μg/ml 2.5 10 mM dNTP mix 0.4 mM 2 5x Phusion HF buffer (detergent-free) 1x 10 Nuclease-free water — 27.5 Phusion HF DNA Polymerase 0.04 U/μl 2 Total volume (μl) 50 - Place the tubes containing the emulsions into a thermal cycler and run the following program.
Step Temp (°C) Time (s) Cycles Initial denaturation 95 10 1 Denaturation 95 5 30 Annealing 60 5 Extension 72 15 Final extension 72 5 min 1 Hold 4 ∞ 1 Break the emulsion and purify the DNA according to manufacturer’s instructions. Concentrate the DNA by addition of 1/10 volume of 3 M NaOAc and 3 volumes of 100% ethanol and incubate ~16 h at −80 °C. After precipitation, wash the DNA pellet twice with 1 ml portions of 80% ethanol chilled to −20 °C before resuspension in 20 μl of nuclease-free water. Measure the DNA concentration using Qubit dsDNA HS Assay Kit. Store at −20 °C.
3.3. Generation and isolation of RNA transcripts
3.3.1. Equipment
Containers for gel staining (we use pipette tip box lids)
250 ml DeLong flasks with Morton-style closure
Heat block
Low-binding tubes, 0.5 ml
Spectrophotometer
Spectrophotometry cuvettes
Spin-X centrifuge tube filter, 0.45 µm, RNase/DNase free
Stainless steel disposable scalpels, No. 10 blade
Sterile needle, 23-gauge
Table top centrifuge
Thermal cycler
Vertical gel electrophoresis apparatus
3.3.2. Reagents
Acid phenol:chloroform, pH 4.5
BSA fraction V, OmniPur 98%
Chloramphenicol
Direct-zol RNA MiniPrep
DNase I
DTT
0.5 M EDTA, pH 8
Elution buffer (0.3 M NaCl, 10 mM Tris-HCl pH 8, 1 mM EDTA)
Ethyl alcohol, absolute
Glycerol
Glycogen ultrapure
Heparin sulfate
LB (10 g bacto tryptone, 5 g yeast extract, and 10 g sodium chloride per 1 L)
Low Range ssRNA ladder (NEB)
Magnesium chloride
MICROBExpress Kit
NTP set (ultra-pure), 100 mM solutions
Potassium chloride
QIAprep Spin Miniprep Kit (Qiagen)
2x RNA Gel loading dye (9.5 ml deionized formamide, 0.5 ml 0.5 M EDTA pH 8.0, 12.5 μl 20% SDS; bromophenol blue, xylene cyanol and amaranth powders are added to desired color intensity)
RNAP holoenzyme, purified as in (Mukhopadhyay, Mekler, Kortkhonjia, Kapanidis, Ebright & Ebright, 2003)
RNase OUT
Sodium acetate
Spin-X centrifuge tube filter, 0.45 µm, RNase/DNase free
10% TBE-Urea gels, 1mm x 10 wells
TBE buffer (54 g Tris base, 27.5 g boric acid, 20 ml 0.5 M EDTA per 1 L)
TRI Reagent
Tris-HCl pH 8
TURBO DNase
SYBR Gold nucleic acid gel stain
3.3.3. Protocol
(A). In vitro transcription
Transcription assays: Mix template DNA from (3.2.3, A) or (3.2.3, B) with RNAP holoenzyme in transcription buffer (50 mM Tris HCl pH 8.0, 10 mM MgCl2, 0.01 mg/ml BSA, 100 mM KCl, 5% glycerol, 10 mM DTT, 0.4 U/μl RNase OUT) and equilibrate at 37 °C on heat block for 10 min to form open complexes. We recommend using a 1:5 ratio of template to RNAP (e.g. 10 nM template with 50 nM RNAP). Initiate a single round of transcription by addition of NTPs and heparin to final concentrations of 1 mM NTPs and 0.1 mg/ml heparin. After 15 min, stop the reactions by addition of 0.5 M EDTA to 50 mM final. Recover nucleic acids by ethanol precipitation, wash twice with 80% cold ethanol and suspend in 30 μl of nuclease-free water.
Separation of RNA products by gel electrophoresis. Mix nucleic acids with an equal volume of 2x RNA loading dye, heat in thermal cycler at 95 °C for 3 min. Load samples onto pre-cast 10% TBE-urea gel next to Low Range ssRNA ladder. Visualize bands with SYBR Gold stain and excise RNA transcripts using a clean disposable scalpel.
Isolation of RNA products. Crash gel slices by centrifugal extrusion. Place the slices into 0.5 ml low binding microfuge tubes in which 3 holes have been made through the bottom with a 23-gauge needle. Place this tube, in turn, into a 1.7 ml low binding microfuge tube. Centrifuge the tube-in-tube assembly at 14000 x g for 2 min or until all gel fragments have passed through the holes in the upper 0.5 ml tube and are collected in the lower 1.7 ml tube. To extract nucleic acids, add 300 μl of elution buffer to the crushed gel and incubate the slurry at 70 °C for 10 min. Recover the eluate by applying the slurry to a Spin-X tube filter and centrifuging at 14,000 x g for 1 min. Recover the crushed gel from the Spin-X tube after centrifugation, mix with an additional 300 μl of elution buffer and repeat the elution step. Pool the eluates, precipitate as described in (3.3.3, B4) and suspend in the specified volume of nuclease-free water.
(B). In vivo transcription
Cell culture and harvest. Use 0.5 ml of the overnight culture from (3.2.3, A) to inoculate 50 ml of LB containing chloramphenicol (25 μg/ml) in a 250 ml DeLong flask and shake at 210 RPM at 37 °C until cells reach mid-exponential phase (OD600 ~0.5). Rapidly harvest a total of 12 ml by withdrawing 6 × 2 ml aliquots of the cell suspension into 2 ml tubes and collecting the cells by centrifugation (1 min, 21,000 x g at room temperature). Remove the supernatants and freeze cell pellets rapidly on dry ice and store at −80 °C. One of these pellets will be used for RNA isolation for 5′ RNA-seq, two pellets will be used for isolation of plasmid DNA (QIAprep Spin Miniprep kit). This plasmid DNA will serve as template in ePCR reactions to generate a product that will be sequenced to identify and assign the barcodes present in the plasmid library. Store the remaining pellets at −80 °C as a back-up in case any steps need to be repeated.
RNA isolation. Suspend each cell pellet collected from 2 ml of cell suspension in 600 μl of TRI Reagent solution. Incubate samples at 70 °C for 10 min to ensure complete lysis and centrifuge (10 min, 21,000 x g at 4 °C) to remove insoluble material. Transfer the supernatant to a fresh tube, add ethanol to a final concentration of 60.5% and divide the mixture equally between two Direct-zol spin columns (Zymo Research). Perform DNase I treatment on-column according to the manufacturer’s recommendations. Elute RNA from the columns with 3 sequential portions of 30 μl nuclease-free water that had been heated to 70 °C. To remove residual DNA, treat RNAs with 2 U of TURBO DNase at 37 °C for 1 h.
Sample cleanup: phenol extraction. Following DNase treatment, add to samples an equal volume of acid phenol:chloroform (5:1, pH 4.5). Vortex samples vigorously to mix and separate phases by centrifugation at 21,000 x g for 5 min at 4 °C. Recover the upper, aqueous phase by pipetting into a fresh tube.
Sample cleanup: ethanol precipitation. To each sample, add 1/10 volume of 3 M sodium acetate (pH 5.5), 1/100 volume of 10 mg/ml glycogen, and 3 volumes of 100% ethanol and place the samples at −80 °C for a minimum of 3 h but preferably 16 h. Pellet nucleic acid by centrifugation at 21,000 x g for 30 min at 4 °C. Remove the supernatant by pipetting and wash the pellet by adding 1 ml of cold (−20 °C) 80% ethanol. Dislodge the pellet from the tube bottom by vortexing in wash solution and collect the pellet again by centrifugation as above for 5 min and remove the supernatant by pipetting. Repeat the wash twice. After the final wash is removed, allow the pellet to air-dry for ~5 min. Suspend the pellet by addition of nuclease-free water followed by a 20 min incubation on ice to permit solubilization of the nucleic acids. A complete resuspension of nucleic acid is achieved by pipetting (no vortexing is recommended). The typical yield of total RNA isolated from 2 ml cell suspension is ~60 μg.
rRNA depletion. Due to their abundance, it may be desirable to remove ribosomal RNAs (rRNAs) from the total RNA. Deplete rRNAs from 9 μg of TURBO DNase-treated RNA using MICROBExpress kit according to the manufacturer’s protocol, precipitate overnight, wash twice with 80% cold EtOH and suspend in 30 μl of nuclease-free water. Store RNA at −80 °C for up to 6 months.
3.3.4. Notes
For experiments performed in vitro, assays may be performed in the presence of NTPs only (as described above), or in the presence of NTPs mixed with a non-canonical initiating nucleotide, NCIN, such as nicotinamide adenine dinucleotide [NAD; see (Vvedenskaya, Bird, Zhang, Zhang, Jiao, Barvik et al., 2018)].
For experiments performed in vivo, the total RNA isolated from cells can also be used to perform RNA-seq analysis of chromosomally encoded promoters to allow comparison of the behavior of natural promoters with the sequence variants in the library [see, (Vvedenskaya, Vahedian-Movahed, Zhang, Taylor, Ebright & Nickels, 2016)].
4. HIGH-THROUGHPUT SEQUENCING OF RNA 5' ENDs (5' RNA-seq)
4.1. Overview
For use of MASTER to study transcription initiation we have measured transcription output by performing high-throughput sequencing of RNA 5' ends, “5' RNA-seq.” The results provide both the 5'-end sequence and relative yields of RNA products generated from each template sequence in the library. For use of MASTER to study post-initiation steps of transcription, it may be desirable to modify the procedure to sequence RNA 3’ ends rather than RNA 5' ends. A protocol to perform high-throughput sequencing of RNA 3’ ends can be found in (Vvedenskaya, Vahedian-Movahed, Bird, Knoblauch, Goldman, Zhang et al., 2014).
Transcription initiation in vivo that involves use of a standard, nucleoside triphosphate (NTP) initiating nucleotide will generate RNA products having a 5' end that contains a triphosphate group. However, recent work has led to an emerging view that indicates bacterial RNAP can also use non-standard initiating substrates for transcription initiation in vivo (Barvik, Rejman, Panova, Sanderova, & Krasny, 2017). In particular, RNA products generated by initiation with ~2- to 4-nt “nanoRNA” primers (Druzhinin, Tran, Skalenko, Goldman, Knoblauch, Dove et al., 2015; Goldman, Sharp, Vvedenskaya, Livny, Dove & Nickels, 2011; Nickels, 2012; Vvedenskaya, Sharp, Goldman, Kanabar, Livny, Dove et al., 2012) or by initiation with non-canonical initiating nucleotides (NCINs) such as nicotinamide adenine dinucleotide (NAD) have also been detected in vivo (Bird, Zhang, Tian, Panova, Barvik, Greene et al., 2016; Cahova, Winz, Hofer, Nubel, & Jaschke, 2015; Chen, Kowtoniuk, Agarwal, Shen, & Liu, 2009; Kowtoniuk, Shen, Heemstra, Agarwal, & Liu, 2009; Vvedenskaya et al., 2018). MASTER enables the analysis of RNA products generated by NTP-mediated initiation, and RNA products generated by nanoRNA- or NCIN-mediated initiation.
RNA products generated in vivo by nanoRNA-mediated initiation contain a 5'-hydroxyl, while RNA products generated by NCIN-mediated initiation carry a 5'-NCIN “cap.” The 5' RNA-seq procedure used in MASTER enables the differential detection and quantitation of RNA transcripts on the basis of the chemical nature of the RNA 5' ends. The procedure relies upon the ligation of single-stranded oligonucleotide adaptors to RNA 5' ends. The ligation of single-stranded oligonucleotide adaptors requires that the RNA have a 5'-monophosphate. Thus, analysis of RNAs that do not have a 5'-monophosphate requires enzymatic processing of the RNAs to yield RNAs having a 5'-monophosphate. Accordingly, analysis of RNA products generated by NTP-mediated initiation, nanoRNA-mediated initiation, or NCIN-mediated initiation each require a distinct enzymatic processing step to yield a 5'-monophosphate. The requirement for a distinct enzymatic processing step to yield a 5'-monophosphate enables the differential detection and quantitation of RNA transcripts on the basis of whether the RNA was generated by use of an NTP, nanoRNA, or NCIN as the initiating entity.
4.2. Enzymatic treatments of RNA 5' ends
4.2.1. Equipment
Containers for gel staining (we use pipette tip box lids)
Heat block
Stainless steel disposable scalpels, No. 10 blade
Spin-X centrifuge tube filter, 0.45 µm, RNase/DNase free
Sterile needle, 23-gauge
Vertical gel electrophoresis apparatus
4.2.2. Reagents
Acid phenol:chloroform, pH 4.5
ATP, 10 mM
CIP, Calf Intestinal Phosphatase
10x CutSmart buffer
Elution buffer (0.3 M NaCl, 10 mM Tris-HCl pH 8, 1 mM EDTA)
Ethyl alcohol, absolute
Glycogen ultrapure
Low Range ssRNA ladder (NEB)
Manganese chloride
10x NEBuffer 2
NudC decapping enzyme purified as in (Cahova et al., 2015)
Rai1 decapping enzyme purified as in (Xiang, Cooper-Morgan, Jiao, Kiledjian, Manley & Tong, 2009)
Rai1 buffer (10 mM Tris-HCl pH 7.5, 100 mM KOAc, 2 mM MgOAc, 2 mM DTT)
2x RNA gel loading dye (9.5 ml deionized formamide, 0.5 ml 0.5 M EDTA pH 8.0, 12.5 μl 20% SDS; bromophenol blue, xylene cyanol and amaranth powders are added to desired color intensity)
5' RNA Polyphosphatase supplied with 10x buffer
RNase OUT
RNeasy MinElute Clean Up Kit (Qiagen)
10% TBE-Urea gels, 1mm x 10 wells
T4 PNK supplied with 10x buffer
TBE buffer (54 g Tris base, 27.5 g boric acid, 20 ml 0.5 M EDTA per 1 L)
SYBR Gold nucleic acid gel stain
4.2.3. Protocol
(A). Enzymatic conversion of RNA 5' ends to monophosphate ends suitable for ligation.
As mentioned above, the ligation of single-stranded oligonucleotide adaptors to RNA 5' ends requires that the RNAs have a 5'-monophosphate. Thus, analysis of RNAs that do not have a 5'-monophosphate requires enzymatic processing of the RNAs to yield RNAs having a 5'-monophosphate. For processing of 5'-triphosphate RNA to 5'-monophosphate RNA we use the RNA processing enzyme RNA 5' polyphosphatase (Rpp), which cleaves the phosphodiester bond between the triphosphate β and α phosphates, yielding products comprising 5' monophosphate followed by the remainder of the RNA. For processing of 5'-hydroxyl RNA to 5'-monophosphate RNA, we use T4 PNK which catalyzes the transfer of the γ phosphate of ATP to the RNA 5'-OH. For selective processing of NCIN-capped RNA to 5'-monophosphate RNA, we use the bacterial RNA-decapping enzyme NudC or the fungal RNA-decapping enzyme Rai1. NudC processes NCIN-capped RNA to 5'-monophosphate RNA by cleaving the diphosphate group of the NCIN cap, yielding products comprising 5'-pNp (where N is the 3’ nucleoside moiety of the NCIN and “p” is a monophosphate) followed by the remainder of the RNA (Cahova et al., 2015; Hofer, Li, Abele, Frindert, Schlotthauer, Grawenhoff et al., 2016) while Rai1 processes NCIN-capped RNAs to 5'-monophosphate RNA by cleaving the phosphodiester bond connecting the NCIN cap to the remainder of the RNA, yielding products comprising 5' monophosphate followed by the remainder of the RNA (Jiao, Doamekpor, Bird, Nickels, Tong, Hart et al., 2017).
-
Rpp treatment
Assemble the reaction as follows.Component Volume (μl) RNA (up to 2 μg) from (3.3.3, A-B) 10 10x Rpp buffer 2 RNase OUT, 40 U/μl 1 Rpp, 20 U/μl 1 Nuclease-free water 6 Total volume (μl) 20 Incubate for 30 min at 37 °C.
-
T4 PNK treatment
Assemble the reaction as follows.Component Volume (μl) RNA (up to 2 μg) from (3.3.3, A-B) 10 10x T4 PNK buffer 5 10 mM ATP 5 RNase OUT, 40 U/μl 1 T4 PNK, 10 U/μl 1 Nuclease-free water 28 Total volume (μl) 50 Incubate for 30 min at 37 °C.
-
NudC treatment
Assemble the reaction as follows.Component Volume (μl) RNA (up to 2 μg) from (3.3.3, A-B) 10 10x NEBuffer 2 2 RNase OUT, 40 U/μl 1 NudC, 55 μM 1.3 Nuclease-free water 5.7 Total volume (μl) 20 Incubate for 30 min at 37 °C.
-
Rai1 treatment
Assemble the reaction as follows.Component Volume (μl) RNA (up to 2 μg) from (3.3.3, A-B) 10 10x Rai1 buffer 2 100 mM MnCl2, prepared fresh 0.2 RNase OUT, 40 U/μl 1 Rai1, 3.4 μM 2 Nuclease-free water 4.8 Total volume (μl) 20 Incubate for 30 min at 37 °C.
(B). Recovery of RNA products after enzymatic treatment
RNA products generated in vitro. Add 20 μl of 2x RNA loading dye. Heat samples at 95 oC for 3 min and load next to ssRNA ladder on a 10% TBE-urea slab gels. Run gel in 1x TBE. Visualize RNA using SYBR Gold nucleic acid gel stain and excise RNA products of the desired size from the gel using sterile scalpel. Elute nucleic acids from the gel pieces and purify by precipitation as described in (3.3.3). Suspend RNAs in 10 μl of nuclease-free water.
RNA products generated in vivo. For RNA treated with T4 PNK use a RNeasy MinElute Clean Up kit to ensure removal of excess ATP. Elute purified RNA with 10 μl of nuclease-free water. For RNA treated with Rpp, NudC, or Rai1 add 80 μl of nuclease-free water to the sample and mix with 100 μl of acid phenol/chloroform. Centrifuge the sample, recover the upper (aqueous) phase, precipitate and recover RNA as described in (3.3.3, B). Suspend RNA in 10 μl of nuclease-free water.
4.2.4. Notes
For analysis of RNA products containing a 5' triphosphate or 5' hydroxyl we recommend removal of 5'-monophosphate RNA from samples by use of Terminator 5'-Phosphate-Dependent Exonuclease (Epicentre) prior to Rpp or PNK treatment.
For analysis of RNA products containing a 5'-NCIN we recommend conversion of 5'-phosphate RNA to 5'-hydroxyl RNA by use of a Phosphatase such as Calf Intestinal Phosphatase (CIP; NEB) prior to NudC or Rai1 treatment.
4.3. 5'Adapter ligation
4.3.1. Equipment
Containers for gel staining (we use pipette tip box lids)
Heat block
Stainless steel disposable scalpels, No. 10 blade
Spin-X centrifuge tube filter, 0.45 µm, RNase/DNase free
Sterile needle, 23-gauge
Thermal cycler
Vertical gel electrophoresis apparatus
4.3.2. Reagents
ATP, 10 mM
Elution buffer (0.3 M NaCl, 10 mM Tris-HCl pH 8, 1 mM EDTA)
Ethyl alcohol, absolute
Glycogen ultrapure
Low Range ssRNA ladder (NEB)
50% PEG-8000
RNA oligonucleotides (IDT, see Table 1)
2x RNA gel loading dye (9.5 ml deionized formamide, 0.5 ml 0.5 M EDTA pH 8.0, 12.5 μl 20% SDS; bromophenol blue, xylene cyanol and amaranth powders are added to desired color intensity)
RNase OUT
10% TBE-Urea gels, 1mm x 10 wells
TBE buffer (54 g Tris base, 27.5 g boric acid, 20 ml 0.5 M EDTA per 1 l)
T4 RNA ligase 1, supplied with 10x buffer
SYBR Gold nucleic acid gel stain
4.3.3. Protocol
- Assemble a ligation reaction containing RNAs generated in vitro or in vivo as described and incubate in thermal cycler at 16 °C for ~16 h.
Component Final amount Volume (μl) RNA from (4.2) — 10 10 μM 5’ adapter s1206 0.33 μM (in vitro) or 1 μM (in vivo) 1 (in vitro) or 3 (in vivo) 50% PEG-8000 10% 6 10 mM ATP 1 mM 3 10x T4 RNA ligase 1 buffer 1x 3 RNase OUT 40 U 1 T4 RNA ligase 1 10 U 1 Nuclease-free water - 5 or 3 Total volume (μl) 30 Stop reactions by adding 30 μl of 2x RNA loading dye, heat samples at 95 °C for 3 min in thermal cycler, and separate RNAs by electrophoresis on 10% TBE-urea slab gels (equilibrated and run in 1x TBE). Incubate gels with SYBR Gold nucleic acid gel stain and visualize bands with UV transillumination. Recover RNA products from the gel as described in (3.3.3) and suspend in 10 μl of nuclease-free water.
4.3.4. Notes
The s1206 adaptor used in the ligation reactions has 15 nt of random 3’-end sequence. The use of a pool of adaptors with different 3’-end sequences minimizes the potential for sequence-dependent effects on ligation efficiency. The use of a pool of adaptors also associates a unique molecular identifier (UMI) with each RNA molecule prior to ePCR that is used to eliminate effects of differential amplification.
Quantitative comparisons between two or more RNA samples subjected to different enzymatic treatments to convert RNA 5' ends to monophosphate ends can be performed by replacing the s1206 adaptor with two or more of the barcoded 5'-adaptor oligonucleotides i105, i106, i107, and i108. The adaptors i105, i106, i107, and i108 each carry a unique 4-nt barcode sequence followed by 11 nt of random 3’-end sequence (Table 1). When using barcoded 5'-adaptor oligonucleotides for quantitative comparisons of multiple samples, the adaptor-ligated RNA products of each sample are mixed prior to the gel electrophoresis step in (4.3.3). For an example of the use of i105, i106, i107, and i108 to perform quantitative comparisons between samples see (Vvedenskaya et al., 2018).
4.4. Generation of cDNAs
4.4.1. Equipment
Containers for gel staining (we use pipette tip box lids)
Heat block
Stainless steel disposable scalpels, No. 10 blade
Spin-X centrifuge tube filter, 0.45 µm, RNase/DNase free
Sterile needle, 23-gauge
Thermal cycler
Vertical gel electrophoresis apparatus
4.4.2. Reagents
DTT
Elution buffer (0.3 M NaCl, 10 mM Tris-HCl pH 8, 1 mM EDTA)
Ethyl alcohol, absolute
Glycogen ultrapure
Low Range ssRNA ladder (NEB)
dNTP solution mix, 10 mM of each NTP
O’Gene Ruler Ultra Low Range DNA ladder
6x Orange DNA loading dye
Qubit dsDNA HS Assay Kit
Qubit ssDNA Assay Kit
2x RNA gel loading dye (9.5 ml deionized formamide, 0.5 ml 0.5 M EDTA pH 8.0, 12.5 μl 20% SDS; bromophenol blue, xylene cyanol and amaranth powders are added to desired color intensity)
RNase H
RNase OUT
SuperScript III Reverse Transcriptase supplied with 5x First-Strand buffer
10% TBE-Urea gels, 1mm x 10 wells
10% TBE gels, 1mm x 10 wells
TBE buffer (54 g Tris base, 27.5 g boric acid, 20 ml 0.5 M EDTA per 1 L)
SYBR Gold nucleic acid gel stain
4.4.3. Protocol
- Combine 10 μl of adapter-ligated RNAs with 0.3 μl of oligo s128 (100 pmol/μl). Incubate the mixture for 5 min at 65 °C and then cool the mixture to 4 °C. Add 9.7 μl of a reverse transcription cocktail of the following composition.
RT cocktail component Final amount Volume (μl) 5x First-Strand buffer 1x 4 10 mM dNTP mix 500 μM 1 100 mM DTT 5 mM 1 RNase OUT 40 U 1 Nuclease-free water — 1.7 SuperScript III Reverse Transcriptase 200 U 1 Total volume (μl) 9.7 - Place the samples in a thermal cycler and run the following program.
Step Temp (°C) Time (min) Action RT 1 55 60 RT 2 70 15 Cool 25 Hold add 10 U of RNase H RNase H 37 20 Mix cDNAs with equal volume of 2x RNA loading dye, load on gel next to ssRNA ladder, and separate by electrophoresis on 10% TBE-urea slab gels in 1x TBE buffer. Recover products from the gel as described in (3.3.3) and suspend cDNA in 20 μl of nuclease-free water.
Quantify cDNAs using Qubit ssDNA Assay kit, dilute and perform ePCR as in step (3.2.3, B) but using only 20 cycles. Break the emulsion and purify cDNAs.
If residual primers are present, mix purified cDNA with 6x Orange DNA loading dye and isolate amplified cDNAs by electrophoresis using a non-denaturing 10% TBE gel. Load O’Gene Ruler Ultra Low Range DNA ladder as size standard. Isolate products by gel excision using the procedure described in (3.3.3). Elute cDNA from gel with 600 μl of elution buffer at 37 °C for 2 h, precipitate and suspend in 20 μl of nuclease-free water.
The concentration of the isolated cDNA is determined using a Qubit dsDNA HS Assay kit.
4.5. High-throughput sequencing and data analysis
4.5.1. Overview
This section provides a general overview of the data analysis for MASTER experiments. The source code and documentation for all MASTER analyses performed in our published work is provided at: https://github.com/NickelsLabRutgers.
4.5.2. High-throughput sequencing
The ePCR product derived from amplification of the MASTER template library prepared in (3.2.3, B) and the cDNA products derived from RNA transcripts prepared in (4.4.3) are sequenced using an Illumina sequencer. Sequencing primers provided by Illumina typically contain a mixture of several oligos. To avoid potential complications that may arise due to the presence of additional primers in the Illumina reagents, a custom sequencing primer can be used (e.g., primer s1115; Table 1).
4.5.3. Data analysis: ePCR products derived from MASTER template library
The ePCR product generated in (3.2.3, B) is sequenced using an Illumina sequencer. The results identify what fraction of the potential sequence variants in the region of interest are present in the library and identify the transcribed-region barcode associated with individual sequences in the region of interest. As mentioned in (2.1), template libraries should contain >95% of the theoretical maximum number of potential sequence variants in the region of interest. In addition, >95% of the barcode sequences present in the library should be associated with a single sequence variant in the region of interest. In addition to enabling the association of transcribed-region barcodes with a sequence variant in the region of interest, the results define the relative abundance of each sequence variant in the region of interest.
4.5.4. Data analysis: cDNA libraries derived from RNA transcripts
For cDNA libraries prepared using adaptors s1206, i105, i106, i107, or i108, the 16th base of the read is the sequence of the RNA 5' end from which the cDNA was generated. For libraries prepared using adaptor s1206, the first 15 bases of each sequencing read provide the UMI used to correct amplification bias introduced during ePCR. For cDNA libraries prepared using adaptors i105, i106, i107, or i108, the first four bases of each sequencing read provide the barcode used to identify the enzymatic treatment, and the next 11 bases provide UMI used to correct amplification bias introduced during ePCR.
For each sequencing read derived from an RNA 5' end, the identity of the transcribed-region barcode identifies the DNA template sequence variant that produced the RNA transcript and the sequence of the RNA 5' end defines the first nucleotide of the RNA transcript. Sequencing reads having identical RNA 5'-end sequences and identical sequence tags are counted as only a single read in the analysis.
For a given promoter sequence variant, the relative transcription output can be calculated as the total number of RNA products generated from the sequence variant divided by relative proportion of promoter sequence variants in the library [see (Vvedenskaya et al., 2015)]. In addition, for a given promoter sequence variant, the sequence of RNA 5' ends generated from the sequence variant defines the positions where transcription start site selection occurs for this promoter sequence [see (Vvedenskaya et al., 2018; Vvedenskaya et al., 2016; Vvedenskaya et al., 2015; Winkelman et al., 2016)] and can be used to define the extent of reiterative transcription initiation (“slippage synthesis”) for this promoter sequence (Vvedenskaya et al., 2015)
5. CONCLUSIONS
5.1. Summary
A systems-level view of cellular gene expression requires understanding the mechanistic principles governing each step of transcription. Summarized below are examples of prior work that illustrate the broad utility of MASTER to probe the complex interplay between RNAP and nucleic acids during transcription, thereby illuminating the mechanistic principles governing this step of gene expression.
MASTER has been used to define, comprehensively, critical sequence determinants for transcription start site selection, reiterative transcription initiation, and transcript yields for E. coli RNAP (Winkelman et al., 2016; Vvedenskaya et al., 2016; Vvedenskaya et al., 2015; Hochschild, 2015).
MASTER has been used to define promoter sequence determinants responsive to changes in DNA topology or changes in the concentrations of NTP substrates for transcription with E. coli RNAP (Vvedenskaya et al., 2015). The analysis of effects of DNA topology showed that the position of the transcription start site depends on DNA topology, consistent with the proposal that start site selection involves changes in the size of the transcription bubble, “DNA scrunching.”
MASTER has been used to establish that sequence-specific interactions between the E. coli RNAP core enzyme and the downstream part of the non-template strand of the transcription-bubble (“core recognition element,” CRE) are a previously undocumented determinant of transcription start site selection (Vvedenskaya et al., 2016). To do this, we used MASTER to compare the transcription start site profile of wild-type RNAP to that of an RNAP derivative defective in sequence-specific interactions between RNAP and the CRE.
MASTER has been used to define the promoter-sequence determinants for NCIN capping with nicotinamide adenine dinucleotide (NAD) for E. coli RNAP (Vvedenskaya et al., 2018).
MASTER has been used in parallel with a method for massively-parallel protein-DNA crosslinking, termed “MASTER-XL,” to determine simultaneously, for a library of 410 promoter sequences, the transcription start site, the position of the RNAP leading edge, and the position of the RNAP trailing edge for E. coli RNAP (Winkelman et al., 2016). The results established that as the position of the transcription start site changes, the position of the RNAP leading edge changes in lock-step register, but the position of the RNAP trailing edge does not change, consistent with the proposal that start site selection involves DNA scrunching.
5.2. Future prospects
We anticipate MASTER (or derivatives thereof) will be used to fully define sequence determinants of each step of transcription initiation and each step of transcription that occurs post-initiation for E. coli RNAP. We further anticipate adapting MASTER for the analysis of other bacterial RNAPs, archaeal RNAP, and eukaryotic RNAP II.
To date, we have defined how various sequence-based features influence transcription in isolation. In future work, we anticipate the results of MASTER will enable the development of a synthetic modeling framework that allows us to integrate the relative contributions of all sequence-based features and all reaction conditions to transcription output. Such models can enable accurate predictions of how transcription of a given gene will be affected by alterations in cellular conditions, thereby providing a quantitative understanding of how cells ensure proper control of gene expression.
ABBREVIATIONS
- BSA
bovine serum albumin
- CFU
colony-forming unit
- dsDNA
double-stranded DNA
- ssDNA
single-stranded DNA
- DTT
1,4-Dithiothreitol
- LB
lysogeny broth
- MASTER
massively systematic transcript end readout
- ePCR
emulsion PCR
- UMI
unique molecular identifier
REFERENCES
- Barvik I, Rejman D, Panova N, Sanderova H, & Krasny L (2017). Non-canonical transcription initiation: the expanding universe of transcription initiating substrates. FEMS Microbiol Rev, 41(2), 131–138. 10.1093/femsre/fuw041 [DOI] [PubMed] [Google Scholar]
- Bird JG, Zhang Y, Tian Y, Panova N, Barvik I, Greene L, … Nickels BE (2016). The mechanism of RNA 5' capping with NAD+, NADH and desphospho-CoA. Nature, 535(7612), 444–447. 10.1038/nature18622 [DOI] [PMC free article] [PubMed] [Google Scholar]
- Cahova H, Winz ML, Hofer K, Nubel G, & Jaschke A (2015). NAD captureSeq indicates NAD as a bacterial cap for a subset of regulatory RNAs. Nature, 519(7543), 374–377. 10.1038/nature14020 [DOI] [PubMed] [Google Scholar]
- Chen YG, Kowtoniuk WE, Agarwal I, Shen Y, & Liu DR (2009). LC/MS analysis of cellular RNA reveals NAD-linked RNA. Nat Chem Biol, 5(12), 879–881. 10.1038/nchembio.235 [DOI] [PMC free article] [PubMed] [Google Scholar]
- Cramer P (2002). Multisubunit RNA polymerases. Curr Opin Struct Biol, 12(1), 89–97. [DOI] [PubMed] [Google Scholar]
- Darst SA (2001). Bacterial RNA polymerase. Curr Opin Struct Biol, 11(2), 155–162. [DOI] [PubMed] [Google Scholar]
- Druzhinin SY, Tran NT, Skalenko KS, Goldman SR, Knoblauch JG, Dove SL, & Nickels BE (2015). A Conserved Pattern of Primer-Dependent Transcription Initiation in Escherichia coli and Vibrio cholerae Revealed by 5' RNA-seq. PLoS Genet, 11(7), e1005348 10.1371/journal.pgen.1005348 [DOI] [PMC free article] [PubMed] [Google Scholar]
- Duchi D, Bauer DL, Fernandez L, Evans G, Robb N, Hwang LC, … Kapanidis AN (2016). RNA Polymerase Pausing during Initial Transcription. Mol Cell, 63(6), 939–950. 10.1016/j.molcel.2016.08.011 [DOI] [PMC free article] [PubMed] [Google Scholar]
- Ebright RH (2000). RNA polymerase: structural similarities between bacterial RNA polymerase and eukaryotic RNA polymerase II. J Mol Biol, 304(5), 687–698. 10.1006/jmbi.2000.4309 [DOI] [PubMed] [Google Scholar]
- Feklistov A, Sharon BD, Darst SA, & Gross CA (2014). Bacterial sigma factors: a historical, structural, and genomic perspective. Annu Rev Microbiol, 68, 357–376. 10.1146/annurev-micro-092412-155737 [DOI] [PubMed] [Google Scholar]
- Goldman SR, Sharp JS, Vvedenskaya IO, Livny J, Dove SL, & Nickels BE (2011). NanoRNAs prime transcription initiation in vivo. Mol Cell, 42(6), 817–825. 10.1016/j.molcel.2011.06.005 [DOI] [PMC free article] [PubMed] [Google Scholar]
- Hochschild A (2015). Mastering Transcription: Multiplexed Analysis of Transcription Start Site Sequences. Mol Cell, 60(6), 829–831. 10.1016/j.molcel.2015.12.007 [DOI] [PubMed] [Google Scholar]
- Hofer K, Li S, Abele F, Frindert J, Schlotthauer J, Grawenhoff J, … Jaschke A (2016). Structure and function of the bacterial decapping enzyme NudC. Nat Chem Biol, 12(9), 730–734. 10.1038/nchembio.2132 [DOI] [PMC free article] [PubMed] [Google Scholar]
- Jiao X, Doamekpor SK, Bird JG, Nickels BE, Tong L, Hart RP, & Kiledjian M (2017). 5' End Nicotinamide Adenine Dinucleotide Cap in Human Cells Promotes RNA Decay through DXO-Mediated deNADding. Cell, 168(6), 1015–1027 10.1016/j.cell.2017.02.019 [DOI] [PMC free article] [PubMed] [Google Scholar]
- Kapanidis AN, Margeat E, Ho SO, Kortkhonjia E, Weiss S, & Ebright RH (2006). Initial transcription by RNA polymerase proceeds through a DNA-scrunching mechanism. Science, 314(5802), 1144–1147. 10.1126/science.1131399 [DOI] [PMC free article] [PubMed] [Google Scholar]
- Kowtoniuk WE, Shen Y, Heemstra JM, Agarwal I, & Liu DR (2009). A chemical screen for biological small molecule-RNA conjugates reveals CoA-linked RNA. Proc Natl Acad Sci U S A, 106(19), 7768–7773. 10.1073/pnas.0900528106 [DOI] [PMC free article] [PubMed] [Google Scholar]
- Lerner E, Chung S, Allen BL, Wang S, Lee J, Lu SW, … Weiss S (2016). Backtracked and paused transcription initiation intermediate of Escherichia coli RNA polymerase. Proc Natl Acad Sci U S A, 113(43), E6562–E6571. 10.1073/pnas.1605038113 [DOI] [PMC free article] [PubMed] [Google Scholar]
- Marchetti M, Malinowska A, Heller I, & Wuite GJL (2017). How to switch the motor on: RNA polymerase initiation steps at the single-molecule level. Protein Sci, 26(7), 1303–1313. 10.1002/pro.3183 [DOI] [PMC free article] [PubMed] [Google Scholar]
- Mukhopadhyay J, Mekler V, Kortkhonjia E, Kapanidis AN, Ebright YW, & Ebright RH (2003). Fluorescence resonance energy transfer (FRET) in analysis of transcription-complex structure and function. Methods Enzymol, 371, 144–159. 10.1016/S0076-6879(03)71010-6 [DOI] [PubMed] [Google Scholar]
- Nickels BE (2012). A new way to start: nanoRNA-mediated priming of transcription initiation. Transcription, 3(6), 300–304. 10.4161/trns.21903 [DOI] [PMC free article] [PubMed] [Google Scholar]
- Paget MS (2015). Bacterial Sigma Factors and Anti-Sigma Factors: Structure, Function and Distribution. Biomolecules, 5(3), 1245–1265. 10.3390/biom5031245 [DOI] [PMC free article] [PubMed] [Google Scholar]
- Revyakin A, Liu C, Ebright RH, & Strick TR (2006). Abortive initiation and productive initiation by RNA polymerase involve DNA scrunching. Science, 314(5802), 1139–1143. 10.1126/science.1131398 [DOI] [PMC free article] [PubMed] [Google Scholar]
- Ruff EF, Record MT Jr., & Artsimovitch I (2015). Initial events in bacterial transcription initiation. Biomolecules, 5(2), 1035–1062. 10.3390/biom5021035 [DOI] [PMC free article] [PubMed] [Google Scholar]
- Vvedenskaya IO, Bird JG, Zhang Y, Zhang Y, Jiao X, Barvik I, … Nickels BE (2018). CapZyme-Seq Comprehensively Defines Promoter-Sequence Determinants for RNA 5' Capping with NAD+. Mol Cell, 70(3), 553–564 10.1016/j.molcel.2018.03.014 [DOI] [PMC free article] [PubMed] [Google Scholar]
- Vvedenskaya IO, Sharp JS, Goldman SR, Kanabar PN, Livny J, Dove SL, & Nickels BE (2012). Growth phase-dependent control of transcription start site selection and gene expression by nanoRNAs. Genes Dev, 26(13), 1498–1507. 10.1101/gad.192732.112 [DOI] [PMC free article] [PubMed] [Google Scholar]
- Vvedenskaya IO, Vahedian-Movahed H, Bird JG, Knoblauch JG, Goldman SR, Zhang Y, … Nickels BE (2014). Interactions between RNA polymerase and the “core recognition element” counteract pausing. Science, 344(6189), 1285–1289. 10.1126/science.1253458 [DOI] [PMC free article] [PubMed] [Google Scholar]
- Vvedenskaya IO, Vahedian-Movahed H, Zhang Y, Taylor DM, Ebright RH, & Nickels BE (2016). Interactions between RNA polymerase and the core recognition element are a determinant of transcription start site selection. Proc Natl Acad Sci U S A, 113(21), E2899–2905. 10.1073/pnas.1603271113 [DOI] [PMC free article] [PubMed] [Google Scholar]
- Vvedenskaya IO, Zhang Y, Goldman SR, Valenti A, Visone V, Taylor DM, … Nickels BE (2015). Massively Systematic Transcript End Readout, “MASTER”: Transcription Start Site Selection, Transcriptional Slippage, and Transcript Yields. Mol Cell, 60(6), 953–965. 10.1016/j.molcel.2015.10.029 [DOI] [PMC free article] [PubMed] [Google Scholar]
- Winkelman JT, Vvedenskaya IO, Zhang Y, Zhang Y, Bird JG, Taylor DM, … Nickels BE (2016). Multiplexed protein-DNA cross-linking: Scrunching in transcription start site selection. Science, 351(6277), 1090–1093. 10.1126/science.aad6881 [DOI] [PMC free article] [PubMed] [Google Scholar]
- Xiang S, Cooper-Morgan A, Jiao X, Kiledjian M, Manley JL, & Tong L (2009). Structure and function of the 5'-->3’ exoribonuclease Rat1 and its activating partner Rai1. Nature, 458(7239), 784–788. 10.1038/nature07731 [DOI] [PMC free article] [PubMed] [Google Scholar]