Abstract
Accurately determining pain levels in children is difficult, even for trained professionals and parents. Facial activity and electro- dermal activity (EDA) provide rich information about pain, and both have been used in automated pain detection. In this paper, we discuss preliminary steps towards fusing models trained on video and EDA features respectively. We compare fusion models using original video features and those using transferred video features which are less sensitive to environmental changes. We demonstrate the benefit of the fusion and the transferred video features with a special test case involving domain adaptation and improved performance relative to using EDA and video features alone.
Keywords: Automated Pain Detection, Domain Adaptation, EDA, Facial Action Units, GSR, FACS
1. Introduction
Accurate pain assessment in children is necessary for safe and efficacious pain management. Under-estimation can lead to patient suffering and inadequate care, while over-estimation can lead to overdosing of pain medication, which may predispose other issues, including opioid addiction [1]. The most widely used method of assessing clinical pain is patient self-report [2]. However, this method is subjective and vulnerable to social and self-presentation biases and requires substantial cognitive, linguistic, and social competencies [2]. Objective pain estimation is required for appropriate pain management in the clinical setting.
In previous work, features extracted from facial action units (AUs) and elec-trodermal activity (EDA) signals have both been used to automatically detect pain events using machine learning methods, and transfer learning techniques have been applied to environmentally sensitive features like facial AU features for domain adaptation tasks [3–6]. In this work, we design a machine learning model that utilizes both facial and EDA features to recognize pain. We trained a unimodal model using either facial or EDA features to give pain scores, and then trained another fusion model using scores from the two models. We also applied transfer learning [6] to transfer video features into a domain-robust space, and analyzed the fusion model using transferred video features combined with EDA features. We observed performance improvement in a domain adaptation task with the fusion method.
An earlier and shorter version of this work was presented at the Joint Workshop on Artificial Intelligence in Health and appears in the proceedings [7].
2. Methods
2.1. Participants
Forty-two pediatric research participants (30 males, 12 females) aged 13 [10, 15] (median [25%, 75%]) years and primarily Hispanic (79%) who had undergone medically necessary laparoscopic appendectomy were recruited for a study examining automated assessment of children’s post-operative pain using video and wearable biosensors. Children and their parents provided assent and parental consent prior to study evaluations [8].
2.2. Experimental Design and Data Collection
Data were collected over 3 visits (V): (V1) within 24 hours after appendectomy in hospital; (V2) in hospital one calendar day after V1; and (V3) a follow-up visit in an outpatient lab up to 42 days postoperatively. At each visit, videos (60 fps at 853 × 480 pixel resolution) of the participant’s face and EDA responses (using Affectiva Q sensor) were recorded while manual pressure was exerted at the surgical site for 10 seconds (equivalent of a clinical examination). During hospital visit (V1, V2) data collections, participants were lying in a hospital bed with the head of the bed raised. In V3, they were seated in a reclined chair. Participants rated their pain level using a 0–10 Numerical Rating Scale, where 0 = no pain and 10 = worst pain ever. Following convention for recognizing clinically significant pain [9], videos and EDA with ratings of 0–3 were labeled as no-pain, and videos and EDA with ratings of 4–10 were labeled as pain. We obtained 22 pain samples from V1, 8 pain and 8 no-pain samples from V2, and 22 no-pain samples from V3. The data distribution is illustrated in Figure 1.
Fig. 1.

Data distribution over three visits and two environmental domains.
2.3. Feature Extraction and Processing
Video Features:
Each 10-second video during pressure was processed with iMotions software which automatically estimates the log probabilities of 20 AUs (AU 1, 2, 4, 5, 6, 7, 9, 10, 12, 14, 15, 17, 18, 20, 23, 24, 25, 26, 28, 43) and 3 head pose indicators (yaw, pitch and roll) from each frame. We then applied 11 statistics (mean, max, min, standard deviation, 95th, 85th, 75th, 50th, 25th percentiles, half-rectified mean, and max-min) to each AU over all frames to obtain 11 × 23 features.
EDA Features:
EDA signals were trimmed to 30 seconds (10 seconds before, during, and after pressure was exerted at the surgical site respectively), smoothed by a 0.35 Hz FIR low pass filter, down-sampled to 1 Hz, and normalized with z-score normalization. We then applied timescale decomposition (TSD) with a standard deviation metric, and computed the mean, SD, and entropy of each row of each TSD to obtain a feature vector of length 90 [5].
Transferred Video Features:
In [6], we collected videos from 73 children over 3 visits and had a human expert code videos along with iMotions, and then used the data to learn a mapping from iMotions features to human features. The mapped iMotions features gained the domain robustness property of human features. In this paper, we processed video features through the learned model to get domain-robust transferred video features.
2.4. Machine Learning Models
Support Vector Machine (SVM):
A linear SVM was used to obtain a pain score as well as a pain prediction for each sample using transferred video features or video/EDA features after PCA. The number of principal components was chosen using cross-validation and the box constraint is set to 1. Inputs were normalized with z-score normalization over the full dataset as in [5].
Linear Discriminant Analysis (LDA):
LDA was used to differentiate between pain and no-pain using output pain scores from the SVMs. Inputs were either one single pain score from one SVM, or a fusion of pain scores from both SVMs.
Neural Networks:
Neural Networks with one hidden layer were used to map iMotions features to the human feature subspace. The number of hidden neurons was 506, twice the number of input features. Batch normalization and sigmoid activation were used for the hidden layer. The output layer used the linear activation function and mean squared error as the loss function.
2.5. Evaluation Metrics
Our primary objective was to classify pain in the hospital setting. For this reason we used V2 (in hospital pain vs no-pain) as test data.
We use classification accuracy to quantify performance of the model. Classification accuracy reflects the percentage of correctly classified trials for a given learned threshold. We also report sensitivity and specificity along with overall accuracy to indicate whether the model is better at detecting pain or no-pain. In order to measure how well the classifiers are able to separate pain and no-pain classes, we also use AUC (Area under the ROC- curve) which is insensitive to the classification threshold. It measures the area under the curve that plots hit rate vs false alarm rate as the threshold is moved over all possible values. An AUC of I reflects perfect separation and an AUC of 0.5 reflects no separation.
3. Results and Discussion
3.1. Performance Using Video/EDA Features
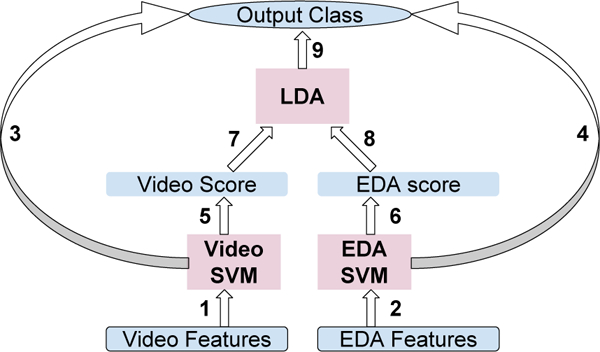
We first used VI pain and V3 no-pain samples to train an SVM for classification, following 1 => 3 and 2 => 4 in Figure 2. Table 1 shows that SVM performance on V2 was good for EDA (accuracy = 0.75), but suboptimal for video features (accuracy = 0.5). The AUC for video was 0.66, which is higher than random, implying that the model learned a function output, or score, that correlated with pain self-report scores, but failed to find an appropriate classification threshold.
Fig. 2.

Graph of Model Hierarchy.
Table 1.
Performance for Classi_cation on V2.
| Video | EDA | Video+EDA | Video-V2 | EDA-V2 | Video+EDA-V2 | |
|---|---|---|---|---|---|---|
| Acc | 0.5 | 0.75 | 0.56 | 0.69 | 0.71 | 0.84 |
| Sensitivity | 0.75 | 0.75 | 0.87 | 0.62 | 0.62 | 0.84 |
| Specificity | 0.25 | 0.75 | 0.25 | 0.75 | 0.80 | 0.83 |
| AUC | 0.66 | 0.80 | 0.88 | - | - | - |
In a separate experiment, we trained an SVM with VI pain and V3 no-pain data, and tested the model with VI pain and V3 no-pain data. The classification accuracy was 0.8 for video features, much higher than performance tested on V2 pain and no-pain. We hypothesize that the observed difference was due to iMotions feature sensitivity to environmental differences between Vl/2 (in hospital) and V3 (in outpatient lab). When training with VI pain and V3 no pain, the classifier learns the difference between the hospital environment of VI and outpatient lab environment of V3, but in testing, such difference no longer exists between the two classes in V2, so the classification fails. This problem has previously been discussed in [6].
One solution to this problem was to use V2 to train the model. However, with only 16 data points in V2, results had large variance. Likewise, training with V1/3 and V2 data together did not improve V2 performance. Consequently, we needed to solve the domain adaptation problem which learns a model from a source domain (V1/3) and applies it on a different target domain (V2).
3.2. Fusion of Video and EDA
We hoped to improve performance on V2 by combining video and EDA features. Our first simple attempt at fusion was to fit an LDA model to distinguish between pain v. no-pain using the output pain scores from each of the SVM models trained with video and EDA features respectively (1, 2 ⇒ 5, 6 ⇒ 7, 8 ⇒ 9 in Figure 2). However, this method performed poorly (accuracy = 0.56 under “Video+EDA” column in table 1) compared to using EDA features alone. Nevertheless, the AUC of this model was 0.88, higher than the AUCs of both video and EDA alone, showing potential for the fusion model. In the next section, we demonstrate a method that better adjusts the decision boundary of the fusion model to get a higher classification accuracy.
3.3. Training with V2 Scores
Through fusion, our LDA classifier involved only two inputs: video and EDA SVM pain scores. In such structure, the SVM models can be regarded as encoders or feature extractors. Since the dimensionality of features was greatly reduced by the SVM, it became feasible to train a classifier using only V2 samples. Relative to Figure 2, we thus trained 1,2 with V1/3, and 7,8 with V2 data using cross validation. The accuracy using video scores alone as LDA inputs was 0.69, much higher than 0.5, showing the benefit of training on target domain V2, even if the features, V2 scores, were obtained from a model trained on V1/3. Finally, with a fusion of SVM output scores for video and EDA, we achieved a comparative best accuracy of 0.84.
It should be noted that we performed leave-one-sample-out cross-validation on V2 samples in order to train and test both on V2, so AUCs were not measurable.
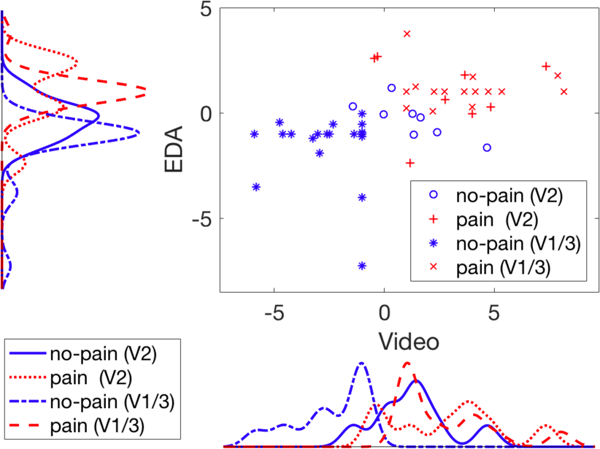
To better understand our problem, we plot EDA SVM output scores versus video SVM output scores in Figure 3 for data points from two domains (V1/3 and V2) and two classes (pain and no-pain). We also plot score distributions for EDA and video along corresponding axes. These scores were obtained by SVM trained on V1/3 domain. We can see that for both EDA and video features, pain and no-pain classes are well-separated on V1/3. However, for video features, no-pain on V2 drifts towards pain and will clearly be classified as pain if the threshold differentiating pain and no-pain on V1/3 is used. This supports our hypothesis that the video SVM model learned to classify “in hospital” versus “in outpatient lab” instead of pain versus no-pain during training with V1/3 data, so that V2 no-pain test data are classified by their “in hospital” properties.
Fig. 3.

Scatter plot and distributions for EDA and Video pain scores output by SVM models, grouped by data domain and class.
As we can see from the video score plot, if we adjust the classification threshold based on V2 pain scores, we obtain improved performance (Table 1 “Video-V2”). The scatter plot on the other hand explains why we should benefit from the fusion of EDA and video since the optimal decision boundary that partitions the two distributions is oblique, which means the decision model should weight both dimensions.
3.4. Transfer Learning for Video Features
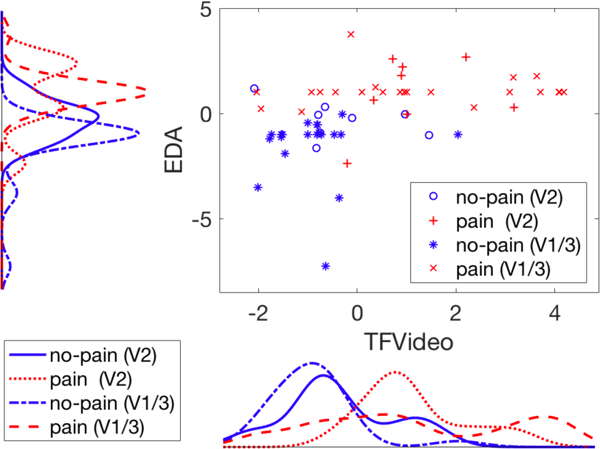
We introduced a transfer learning method in [6] to map automated video features to a subspace of manual pain-related video features which loses sensitivity to domain changes while keeping necessary information to recognize pain. We applied the same method to the video features in our experiment and show the results in Table 2 under “TF” (TF = transferred video feature). Accuracy using video features on target domain V2 improved from 0.5 to 0.81 with transfer learning when the SVM model was trained on source domain V1/3. Unlike original video features, in the plot of score distribution for transferred video features in Figure 4, no-pain (V2) is distributed similarly to no-pain (V1/3), showing the domain robustness of video features after transfer learning.
Table 2.
Performance for Classification on V2 (Transfer Learning).
| TF | EDA | TF+EDA | TF-V2 | EDA-V2 | TF+EDA-V2 | |
|---|---|---|---|---|---|---|
| Acc | 0.81 | 0.75 | 0.75 | 0.76 | 0.71 | 0.80 |
| Sensitivity | 0.87 | 0.75 | 0.87 | 0.77 | 0.62 | 0.81 |
| Specificity | 0.75 | 0.75 | 0.62 | 0.75 | 0.80 | 0.78 |
| AUC | 0.81 | 0.80 | 0.88 | - | - | - |
| TF-V123 | EDA-V123 | TF+EDA-V123 | ||||
| Acc | 0.81 | 0.73 | 0.86 | |||
| Sensitivity | 0.87 | 0.86 | 0.87 | |||
| Specificity | 0.75 | 0.59 | 0.84 | |||
| AUC | - | - | - |
Fig. 4.

Scatter plot and distributions for EDA and transferred video pain scores output by SVM models, grouped by data domain and class.
3.5. Fusion of Transferred Video and EDA
We then combined transferred video and EDA as we did in section 3.2, following 1, 2 ⇒ 5, 6 ⇒ 7, 8 ⇒ 9 in Figure 2 where we replaced video by transferred video. The accuracy is 0.75 under “TF+EDA”, no higher than using TF or EDA alone, but the AUC (0.88) beats both (Table 2).
In section 3.3 we retrained the LDA model on V2 to improve accuracy. Since transferred video features and EDA features are both invariant to domain changes, we did not have to exclude V3 during training. Instead we could leave one sample in V2 test data out at each iteration, use the remaining V2 samples and all V1/3 samples together for training, and produce a decision for each V2 sample. The accuracy of this fusion model was 0.86. To compare with Table 1, we also report accuracies training LDA with V2 in Table 2. The accuracies are slightly lower than training with V1–3 together, possibly due to decreased training sample size.
4. Conclusion
We present preliminary results using a fusion approach to automatically detect pain in children. While the results demonstrate improvement with our domain adaptation fusion methodology over approaches using video, transferred video, or EDA features alone, we believe these results can be further improved by tailoring the two modalities to be more sensitive to their relative benefits and limitations.
Acknowledgments
This work was supported by National Institutes of Health National Institute of Nursing Research grant R01 NR013500 and NSF IIS 1528214.
References
- 1.Quinn BL, Seibold E, and Hayman L. Pain assessment in children with special needs: A review of the literature. Exceptional Children, 82(1):44–57, 2015. [Google Scholar]
- 2.Zamzmi G, Pai C-Y, Goldgof D, Kasturi R, Sun Y, and Ashmeade T. Machine-based multimodal pain assessment tool for infants: a review. preprint arXiv:1607.00331, 2016. [Google Scholar]
- 3.Sikka K, Ahmed AA, Diaz D, Goodwin MS, Craig KD, Bartlett MS, and Huang JS. Automated assessment of children’s postoperative pain using computer vision. Pediatrics, 136(1):e124–e131, 2015. [DOI] [PMC free article] [PubMed] [Google Scholar]
- 4.Gruss S, Treister R, Werner P, Traue HC, Crawcour S, Andrade A, and Walter S. Pain intensity recognition rates via biopotential feature patterns with support vector machines. PloS one, 10(10):e0140330, 2015. [DOI] [PMC free article] [PubMed] [Google Scholar]
- 5.Susam BT, Akcakaya M, Nezamfar H, Diaz D, Xu X, de Sa VR, Craig KD, Huang JS, and Goodwin MS. Automated pain assessment using electrodermal activity data and machine learning (in press). In Engineering in Medicine and Biology Society (EMBC), 2018 40th Annual International Conference of the IEEE IEEE, 2018. [DOI] [PMC free article] [PubMed] [Google Scholar]
- 6.Xu X, Craig KD, Diaz D, Goodwin MS, Akcakaya M, Susam BT, Huang JS, and de Sa VR. Automated pain detection in facial videos of children using human-assisted transfer learning. In Joint Workshop on Artificial Intelligence in Health, pages 10–21. CEUR-WS, 2018. [PMC free article] [PubMed] [Google Scholar]
- 7.Xu X, Susam BT, Nezamfar H, Diaz D, Craig KD, Goodwin MS, Ak- cakaya M, Huang JS, and de Sa VR. Towards automated pain detection in children using facial and electrodermal activity. In Joint Workshop on AI in Health, pages 208–211. CEUR-WS, 2018. [PMC free article] [PubMed] [Google Scholar]
- 8.Hawley K, Huang JS, Goodwin M, Diaz D, de Sa VR, Birnie KA, Chambers CT, and Craig KD. Youth and parent appraisals of participation in a study of spontaneous and induced pediatric clinical pain. Ethics & Behavior, pages 1–15, 2018. [DOI] [PMC free article] [PubMed] [Google Scholar]
- 9.Hoffman D, Sadosky A, Dukes E, and Alvir J. How do changes in pain severity levels correspond to changes in health status and function in patients with painful diabetic peripheral neuropathy. Pain, 149(2):194–201, May 2010. [DOI] [PubMed] [Google Scholar]


