Abstract
Accurately determining pain levels in children is difficult, even for trained professionals and parents. Facial activity provides sensitive and specific information about pain, and computer vision algorithms have been developed to automatically detect Facial Action Units (AUs) defined by the Facial Action Coding System (FACS). Our prior work utilized information from computer vision, i.e., automatically detected facial AUs, to develop classifiers to distinguish between pain and no-pain conditions. However, application of pain/no-pain classifiers based on automated AU codings across different environmental domains results in diminished performance. In contrast, classifiers based on manually coded AUs demonstrate reduced environmentally-based variability in performance. In this paper, we train a machine learning model to recognize pain using AUs coded by a computer vision system embedded in a software package called iMotions. We also study the relationship between iMotions (automatically) and human (manually) coded AUs. We find that AUs coded automatically are different from those coded by a human trained in the FACS system, and that the human coder is less sensitive to environmental changes. To improve classification performance in the current work, we applied transfer learning by training another machine learning model to map automated AU codings to a subspace of manual AU codings to enable more robust pain recognition performance when only automatically coded AUs are available for the test data. With this transfer learning method, we improved the Area Under the ROC Curve (AUC) on independent data from new participants in our target domain from 0.67 to 0.72.
Keywords: automated pain detection, transfer learning, facial action units, FACS
1. Introduction
In the classic model of machine learning, scientists train models on a collected dataset to accurately predict a desired outcome and then apply learned models to new data measured under identical circumstances to validate performance. Given the notable variation in real world data, it is tempting to apply learned models to data collected under similar but non-identical circumstances. However, performance in such circumstances often deteriorates due to unmeasured factors not accounted for between the original and new datasets. Nevertheless, knowledge can be extracted in these scenarios. Transfer learning, or inductive transfer in machine learning parlance, focuses on using knowledge gained from solving one problem to improve performance on a different but related problem [1]. The present paper describes application of transfer learning to the important clinical problem of automated pain detection in children.
Accurate measurement of pain severity in children is difficult, even for trained professionals and parents. This is a critical problem as over-medication can result in adverse side-effects, including opioid addiction, and under-medication can lead to unnecessary suffering [2].
The current clinical gold standard and most widely employed method of assessing clinical pain is patient self-report [3]. However, this subjective method is vulnerable to self-presentation bias. Consequently, clinicians often distrust pain self-reports, and find them more useful for comparisons over time within individuals, rather than comparisons between individuals [4]. Further, infants, young children, and others with communication/neurological disabilities do not have the ability or capacity to self-report pain levels [3,5,6]. As a result, to evaluate pain in populations with communication limitations, observational tools based on nonverbal indicators associated with pain have been developed [7].
Of the various modalities of nonverbal expression (e.g., bodily movement, vocal qualities of speech), it has been suggested that facial activity provides the most sensitive, specific, and accessible information about the presence, nature, and severity of pain across the life span, from infancy [8] to advanced age [9]. Moreover, observers largely consider facial activity during painful events to be a relatively spontaneous reaction [7].
Evaluation of pain based on facial indicators requires two steps: (1) Extraction of facial pain features and (2) pain recognition based on these features. For step (1), researchers have searched for reliable facial indicators of pain, such as anatomically-based, objectively coded Facial Action Units (AUs) defined by the Facial Action Coding System (FACS) [10,11]. (Visualizations of facial activation units can also be found at https://imotions.com/blog/facial-action-coding-system/). However, identifying AUs traditionally requires time intensive offline coding by trained human coders, limiting application in real-time clinical settings. Recently, algorithms to automatically detect AUs [11] have been developed and implemented in software such as iMotions (imotions.com) allowing automatic output of AU probabilities in real-time based on direct recording of face video. In step (2), machine learning algorithms such as linear models [5], SVM [12], and Neural Networks [13] have been used to automatically recognize pain based on facial features.
Although a simple machine learning model based on features extracted by a well-designed algorithm can perform well when training and test data have similar statistical properties, problems arise when the data follow different distributions, as happens, for example, when videos are recorded in two different environments. We discovered this issue when training videos were recorded in an outpatient setting and test videos in the hospital. One way to deal with this problem is to use transfer learning, which discovers “common knowledge” across domains and uses this knowledge to complete tasks in a new domain with a model learned in the old domain [14]. In this work, we show that features extracted from human-coded (manual) AUs are less sensitive to domain changes than features extracted from iMotions (automated) AU codings, and thus develop a simple method that learns a projection from automated features onto a subspace of manual features. Once this mapping is learned, future automatically coded data can be transformed to a representation that is more robust between domains. In this work, we use a neural network model to learn a mapping from automated features to manual features, and another neural network model to recognize pain using the mapped facial features.
To summarize, our contributions of this work include demonstrating that:
Manually/automatically coded AUs can be used to successfully recognize clinical pain in videos with machine learning.
Environmental factors modulate the ability of automatically coded AUs to recognize clinical pain in videos.
Manually coded AUs (especially previously established “pain-related” ones) can be used to successfully recognize pain in videos with machine learning across different environmental domains.
Automatically coded AUs from iMotions do not directly represent or correlate with AUs defined in FACS.
Transfering automated features to the manual feature space improves automatic recognition of clinical pain across different environmental domains.
This work was presented at the Joint Workshop on Artificial Intelligence in Health and a shorter version of this paper appeared in the proceedings [15].
2. Methods
2.1. Participants
One hundred and forty-three pediatric research participants (94 males, 49 females) aged 12 [10, 15] (median [25%, 75%]) years old and primarily Hispanic (78%) who had undergone medically necessary laparoscopic appendectomy were videotaped for facial expressions during surgical recovery. Videos were subsequently categorized into two conditions: pain and no-pain. Participating children had been hospitalized following surgery for post-surgical recovery and were recruited for participation within 24 hours of surgery at a pediatric tertiary care center. Exclusion criteria included regular opioid use within the past six months, documented mental or neurological deficits preventing study protocol compliance, and any facial anomaly that might alter computer vision facial expression analysis. Parents provided written informed consent and youth gave written assent [16]. The local institutional review board approved the research protocol.
2.2. Experimental Design and Data Collection
Data were collected over three visits (V): V1 within 24 hours after appendectomy; V2 within the calendar day after the first visit; and V3 at a follow-up visit 25 [19, 28] (median [25%, 75%]) days postoperatively when pain was expected to have fully subsided. Data were collected in two environmental conditions: V1 and V2 in hospital and V3 in the outpatient setting. At every visit, two 10-second videos (60 frames per second at 853 × 480 pixel resolution) of the face were recorded while manual pressure was exerted at the surgical site for 10 seconds (equivalent of a clinical examination). During hospital visits (V1, V2), participants were lying in the hospital bed with the head of the bed raised. In the outpatient lab in V3, they were seated in a reclined chair. Participants rated their pain level during manual pressure using a 0–10 Numerical Rating Scale, where 0 = no-pain and 10 = worst pain ever. For classification purposes, and following convention used by clinicians for rating clinically significant pain [17], videos with pain ratings of 0–3 were labeled as no-pain, and videos with pain ratings of 4–10 were labeled as pain. Two hundred and fifty-one pain videos were collected from V1/2, 160 no-pain videos were collected from V1/2, and 187 no-pain videos were collected from V3. The numbers of samples collected for different pain levels and visits are shown in Table 1. Note that all V3 data are labeled as no-pain and there are only 4 pain ratings over 1 in V3. In contrast, the majority of no-pain data in V1 and V2 are ratings of 2 and 3. Figure 1 “All Data” demonstrates the distribution of pain and no-pain videos across environmental conditions.
Table 1:
Numbers of Samples at Different Pain Levels in Each Visit.
| Pain Level | 0 | 1 | 2 | 3 | 4 | 5 | 6 | 7 | 8 | 9 | 10 |
|---|---|---|---|---|---|---|---|---|---|---|---|
| V1 | 16 | 12 | 18 | 28 | 31 | 26 | 26 | 19 | 24 | 15 | 11 |
| V2 | 4 | 18 | 24 | 40 | 21 | 23 | 16 | 13 | 14 | 8 | 4 |
| V3 | 166 | 17 | 3 | 1 | 0 | 0 | 0 | 0 | 0 | 0 | 0 |
Fig. 1:
Data Domain Illustration. The area of category is not proportional to the number of samples.
2.3. Feature Extraction
For each 10-second video sample we extracted AU codings per frame to obtain a sequence of AUs. This was done both automatically by iMotions software (www.imotions.com) and manually by a FACS trained human in a limited subset. A second trained human independently coded a subset of the videos coded by the first human. We then extracted features from the sequence of AUs.
Automated Facial Action Unit Detection:
The iMotions software integrates Emotient’s FACET technology (www.imotions.com/emotient), formally known as CERT [18]. In the described work, iMotions software was used to process videos to automatically extract 20 AUs as listed in Figure 2 and three head pose indicators (yaw, pitch and roll) from each frame. The values of these codings represent estimated log probabilities of AUs, ranging from −4 to 4.
Fig. 2:
FACS names (descriptions) of 20 AUs coded by iMotions. AUs 1–7 and 43 are upper face AUs, and the others are lower face AUs.
Manual Facial Action Unit Detection:
A trained human FACS AU coder manually coded 64 AUs (AU1–64) for each frame of a subset (54%) of videos and labeled AU intensities (0–5, 0 = absence). In order to evaluate the reliability of the manual codings, we had another trained human coder code a subset (15%) of videos coded by the first human.
Feature Dimension Reduction:
The number of frames in our videos was too large to use full sequences of frame-coded AUs. To reduce dimensionality, we applied 11 statistics (mean, max, min, standard deviation, 95th, 85th, 75th, 50th, 25th percentiles, half-rectified mean, and max-min) to each AU over all frames as in [5] to obtain 11 × 23 features for automatically coded AUs, and 11×64 features for manually coded AUs. We call these automated features and manual features, respectively. The range of each feature was rescaled to [0,1] to normalize features over the training data.
2.4. Machine Learning Models
Neural Network Model to Recognize Pain with Extracted Features:
A neural network with one hidden layer was used to recognize pain with extracted automated or manual features. The number of neurons in the hidden layer was twice the number of neurons in the input layer, and the Sigmoid activation function σ(x) = 1/(1 + exp(−x)) was used with batch normalization for the hidden layer. The output layer used Softmax activation and cross-entropy error.
Neural Network Model to Predict Manual Features with Automated Features:
A neural network with the same structure was used to predict manual features from automated features, except that the output layer was linear and mean squared error was used as the loss function.
Model Training and Testing:
Experiments were conducted in a participant-based (each participant restricted to one fold) 10-fold cross-validation fashion. Participants were divided into 10 folds, and each time 1 fold was used as the test set, and the other 9 folds together were used as the training set. We balanced classes for each participant in each training set by randomly duplicating samples from the under-represented class. One out of nine participants in the training sets were picked randomly as a nested-validation set for early stopping in the neural network training. A batch size of 1/8 the size of training set was used.
We then examined the receiver operating characteristic curve (ROC curve) which plots True Positive Rate against False Positive Rate as the discrimination threshold varies. We used Area under the Curve (AUC) to evaluate classification performance. We considered data from three domains (D) as shown in Figure 1: (1) D1 with pain and no-pain both from V1/2 in hospital; (2) D2 with pain from V1/2 in hospital and no-pain from V3 from outpatient lab; and (3) All data, i.e., pain from V1/2 and no-pain from V1/2/3. The clinical goal was to be able to discriminate pain levels in the hospital; thus evaluation on D1 (where all samples were from the hospital bed) was the most clinically relevant evaluation.
3. Analysis and Discussion
Data from 73 participants labeled by both human and iMotions were used through section 3.1 to 3.5, and data from the remaining 70 participants using only automated (iMotions) AU codings were included for independent test set evaluation in the results section.
3.1. Automated Classifier Performance Varies by Environment
Using automated features, we first combined all visit data and trained a classifier to distinguish pain from no-pain. This classifier performed well in general (AUC= 0.77±0.011 on All data), but when we looked at different domains, the performance of D1 (the most clinically relevant in-hospital environment) was inferior to that on D2, as shown in data rows 1 and 4 under the “Automated” column in Table 2.
Table 2:
AUC for Classification with SEM (Standard Error of The Mean).
| Train on | Test on | Automated | Manual | Automated “Pain” Features | Manual “Pain” Features |
|---|---|---|---|---|---|
| All | D1 | 0.61 ± 0.006 | 0.66 ± 0.006 | 0.63 ± 0.007 | 0.69 ± 0.006 |
| D1 | D1 | 0.58 ± 0.014 | 0.62 ± 0.008 | 0.61 ± 0.008 | 0.65 ± 0.008 |
| D2 | D1 | 0.57 ± 0.005 | 0.67 ± 0.007 | 0.62 ± 0.004 | 0.7 ± 0.006 |
| All | D2 | 0.9 ± 0.005 | 0.79 ± 0.007 | 0.88 ± 0.005 | 0.8 ± 0.003 |
| D1 | D2 | 0.69 ± 0.011 | 0.68 ± 0.008 | 0.73 ± 0.012 | 0.73 ± 0.01 |
| D2 | D2 | 0.92 ± 0.01 | 0.79 ± 0.009 | 0.9 ± 0.007 | 0.8 ± 0.005 |
There were two main differences between D1 and D2, i.e., between V1/2 and V3 no-pain samples. The first was that in V1/2, participants still had some pain and their self-ratings were greater than 0, while in V3, no-pain ratings were usually 0 reflecting a “purer” no-pain signal. The second difference was that V1/2 occurred in the hospital with patients in beds and V3 videos were recorded in an outpatient setting with the participant sitting in a reclined chair. Lighting was also inherently different between hospital and outpatient environments. Since automated recognition of AUs is known to be sensitive to facial pose and lighting differences, we hypothesized that added discrepancy in classification performance between D1 and D2 was mainly due to the model classifying on environmental differences between V1/2 and V3. In other words, when trained and tested on D2, the classifier might distinguish “lying in hospital bed” vs “more upright in outpatient chair” as much as pain vs no-pain (this is similar to a computer vision algorithm doing well at recognizing cows by recognizing a green background).
In order to investigate this hypothesis and attempt to improve classification on the clinically relevant D1, we trained a classifier using only videos from D1. Within the “Automated” column, row 2 in Table 2 shows that performance on automated D1 classification does not drop much when D2 samples are removed from the training set. At the same time, training using only D2 data results in the worst classification on D1 (row 3), but the best classification on D2 (last row) as the network is able to exploit environmental differences (no-pain+more upright from V3, pain+lying-down from V1/2).
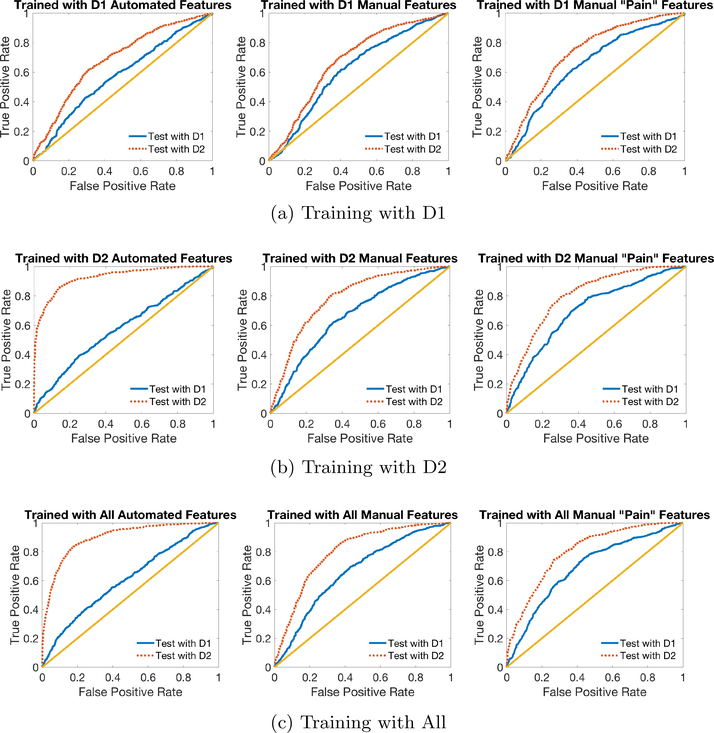
Figure 3 (b) (LEFT) shows ROC curves of within and across domain tests for models trained on automated features in D2. The dotted (red) curve corresponds to testing on D2 (within domain) and the solid (blue) curve corresponds to testing on D1 (across domain). The model performed well on within domain classification, but failed on across domain tasks.
Fig. 3:
ROC Curves for classification on D1 and D2 using automated features (left), manual features (middle) and pain-related manual features (right), when the model is trained on (a) D1, (b) D2 and (c) All data. The dotted (red) lines are ROCs when the machine is able to use environment information to differentiate pain and no-pain conditions, and the solid (blue) lines show the machine’s ability to discriminate between pain and no-pain based on AU information alone. The straight (yellow) line graphs the performance of random chance.
3.2. Classification Based on Manual AUs Are Less Sensitive to Environmental Changes
We also trained a classifier on manual AUs labeled by a human coder. Interestingly, results from the classifier trained on manual AUs showed less of a difference in AUCs between domains, with a higher AUC for D1 and a lower AUC for D2 relative to those with automated AUs (see Table 2 “Manual” and “Automated” columns). Overall, manual AUs appeared to be less sensitive to changes in the environment, reflecting the ability of human labelers to consistently code AUs without being affected by lighting and pose variations.
When we restricted training data from All to only D1 or only D2 data, classification performance using manual AUs went down, likely due to the reduction in training data, and training with D2 always gave better performance than training with D1 on both D1 and D2 test data, which should be the case since pain and no-pain samples in D2 are more discrepant in average pain rating. These results appear consistent with our hypothesis that human coding of AUs is not as sensitive as machine coding of AUs to environmental differences between V1/2 and V3.
Figure 3 (b) (MIDDLE) displays ROC curves for manual features. As discussed above, in contrast to the plot on the left for automated features, manual coding performance outperformed automated coding performance in the clinically relevant test in D1. The dotted (red) curve representing within-domain performance is only slightly higher than the solid (blue) curve, likely due in part to the quality difference in no-pain samples in V1/2 and V3, and also possibly any small amount of environmental information that the human labeler was affected by. Note that ignoring the correlated environmental information in D2 (i.e., pain faces were more reclined and no-pain faces were more upright) resulted in a lower numerical performance on D2 but does not likely reflect worse classification of pain but instead the failure to “cheat” by using features affected by pose angle to classify all upright faces as “no-pain.”
3.3. Restricting Manual AUs to Those Associated with Pain Improves Classification
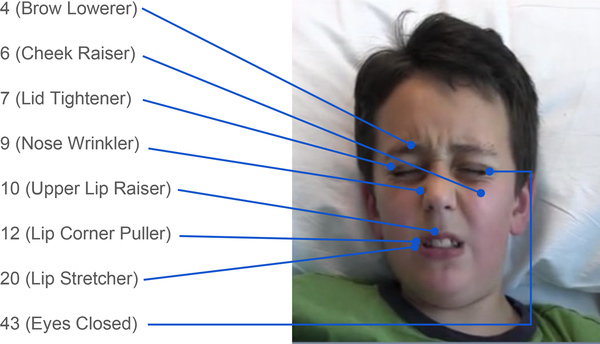
In an attempt to reduce the influence of environmental conditions to further improve performance on D1, we restricted the classifier to the eight AUs consistently associated with pain: 4 (Brow Lowerer), 6 (Cheek Raiser), 7 (Lid Tightener), 9 (Nose Wrinkler), 10 (Upper Lip Raiser), 12 (Lip Corner Puller), 20 (Lip Stretcher), and 43 (Eyes Closed) [19,20] as illustrated in Figure 4 to obtain 11 (statistics) ×8 (AUs) features. Pain prediction results using these “pain” features are shown in the last two columns in Table 2. Results show that using only pain-related AUs improved classification performance of manual features. However, it did not seem to help as much for automated features.
Fig. 4:
Illustration of eight “pain-related” facial AUs.
Similarly, Figure 3 (b) (RIGHT) shows that limiting manual features to use only pain-related AUs further improved D1 performance when training with D2. We also employed PCA on pain-related features and found that performance in the hospital domain was similar if using four or more principal components.
In Figure 3 (a) and (c) we show ROC curves similar to Figure 3 (b) except with different training data. These curves correspond to row 2 and 5 (a), or 1 and 4 (c), under “Automated,” “Manual,” and “Manual ‘Pain’ Features” in Table 2.
3.4. iMotions AUs Are Different Than Manual FACS AUs
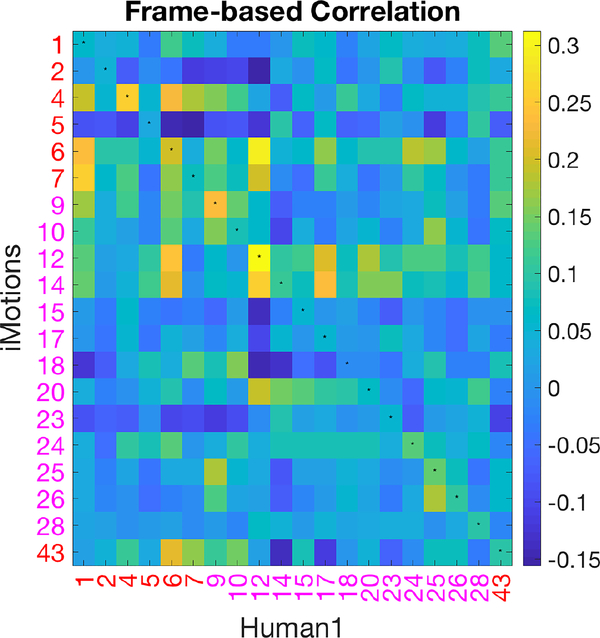
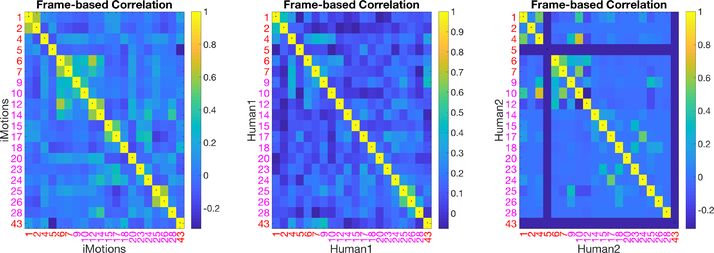
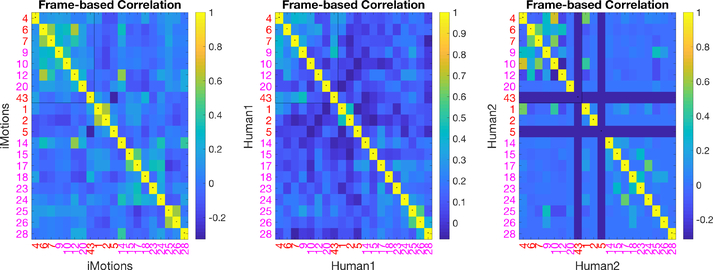
Computer Vision AU automatic detection algorithms have been programmed/trained on manual FACS data. However, we demonstrate differential performance of AUs encoded automatically versus manually. To understand the relationship between automatically encoded v. manually coded AUs, we computed correlations between binarized automatically coded AUs and manually coded AUs at the frame level as depicted in Figure 5. The FACS names corresponding to AU numbers are listed in Figure 2, in which AUs 1, 2, 4, 5, 6, 7, 43 are upper face AUs and all others are lower face AUs. If two sets of AUs were identical, the diagonal of the matrix (marked with small centered dots) should yield the highest correlations, which was not the case. For example, manual AU 6 was highly correlated with automated AU 12 and 14, but had relatively low correlation with automated AU 6.
Fig. 5:
Correlation matrix of AU pairs from automated and manual codings using All data.
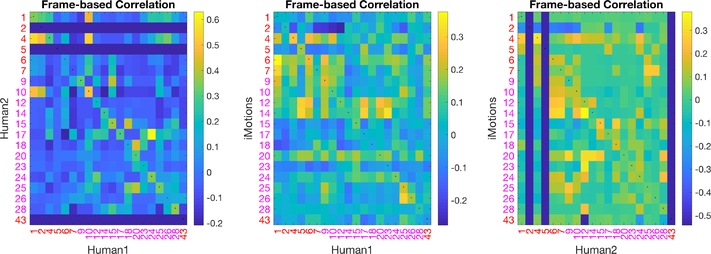
The correlation matrix shows that not only is our first human coder less affected by environmental changes, the AUs she coded are not in agreement with the automated AUs. Our second trained human coder (human 2) shows a better correlation with the coding of human 1 than between each human and iMotions, shown in Figure 6 (LEFT). The correlation between each of the humans and the software on the same subset is shown in Figure 6 (MIDDLE, RIGHT). This likely explains the reduced improvement by restricting the automated features model to “pain-related AUs” as these have been determined based on human FACS coded AUs.
Fig. 6:
Correlations of AU pairs from two of (1)iMotions; (2)human 1; and (3) human 2 on a subset of the data.
The self-correlation matrices between AUs in iMotions and the human coder are shown in Figure 7. AUs coded by iMotions show higher correlations (between different iMotions coded AUs) than AUs coded by humans. Some human AU codings were also correlated, which is expected since specific AUs often occur together (e.g., AU 1 and 2 for inner and outer brow raiser and AU 25 and 26 for lips part and jaw drop) and other AUs tend to occur together in pain. This latter correlation of pain AUs is more evident in Figure 4 which shows the same content as Figure 7 except that in Figure 4 the eight pain-related AUs are put together at the upper left corner to highlight their higher correlations. Interestingly, higher correlations within the pain AUs for iMotions coding was observed but the pattern is different.
Fig. 7:
Self-correlation Matrices of AU pairs from iMotions or humans.
3.5. Transfer Learning via Mapping to Manual Features Improves Performance
We have shown that manual codings are not as sensitive to domain change. However, manual coding of AUs is very time-consuming and not amenable to an automated real-time system. In an attempt to leverage manual coding to achieve similar robustness with automatic AUs, we utilized transfer learning and mapped automated features to the space of manual features. Specifically, we trained a neural network model to estimate manual features from automated features using data coded by both iMotions and a human. Separate models were trained to predict: manual features of 64 AUs, manual features of the eight pain-related AUs, and principal components (PCs) of the manual features of the eight pain-related AUs. PCA dimensionality reduction was used due to insufficient data for learning an accurate mapping from all automated AUs to all manual AUs.
Once the mapping network was trained, we used it to transform the automated features and trained a new network on these transformed data for pain/no-pain classification. The 10-fold cross-validation was done consistently so that the same training data was used to train the mapping network and the pain-classification network.
In Table 3, we show classification AUCs when the classification model was trained and tested with outputs from the prediction network. We observed that when using All data to train (which performed best), with the transfer learning prediction network, automated features performed much better in classification on D1 (0.68−0.69 compared to 0.61−0.63 in Table 2). Predicting four principal components of manual pain-related features yielded the best performance in our data. Overall, the prediction network helped in domain adaptation of a pain recognition model using automatically extracted AUs.
Table 3:
AUC (and SEM) with Transferred Automated Features.
| Train on | Test on | All Features | “Pain” Features | 7 PCs | 4 PCs | 1 PC |
|---|---|---|---|---|---|---|
| All | D1 | 0.61 ± 0.009 | 0.63 ± 0.009 | 0.68 ± 0.006 | 0.69 ± 0.008 | 0.65 ± 0.009 |
| D1 | D1 | 0.62 ± 0.009 | 0.64 ± 0.014 | 0.66 ± 0.012 | 0.67 ± 0.011 | 0.65 ± 0.009 |
| D2 | D1 | 0.58 ± 0.011 | 0.59 ± 0.01 | 0.66 ± 0.008 | 0.68 ± 0.006 | 0.66 ± 0.009 |
| All | D2 | 0.82 ± 0.009 | 0.82 ± 0.009 | 0.76 ± 0.009 | 0.75 ± 0.012 | 0.7 ± 0.01 |
| D1 | D2 | 0.69 ± 0.009 | 0.71 ± 0.013 | 0.7 ± 0.015 | 0.71 ± 0.015 | 0.69 ± 0.011 |
| D2 | D2 | 0.88 ± 0.011 | 0.86 ± 0.006 | 0.76 ± 0.013 | 0.74 ± 0.01 | 0.7 ± 0.009 |
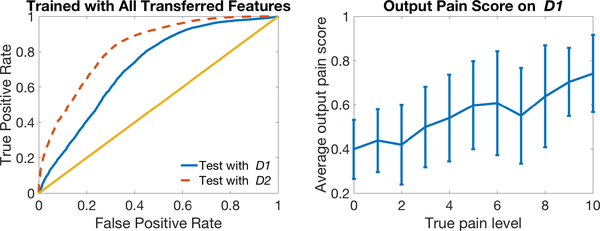
Figure 9 (LEFT) plots the ROC curves on two domains using the transfer learning classifier trained and tested using four predicted features. The model performed well in across-domain classification. Compared to Figure 3 (c) (LEFT), the transferred automated features showed properties more similar to manual features (Figure 3 (c) (RIGHT)), with smaller differences between performance on the two domains and higher AUC on the clinically relevant D1. Table 3 shows numerically how transfer learning helped automated features ignore environmental information in D2 like humans, and learn pure pain information that can be used in classification on D1.
Fig. 9:
ROC Curves for classification on two domains using our transfer learning model (left) and plot of average model output pain score (with error bars indicating standard deviation) over true pain level (right).
Within-domain classification performance for D1 was also improved with the prediction network. These results show that by mapping to the manual feature space, automated features can be promoted to perform better in pain classification.
Figure 9 (RIGHT) plots output pain scores of our model tested on D1 versus 0–10 self-reported pain levels. The model output pain score increases with true pain level, indicating that our model indeed reflects pain levels.
4. Results
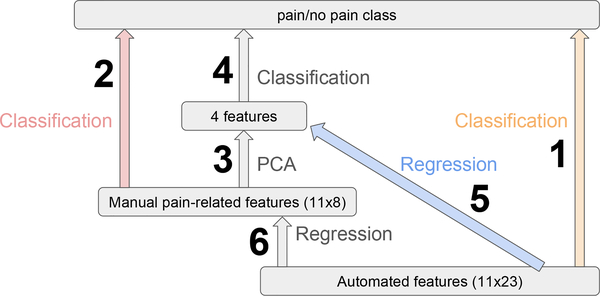
In the previous section we showed that in Figure 10 classification with pain-related pain features (2) performed better than automated features (1) on D1, which was the clinically relevant classification. We also found that applying PCA to manual features (3–4) does not change performance on D1 much. Thus, we introduced a transfer learning model to map automated features first to manual pain-related features (or the top few principal components of them), and then used the transferred features for classification (6–2 or 5–4). We obtained similar results to manual features on D1 with the transfer learning model (5–4) mapping to four principal components of manual features.
Fig. 10:
Illustration of Machine Learning Models. 1/2 are classifications using automated/manual pain features, in which 2 does better than 1. 3–4 can be done to reduce feature dimensions while maintaining performance. 6–2 and 5–4 are our transfer learning models, training a regression network to map automated features to a subspace of manual pain features before classification.
Table 2 shows that without our transfer learning method, training on all data and restricting to pain-related AUs results in the best performance using automated features for D1. And cross-validation results in Table 3 shows that with our method, using all data and predicting four PCs yielded the best performance for D1. With these optimal choices of model structure and training domain before and after transfer learning, we show the benefits of transfer learning in two experiments.
4.1. Test on New Subjects with Only iMotions AU Codings
In this section we report on the results from testing our transfer learning method on a new separate dataset (new participants), which contained only automated features. We trained two models, with and without transfer learning, using all the data in section 3 labeled by both iMotions and humans, and tested the model on this new dataset only labeled by iMotions D1, D2. (We use italicized domain names to indicate that this is independent test data D1, D2.) Our model with transfer learning (AUC= 0.72 ± 0.002) performed better than the model without it (AUC= 0.67±0.002) on D1 with a p-value= 1.33e−45 in a one-tailed two-sample t-test.
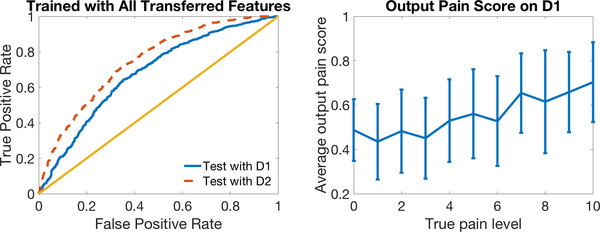
Similar to Figure 9, in Figure 11 we plot ROC curves for classification on the NEW test dataset (LEFT) and output pain scores at 0–10 pain levels (RIGHT) using our transfer learning model.
Fig. 11:
ROC Curves for classification on NEW test domains D1 and D2 using our transfer learning model (left) and plot of average model output pain score (with error bars indicating standard deviation) over true pain level (right).
In Figure 12, we show a scatter plot of neural network output pain scores using transferred automated features versus those using original automated features, as well as pain score distributions, separately for training (All Data from section 3) and test (D1 from NEW test data in the current section), pain and no-pain. We can see for original automated features scores, no-pain samples from D1 are distributed very differently from no-pain in All data domain used for training and fall mostly in the range of the pain class. Results using transfer learning do not appear to have this problem.
Fig. 12:
Scatter plot and distributions of pain scores (transfer learning vs original) using original iMotions features (on the x-axis) and transferred iMotions features (on the y-axis).
4.2. Test with Masked Pain and Faked Pain
As another test of the effect of our transfer learning model, we looked at results of classifying whether participants are in pain or not from videos where children were asked to fake pain when they were not really in pain as well as when they were asked to suppress visual expressions of pain when they were in pain.
Although facial expressions convey rich and objective information about pain, they can be deceptive because people can inhibit or exaggerate their pain displays when under observation [21]. It has been shown that human observers discriminate real expressions of pain from faked expressions only marginally better than chance [21,22]. Children can also be very good at suppressing pain, but not fully successful in faking expressions of pain [23]. In this section we discuss performance of masked and faked pain in machine learning models trained to distinguish genuine pain and no-pain.
In addition to the data described in section 2.2, we recorded videos of “masked pain” in V1 and V2 by asking participants to suppress pain during the 10-second manual pressure, and videos of “faked pain” during V3 by asking participants to fake the worst pain ever during manual pressure. As in section 2.2, we asked participants to rate their true pain level during manual pressure with a number from 0 to 10. We then labeled masked-pain videos with pain ratings of 4–10 as masked-pain and faked-pain videos with pain ratings of 0–3 as faked-pain, and discarded other samples. This ensured that in masked-pain videos participants actually experienced pain and in faked-pain videos participants in fact felt no pain. One hundred and seventeen masked-pain samples and 116 faked-pain samples were collected. The distribution of the four classes within the three visits is shown in Figure 13.
Fig. 13:
Distribution of four classes in three visits. The area of category is not proportional to the number of samples.
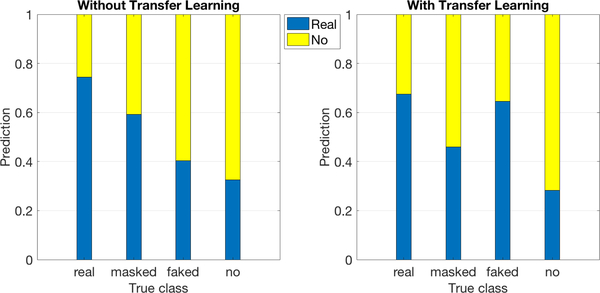
Using the best models before and after transfer learning trained to distinguish between genuine pain and no-pain described above, the masked and faked pain samples were processed to obtain pain labels. The results are shown in Figure 14. We can see that without transfer learning (LEFT), most masked-pain data were classified as real-pain and most faked-pain as no-pain. This appeared to be the case because the AU features coded automatically were sensitive to environmental factors, and during training the machine learned to discriminate between genuine pain and no-pain by recognizing environmental differences between them. At test time, since masked-pain is in the same environmental domain as real-pain and faked-pain is in the similar environment as no-pain, they are assigned to the corresponding classes. In contrast, with transfer learning (Figure 14 (RIGHT)), masked-pain was mostly classified as no-pain and faked-pain as real-pain. This might be because automated features were transferred to ignore the difference between the two classes caused by environmental change, and the machine can only use differences in facial actions to complete the classification task. Humans’ attempts to mask pain are to mimic no-pain faces and, similarly, humans’ attempts to fake pain are to mimic pain faces. The machine in this way classifies pain and no-pain according to expressed facial actions.
Fig. 14:
Bar graph showing classification of real-pain, masked-pain, faked-pain and no-pain. The area of bars shows the distribution of predicting pain and no-pain.
5. Conclusion
In the present work we recognized differences in classifier model performance (pain vs no-pain) across domains that reflect environmental differences as well as differences reflecting how the data were encoded (automatically v. manually). We demonstrate that manually coded facial features are more robust than automatically coded facial features to environmental changes which allow us to obtain the best performance on our target data domain. We then introduced a transfer learning model to map automated features first to manual pain-related features (or principal components of them), and then used the transferred features for classification (6–2 or 5–4 in Figure 10). This allowed us to leverage data from another domain to improve classifier performance on the clinically relevant task of automatically distinguishing pain levels in the hospital. Further, we were able to demonstrate improved classifier performance on a separate, new data set.
6. Future Work
Planned future work:
Classification of real-pain, masked-pain, faked-pain, and no-pain using machine learning, and comparison to human judgments.
Classification of genuine expression and non-genuine expression using machine learning, and comparison to human judgments.
Using transfer learning to improve fusion analysis of video features and peripheral physiological features in [24].
Multidimensional pain assessment such as pain catastrophizing and anxiety based on facial activities.
Fig. 8:
Self-correlation Matrices of AU pairs from iMotions or humans with “pain” AUs arranged together at the top left corner.
Acknowledgments
This work was supported by National Institutes of Health National Institute of Nursing Research grant R01 NR013500, NSF IIS 1528214, and by IBM Research AI through the AI Horizons Network. Many thanks to Ryley Unrau for manual FACS coding and Karan Sikka for sharing his code and ideas used in [5].
References
- 1.West Jeremy, Ventura Dan, and Warnick Sean. Spring research presentation: A theoretical foundation for inductive transfer. Brigham Young University, College of Physical and Mathematical Sciences, 1, 2007. [Google Scholar]
- 2.Quinn Brenna L, Seibold Esther, and Hayman Laura. Pain assessment in children with special needs: A review of the literature. Exceptional Children, 82(1):44–57, 2015. [Google Scholar]
- 3.Zamzmi Ghada, Pai Chih-Yun, Goldgof Dmitry, Kasturi Rangachar, Sun Yu, and Ashmeade Terri. Machine-based multimodal pain assessment tool for infants: a review. preprint arXiv:1607.00331, 2016. [Google Scholar]
- 4.Von Baeyer Carl L. Children’s self-report of pain intensity: what we know, where we are headed. Pain Research and Management, 14(1):39–45, 2009. [DOI] [PMC free article] [PubMed] [Google Scholar]
- 5.Sikka Karan, Ahmed Alex A, Diaz Damaris, Goodwin Matthew S, Craig Kenneth D, Bartlett Marian S, and Huang Jeannie S. Automated assessment of children’s postoperative pain using computer vision. Pediatrics, 136(1):e124–e131, 2015. [DOI] [PMC free article] [PubMed] [Google Scholar]
- 6.Aung Min SH, Kaltwang Sebastian, Romera-Paredes Bernardino, Martinez Brais, Singh Aneesha, Cella Matteo, Valstar Michel, Meng Hongying, Kemp Andrew, Shafizadeh Moshen, et al. The automatic detection of chronic pain-related expression: requirements, challenges and the multimodal emopain dataset. IEEE transactions on affective computing, 7(4):435–451, 2016. [DOI] [PMC free article] [PubMed] [Google Scholar]
- 7.Sekhon Kamal Kaur, Fashler Samantha R, Versloot Judith, Lee Spencer, and Craig Kenneth D. Children’s behavioral pain cues: Implicit automaticity and control dimensions in observational measures. Pain Res Manag., 2017. [DOI] [PMC free article] [PubMed] [Google Scholar]
- 8.Grunau Ruth VE and Craig Kenneth D. Pain expression in neonates: facial action and cry. Pain, 28(3):395–410, 1987. [DOI] [PubMed] [Google Scholar]
- 9.Hadjistavropoulos Thomas, Herr Keela, Prkachin Kenneth M, Craig Kenneth D, Gibson Stephen J, Lukas Albert, and Smith Jonathan H. Pain assessment in elderly adults with dementia. The Lancet Neurology, 13(12):1216–1227, 2014. [DOI] [PubMed] [Google Scholar]
- 10.Ekman Paul and Friesen Wallace V. Measuring facial movement. Environmental psychology and nonverbal behavior, 1(1):56–75, 1976. [Google Scholar]
- 11.Martinez Brais, Valstar Michel F, Jiang Bihan, and Pantic Maja. Automatic analysis of facial actions: A survey. IEEE Trans on Affective Computing, 2017. [Google Scholar]
- 12.Ashraf Ahmed Bilal, Lucey Simon, Cohn Jeffrey F, Chen Tsuhan, Ambadar Zara, Prkachin Kenneth M, and Solomon Patricia E. The painful face–pain expression recognition using active appearance models. Image and vision computing, 27(12):1788–1796, 2009. [DOI] [PMC free article] [PubMed] [Google Scholar]
- 13.Monwar Md Maruf and Rezaei Siamak. Pain recognition using artificial neural network In Signal Processing and Information Technology, 2006 IEEE International Symposium on, pages 28–33. IEEE, 2006. [Google Scholar]
- 14.Pan Sinno J. and Yang Qiang. A survey on transfer learning. IEEE Trans on knowledge and data engineering, 22(10):1345–1359, 2010. [Google Scholar]
- 15.Xu Xiaojing, Craig Kenneth D., Diaz Damaris, Goodwin Matthew S., Akcakaya Murat, Susam Büşra Tuğçe, Huang Jeannie S., and de Sa Virginia R. Automated pain detection in facial videos of children using human-assisted transfer learning In Joint Workshop on Artificial Intelligence in Health, pages 10–21. CEUR-WS, 2018. [PMC free article] [PubMed] [Google Scholar]
- 16.Hawley Kara, Huang Jeannie S., Goodwin Matthew, Diaz Damaris, de Sa Virginia R., Birnie Kathryn A., Chambers Christine T., and Craig Kenneth D. Youth and parent appraisals of participation in a study of spontaneous and induced pediatric clinical pain. Ethics & Behavior, pages 1–15, 2018. [DOI] [PMC free article] [PubMed] [Google Scholar]
- 17.Hoffman DL, Sadosky A, Dukes EM, and Alvir J How do changes in pain severity levels correspond to changes in health status and function in patients with painful diabetic peripheral neuropathy. Pain, 149(2):194–201, May 2010. [DOI] [PubMed] [Google Scholar]
- 18.Littlewort Gwen, Whitehill Jacob, Wu Tingfan, Fasel Ian, Frank Mark, Movellan Javier, and Bartlett Marian. The computer expression recognition toolbox (cert). In Automatic Face & Gesture Recognition and Workshops (FG 2011), 2011 IEEE International Conference on, pages 298–305. IEEE, 2011. [Google Scholar]
- 19.Prkachin Kenneth M. The consistency of facial expressions of pain: a comparison across modalities. Pain, 51(3):297–306, 1992. [DOI] [PubMed] [Google Scholar]
- 20.Prkachin Kenneth M. Assessing pain by facial expression: facial expression as nexus. Pain Res Manag., 14(1):53–58, 2009. [DOI] [PMC free article] [PubMed] [Google Scholar]
- 21.Hill Marilyn L and Craig Kenneth D. Detecting deception in facial expressions of pain: accuracy and training. The Clinical journal of pain, 20(6):415–422, 2004. [DOI] [PubMed] [Google Scholar]
- 22.Bartlett Marian Stewart, Littlewort Gwen C, Frank Mark G, and Lee Kang. Automatic decoding of facial movements reveals deceptive pain expressions. Current Biology, 24(7):738–743, 2014. [DOI] [PMC free article] [PubMed] [Google Scholar]
- 23.Larochette Anne-Claire, Chambers Christine T, and Craig Kenneth D. Genuine, suppressed and faked facial expressions of pain in children. Pain, 126(1–3):64–71, 2006. [DOI] [PubMed] [Google Scholar]
- 24.Xu Xiaojing, Susam Büsra Tugçe, Nezamfar Hooman, Diaz Damaris, Craig Kenneth D, Goodwin Matthew S, Akcakaya Murat, Huang Jeannie S, and de Sa Virginia R. Towards automated pain detection in children using facial and electrodermal activity In Joint Workshop on AI in Health, pages 208–211. CEUR-WS, 2018. [PMC free article] [PubMed] [Google Scholar]


