

Abstract
Background
Hepatic encephalopathy is a common and devastating neuropsychiatric complication of acute liver failure or chronic liver disease. Ammonia content in the blood seems to play a role in the development of hepatic encephalopathy. Treatment for hepatic encephalopathy is complex. Acetyl‐L‐carnitine is a substance that may reduce ammonia toxicity. This review assessed the benefits and harms of acetyl‐L‐carnitine for patients with hepatic encephalopathy.
Objectives
To assess the benefits and harms of acetyl‐L‐carnitine for patients with hepatic encephalopathy.
Search methods
We searched the Cochrane Hepato‐Biliary Group Controlled Trials Register, CENTRAL, MEDLINE Ovid, Embase Ovid, LILACS, and Science Citation Index Expanded for randomised clinical trials. We sought additional randomised clinical trials from the World Health Organization Clinical Trials Search Portal and ClinicalTrials.gov. We performed all electronic searches until 10 September 2018. We looked through the reference lists of retrieved publications and review articles, and we searched the FDA and EMA websites.
Selection criteria
We searched for randomised clinical trials in any setting, recruiting people with hepatic encephalopathy. Trials were eligible for inclusion if they compared acetyl‐L‐carnitine plus standard care (e.g. antibiotics, lactulose) versus placebo or no acetyl‐L‐carnitine plus standard care. We are well aware that by selecting randomised clinical trials, we placed greater focus on potential benefits than on potential harms.
Data collection and analysis
We selected randomised clinical trials, assessed risk of bias in eight domains, and extracted data in a duplicate and independent fashion. We estimated risk ratios (RRs) for dichotomous outcomes and mean differences (MDs) for continuous outcomes. We measured statistical heterogeneity using I² and D² statistics. We subjected our analyses to fixed‐effect and random‐effects model meta‐analyses. We assessed bias risk domains to control systematic errors. We assessed overall quality of the data for each individual outcome by using the GRADE approach.
Main results
We identified five randomised clinical trials involving 398 participants. All trials included only participants with cirrhosis as the underlying cause of hepatic encephalopathy. Trials included participants with covert or overt hepatic encephalopathy. All trials were conducted in Italy by a single team and assessed acetyl‐L‐carnitine compared with placebo. Oral intervention was the most frequent route of administration. All trials were at high risk of bias and were underpowered. None of the trials were sponsored by the pharmaceutical industry.
None of the identified trials reported information on all‐cause mortality, serious adverse events, or days of hospitalisation. Only one trial assessed quality of life using the Short Form (SF)‐36 scale (67 participants; very low‐quality evidence). The effects of acetyl‐L‐carnitine compared with placebo on general health at 90 days are uncertain (MD ‐6.20 points, 95% confidence interval (CI) ‐9.51 to ‐2.89). Results for additional domains of the SF‐36 are also uncertain. One trial assessed fatigue using the Wessely and Powell test (121 participants; very low‐quality evidence). The effects are uncertain in people with moderate‐grade hepatic encephalopathy (mental fatigue: MD 0.40 points, 95% CI ‐0.21 to 1.01; physical fatigue: MD ‐0.20 points, 95% CI ‐0.92 to 0.52) and mild‐grade hepatic encephalopathy (mental fatigue: ‐0.80 points, 95% CI ‐1.48 to ‐0.12; physical fatigue: 0.20 points, 95% CI ‐0.72 to 1.12). Meta‐analysis showed a reduction in blood ammonium levels favouring acetyl‐L‐carnitine versus placebo (MD ‐13.06 mg/dL, 95% CI ‐17.24 to ‐8.99; 387 participants; 5 trials; very low‐quality evidence). It is unclear whether acetyl‐L‐carnitine versus placebo increases the risk of non‐serious adverse events (8/126 (6.34%) vs 3/120 (2.50%); RR 2.51, 95% CI 0.68 to 9.22; 2 trials; very low‐quality evidence). Overall, adverse events data were poorly reported and harms may have been underestimated.
Authors' conclusions
This Cochrane systematic review analysed a heterogeneous group of five trials at high risk of bias and with high risk of random errors conducted by only one research team. We assessed acetyl‐L‐carnitine versus placebo in participants with cirrhosis with covert or overt hepatic encephalopathy. Hence, we have no data on the drug for hepatic encephalopathy in acute liver failure. We found no information about all‐cause mortality, serious adverse events, or days of hospitalisation. We found no clear differences in effect between acetyl‐L‐carnitine and placebo regarding quality of life, fatigue, and non‐serious adverse events. Acetyl‐L‐carnitine reduces blood ammonium levels compared with placebo. We rated all evidence as of very low quality due to pitfalls in design and execution, inconsistency, small sample sizes, and very few events. The harms profile for acetyl‐L‐carnitine is presently unclear. Accordingly, we need further randomised clinical trials to assess acetyl‐L‐carnitine versus placebo conducted according to the SPIRIT statements and reported according to the CONSORT statements.
Plain language summary
Acetyl‐L‐carnitine for patients with hepatic encephalopathy
What is hepatic encephalopathy? Hepatic encephalopathy is a common and devastating neuropsychiatric complication of acute liver failure or chronic liver disease. The liver in people with hepatic encephalopathy cannot clear the portal venous blood (the big pipeline that leads blood from the small intestine into the liver). Due to this, blood ammonium levels and levels of other toxic substances are increased, which leads to brain damage. Hepatic encephalopathy is associated with significantly increased mortality among patients with liver disease, including those awaiting liver transplantation.
What is acetyl‐L‐carnitine? Acetyl‐L‐carnitine is a substance that reduces blood and brain ammonium levels and may act as a brain‐protective agent.
The purpose of this review This Cochrane systematic review assessed the benefits and harms of treating people with hepatic encephalopathy with acetyl‐L‐carnitine in addition to providing standard care (lactulose, antibiotics, etc.) compared with placebo or no acetyl‐L‐carnitine intervention in addition to standard care.
Findings of this review Review authors searched the medical literature up to 10 September 2018, and identified five relevant randomised clinical trials, including a total of 398 participants. All trials were performed in Italy by only one team of investigators. All were considered at high risk of bias and included small numbers of participants, which makes potential overestimation of benefits and underestimation of harms likely. The pharmaceutical industry did not sponsor any trial. Trials tested acetyl‐L‐carnitine given orally or intravenously versus placebo. The drug did not seem to have effects on quality of life, fatigue, or non‐serious adverse events when compared with placebo (inactive sham drug).
Shortcomings of the trials included in this review None of the included trials reported data on participants’ all‐cause mortality, serious adverse events, or days of hospitalisation. Researchers poorly reported harms caused by acetyl‐L‐carnitine, so the harms profile remains unclear. Risks of bias, imprecision, and outcome reporting bias all make the certainty of evidence low or very low. A reduction in blood ammonium levels favoured participants receiving acetyl‐L‐carnitine, but study authors observed no clinical benefits.
It is clear that additional randomised clinical trials are required to assess the benefits and harms of acetyl‐L‐carnitine compared with placebo in the treatment of people with hepatic encephalopathy. These trials should be well designed, conducted by independent researchers, and collaborative, and should include large numbers of participants.
Summary of findings
Summary of findings for the main comparison. Acetyl‐L‐carnitine compared with placebo for patients with hepatic encephalopathy.
| Acetyl‐L‐carnitine compared with placebo for patients with hepatic encephalopathy | ||||||
| Patient or population: patients with covert or overt hepatic encephalopathy Settings: inpatient or outpatient Intervention: acetyl‐L‐carnitine Comparison: placebo | ||||||
| Outcomes | Illustrative comparative risks* (95% CI) | Relative effect (95% CI) | No. of participants (studies) | Quality of the evidence (GRADE) | Comments | |
| Assumed risk | Corresponding risk | |||||
| Placebo | Acetyl‐L‐carnitine | |||||
| All‐cause mortality | See comment | See comment | Not estimable | 0 (0 trials) | See comment | No trial reported this outcome |
| Quality of life (general health at 90 days) SF‐36 scale Scale from 0 to 100 Follow‐up: 90 days | Mean quality of life in the control groups was 67.1 points | Mean quality of life in the intervention groups was 6.20 lower (9.51 to 2.89 lower)a | ‐ | 67 (1 trialb) | ⊕⊝⊝⊝ very lowc,d |
|
| Serious adverse events | See comment | See comment | Not estimable | 0 (0 trials) | See comment | No trial reported this outcome |
|
Fatigue
Mental fatigue in moderate‐grade hepatic encephalopathy
Wessely and Powell test Scale from 0 to 10 Follow‐up: 90 days Physical fatigue Wessely and Powell test from 0 (no fatigue) to 16 (highest possible fatigue) |
Mean mental fatigue in the control groups was 5.8 points | Mean fatigue in the intervention groups was 0.40 higher (0.21 lower to 1.01 higher) | ‐ | 121 (1 triale) | ⊕⊝⊝⊝ very lowc,d |
MD was assessed with fixed‐effect or random‐effects models |
| Non‐serious adverse events Follow‐up: 90 days | 25 per 1000f | 63 per 1000 (17 to 231) | RR 2.51 (0.68 to 9.22) | 246 (2 trialsb,e) | ⊕⊝⊝⊝ very lowg,h | |
| Days of hospitalisation | See comment | See comment | Not estimable | 0 (0 trials) | See comment | No trial reported this outcome |
| Blood ammonium levels Follow‐up: 90 days | Mean blood ammonium levels in the control groups was 7.6 mg/dL | Mean blood ammonium levels in the intervention groups was 13.06 lower (17.24 to 8.99 lower) | ‐ | 387 (5 trialsb,e) | ⊕⊕⊝⊝ lowg,i | |
| *The basis for the assumed risk (e.g. the median control group risk across studies) is provided in footnotes. The corresponding risk (and its 95% confidence interval) is based on the assumed risk in the comparison group and the relative effect of the intervention (and its 95% CI). CI: confidence interval; MD: mean difference; RR: risk ratio; SF‐36: Short Form‐36. | ||||||
| GRADE Working Group grades of evidence. High quality: further research is very unlikely to change our confidence in the estimate of effect. Moderate quality: further research is likely to have an important impact on our confidence in the estimate of effect and may change the estimate. Low quality: further research is very likely to have an important impact on our confidence in the estimate of effect and is likely to change the estimate. Very low quality: we are very uncertain about the estimate. | ||||||
aFor mental health domain. bCovert hepatic encephalopathy. cDowngraded one level for limitations in design and execution: trial assessing this outcome has high risk for allocation and confusion biases. dDowngraded two levels for imprecision: small sample size leading to wide confidence intervals. eOvert hepatic encephalopathy. fAssumed risk is based on risks for the control group in the meta‐analysis (2.6%). gDowngraded one level for limitations in design and execution: both trials assessing this outcome have high risk for allocation and confusion biases. We did not downgrade quality rating for risk of bias due to missing data because results show robustness to each of the imputation strategies. See Analysis 1.3 and Analysis 1.6. hDowngraded two levels for imprecision: small sample size and very low rate of adverse events leading to wide confidence intervals. iDowngraded one level for inconsistency: 59% with fixed‐effect or random‐effects model.
Background
Description of the condition
Hepatic encephalopathy is a common and devastating neuropsychiatric complication of acute liver failure or chronic liver disease (McPhail 2010; Felipo 2013; Rahimi 2013; Nusrat 2014). Hepatic encephalopathy can be categorised into three broad groups: type A, which occurs in acute liver failure; type B, which occurs with portosystemic bypass and no intrinsic hepatocellular disease; and the most commonly recognised form, type C, which occurs with chronic liver disease (Frederick 2011; Perazzo 2012; Felipo 2013; Romero‐Gomez 2014).
The spectrum of symptoms extends from a subclinical syndrome that may not be clinically apparent (early‐stage, or 'minimal' or covert hepatic encephalopathy) to full‐blown neuropsychiatric manifestations such as cognitive impairment, confusion, slow speech, loss of fine motor skills, asterixis, peripheral neuropathy, clonus, positive Babinski sign, decerebrate and decorticate posturing, seizures, extrapyramidal symptoms, and coma, in a condition known as overt hepatic encephalopathy (Frederick 2011; Perazzo 2012; Felipo 2013; Patidar 2015; De Rui 2016; Nardone 2016; Shawcross 2016). Mental state in patients with this liver complication can be assessed via the West Haven criteria (Shores 2008). See Appendix 1 for details of these criteria.
The severity of underlying liver insufficiency and the presence or absence of a portal systemic shunt determine the prevalence or incidence of hepatic encephalopathy (Vilstrup 2014). See Appendix 2 for details of the epidemiological data.
Hepatic encephalopathy arises when the liver cannot detoxify portal venous blood (Wakim‐Fleming 2011). The pathogenesis of hepatic encephalopathy is multi‐factorial (Frederick 2011; Wakim‐Fleming 2011; Felipo 2013; Sturgeon 2014). Many hypotheses have suggested how hepatic encephalopathy develops. Ammonia is the molecular key of multiple neurotoxins and inflammatory mediators, and it has been implicated in the pathogenesis of hepatic encephalopathy (Munoz 2008; Sundaram 2009; Frederick 2011; Perazzo 2012; Felipo 2013). Accumulation of ammonia from the gut and other sources due to impaired hepatic clearance or portosystemic shunting can lead to accumulation of glutamine in brain astrocytes, which results in swelling (Liou 2014). Several precipitating factors of hepatic encephalopathy have been described, such as acidosis, alkalosis, constipation, diuretic use, dehydration, gastrointestinal bleeding, hyponatraemia, infection, protein excess, renal decompensation, sedative use, and trauma (Wakim‐Fleming 2011). Hepatic encephalopathy is associated with significantly increased mortality among patients with liver disease, including those awaiting liver transplantation (Wong 2014). Hepatic encephalopathy Is associated with mortality in patients with cirrhosis independent of other extrahepatic organ failure (Bajaj 2017).
Management of hepatic encephalopathy is complex (Frontera 2014; Leise 2014; Basu 2015; Henderson 2015). It involves a pre‐emptive approach addressing potential precipitating factors, medical therapy to reduce the production and absorption of ammonia from the gut, and surgical or medical interventions (Frederick 2011; Wakim‐Fleming 2011). Several Cochrane systematic reviews have assessed the clinical benefits and harms of several interventions for hepatic encephalopathy treatment, such as dopaminergic agonists (Junker 2014), benzodiazepine receptor antagonists (Als‐Nielsen 2004), non‐absorbable disaccharides (Gluud 2016), branched‐chain amino acids (Gluud 2017), probiotics (Dalal 2017), naloxone (Sun 2009), rifaximin (Kimer 2015), and antibiotics (Falavigna 2007). Acetyl‐L‐carnitine offers another medical approach for reducing toxicity of ammonia in patients with hepatic encephalopathy (Malaguarnera 2006; Malaguarnera 2008; Shores 2008; Malaguarnera 2011a; Malaguarnera 2011b; Malaguarnera 2011c; Malaguarnera 2012; Malaguarnera 2013).
Description of the intervention
Acetyl‐L‐carnitine is an ester of L‐carnitine and acetate that is synthesised in the human brain, liver, and kidney by the enzyme acetyl‐L‐carnitine transferase (Malaguarnera 2013).
Carnitine is an essential dietary nutrient that acts as a carrier of fatty acids across the inner mitochondrial membrane (Malaguarnera 2012). The liver is a central organ for carnitine metabolism and for distribution of carnitine to the body. Therefore, it is not surprising that carnitine metabolism is impaired among patients with certain types of chronic liver disease (Krähenbühl 1996). Selimoglu 2001 pointed out that children with cirrhosis have low plasma carnitine concentrations, and this is especially pronounced among those with Wilson's disease. Based on this perspective, these researchers suggested mandatory carnitine supplementation for patients with cirrhosis in childhood, especially those with Wilson's disease. However, controversy surrounds this issue. One study shows that patients with non‐cirrhotic liver disease had no change in the plasma carnitine pool, whereas those with cirrhosis showed a 29% increase in the long‐chain acylcarnitine concentration (Krähenbühl 1997).
How the intervention might work
Hepatic encephalopathy occurs as a functional disturbance of cells involved in cerebral neurotransmission (Munoz 2008). The major factor affecting cerebral transmission is hyperammonaemia, which is directly neurotoxic (Munoz 2008), causing swelling of astrocytes and brain oedema (Wakim‐Fleming 2011). Swelling of astrocytes generates mitochondrial dysfunction and blood–brain barrier rupture, which lead to neuronal dysfunction (Wakim‐Fleming 2011).
Theoretically, acetyl‐L‐carnitine might be an effective intervention for treating patients affected by hepatic encephalopathy through two mechanisms: first, increasing urea genesis leads to decreased levels of blood and brain ammonium (Malaguarnera 2013); and second, acetyl‐L‐carnitine transported across the blood–brain barrier and accumulating in the cerebral spinal fluid and brain facilitates the uptake of acetyl‐coenzyme A (CoA) into the mitochondria during fatty acid oxidation, enhances acetylcholine production, and stimulates protein and membrane synthesis of phospholipids. All these mechanisms could provide a substrate reservoir for cellular energy production, thereby preventing excessive neuronal cell death (Malaguarnera 2012; Malaguarnera 2013).
Why it is important to do this review
The true role of acetyl‐L‐carnitine in treating patients with hepatic encephalopathy is a topic of controversy (Krähenbühl 1996; Krähenbühl 1997; Selimoglu 2001). The costs of hospitalisation for over 40,000 US patients with hepatic encephalopathy in 2003 were estimated at $932 million (Poordad 2007). Between 2005 and 2009, 110,000 hospitalisations for hepatic encephalopathy were reported in the USA (Stepanova 2012). It has been pointed out that in the European Union, this burden is similar (Vilstrup 2014). Malaguarnera 2006,Malaguarnera 2008,Malaguarnera 2011a,Malaguarnera 2011b, and Malaguarnera 2011c assessed the clinical benefits and harms of acetyl‐L‐carnitine in patients with hepatic encephalopathy. A single research group in Italy conducted all these trials. A review including three randomised clinical trials on L‐acyl‐carnitine treatment of hepatic encephalopathy was published in 2008 (Shores 2008). Review authors did not meta‐analyse the three randomised clinical trials and assessed their quality using the outdated Jadad score (Moher 1995), rather than the bias risk domains recommended by the Cochrane Handbook for Systematic Reviews of Interventions (Higgins 2011). Review authors recommended further trials of L‐acyl‐carnitine (Shores 2008). The Jiang 2013 meta‐analysis on acetyl‐L‐carnitine for people with hepatic encephalopathy showed that acetyl‐L‐carnitine significantly reduced serum ammonia levels and improved mental state, as assessed by the Trail Making Test (Conn 1977; Jiang 2013). However, this meta‐analysis employed no assessment of risk of bias nor risk of random error among the included randomised clinical trials. Thus, a systematic assessment of the beneficial and harmful effects of acetyl‐L‐carnitine for treatment of patients with hepatic encephalopathy is warranted.
Objectives
To assess the benefits and harms of acetyl‐L‐carnitine for patients with hepatic encephalopathy.
Methods
Criteria for considering studies for this review
Types of studies
We sought randomised clinical trials irrespective of their publication status (unpublished or published as an article, abstract, or letter), language, and blinding.
We excluded quasi‐randomised studies from our assessment of benefits, but we will include these and other observational studies in our report on harms if such studies are retrieved by our searches. By choosing this strategy, we are aware that we will place greater focus on potential benefits and may overlook late occurring or rare harms, which are often missed in randomised clinical trials (Storebø 2018).
Types of participants
We included patients with hepatic encephalopathy, irrespective of aetiology.
Types of interventions
Studies compared acetyl‐L‐carnitine administered at any dose, by any route and duration of treatment, versus no intervention, placebo, or other interventions.
As hepatic encephalopathy requires different medical and endoscopic treatments (i.e. primary interventions), acetyl‐L‐carnitine is considered a supplementary intervention. Thus, for the purposes of this review, eligible randomised clinical trials were those that compared the same primary interventions or treatments with and without acetyl‐L‐carnitine drug supplementation.
Types of outcome measures
We extracted data on outcomes at the end of treatment and at maximal follow‐up.
Primary outcomes
All‐cause mortality
Quality of life (any validated scale used by trialists, such as Short Form (SF)‐36)
Serious adverse events (A serious adverse event, defined according to the International Conference on Harmonisation (ICH) Guidelines for Good Clinical Practice (ICH‐GCP 1997), is any untoward medical occurrence that at any dose results in death, is life‐threatening, requires inpatient hospitalisation or prolongation of existing hospitalisation, leads to persistent or significant disability or incapacity, or comprises a congenital anomaly or birth defect.) All other adverse events were considered non‐serious (see below)
Secondary outcomes
Non‐serious adverse events (ICH‐GCP 1997)
Fatigue, either mental or physical (any validated scale used by trial authors)
Days of hospitalisation
Blood ammonium levels
Search methods for identification of studies
We searched the Cochrane Hepato‐Biliary Group Controlled Trials Register (Cochrane Hepato‐Biliary Group Module; searched 10 September 2018); the Cochrane Central Register of Controlled Trials (CENTRAL), in the Cochrane Library (2018, Issue 8; searched 10 September 2018); MEDLINE Ovid (1946 to 10 September 2018); Embase Ovid (1974 to 10 September 2018); Latin American Caribbean Health Sciences Literature (LILACS) (Bireme; 1982 to 10 September 2018); and Science Citation Index Expanded (Web of Science; 1900 to 10 September 2018) (Royle 2003). We have presented search strategies along with the time spans of these searches in Appendix 3.
We looked through the reference lists of retrieved publications and review articles. We searched the Food and Drug Administration (FDA) and European Medicines Agency (EMA) websites for unpubished trials (www.fda.gov; www.ema.europa.eu/ema/). We also searched the World Health Organization (WHO) International Clinical Trials Registry Platform Search Portal and the metaRegister of Controlled Trials for ongoing and unpublished trials (apps.who.int/trialsearch/; www.controlled‐trials.com/mrct/search.html). The evidence is current until 10 September 2018.
Data collection and analysis
We summarised data using standard Cochrane methods (Higgins 2011).
Selection of studies
Two review authors independently selected studies for eligibility using the Early Review Organizing Software (EROS) (Ciapponi 2011). We reviewed titles and abstracts of all identified studies to determine whether they fulfilled the inclusion criteria. We assessed the full texts of selected studies to confirm their relevance for inclusion. We resolved disagreements by consulting with a third review author. We were not blind to study authors’ names and institutions, journal of publication, or study results at any stage of the review.
Data extraction and management
We used a form to extract data from each relevant trial (Zavala 2006). Two review authors independently extracted data from trial publications and contacted study authors if data were missing. Arturo Martí‐Carvajal (AMC) entered the data into Review Manager 5.3 (Review Manager 2014), and Ingrid Arévalo‐Rodríguez (IAR) and Cristina Martí‐Amarista (CMA) independently checked the data. We also extracted information on study design and participant characteristics (age, sex, and hepatic encephalopathy severity, as measured by West Haven grade).
Assessment of risk of bias in included studies
We assessed the following 'Risk of bias' domains of randomised clinical trials (Schulz 1995; Moher 1998; Kjaergard 2001; Wood 2008; Higgins 2011; Savovic 2012a; Savovic 2012b; Lundh 2017; Savović 2018).
Allocation sequence generation
Low risk of bias: sequence generation was achieved using computer random number generation or a random numbers table. Drawing lots, tossing a coin, shuffling cards, and throwing dice were adequate if performed by an independent person not otherwise involved in the trial
Uncertain risk of bias: the sequence generation method was not specified
High risk of bias: the sequence generation method was not random
Allocation concealment
Low risk of bias: participant allocations could not have been foreseen in advance of, or during, enrolment. Allocation was controlled by a central and independent randomisation unit. The allocation sequence was unknown to investigators (e.g. the allocation sequence was hidden in sequentially numbered, opaque, and sealed envelopes)
Uncertain risk of bias: the method used to conceal the allocation was not described, so that intervention allocations may have been foreseen in advance of, or during, enrolment
High risk of bias: the allocation sequence was likely to be known to investigators who assigned participants
Blinding of participants and personnel
Low risk of bias: any of the following: no blinding or incomplete blinding was described, but review authors judged that the outcome was not likely to be influenced by lack of blinding; or blinding of participants and key study personnel was ensured, and it was unlikely that blinding could have been broken
Unclear risk of bias: any of the following: information was insufficient to permit judgement of ‘low risk’ or ‘high risk’; or the trial did not address this outcome
High risk of bias: any of the following: no blinding or incomplete blinding, and the outcome was likely to be influenced by lack of blinding; or blinding of key study participants and personnel was attempted, but it is likely that blinding could have been broken, and the outcome was likely to be influenced by lack of blinding
Blinded outcome assessment
Low risk of bias: any of the following: no blinding of outcome assessment, but review authors judged that outcome measurement was not likely to be influenced by lack of blinding; or blinding of outcome assessment was ensured, and it is unlikely that blinding could have been broken
Unclear risk of bias: any of the following: information was insufficient to permit judgement of ‘low risk’ or ‘high risk’; or the trial did not address this outcome
High risk of bias: any of the following: no blinding of outcome assessment was described, and outcome measurement was likely to be influenced by lack of blinding; or blinding of outcome assessment was described, but it is likely that blinding could have been broken, and outcome measurement was likely to be influenced by lack of blinding
Incomplete outcome data
Low risk of bias: missing data were unlikely to make treatment effects depart from plausible values. Sufficient methods, such as multiple imputation, were employed to handle missing data
Uncertain risk of bias: information was insufficient to assess whether missing data in combination with the method used to handle missing data were likely to induce bias in the results
High risk of bias: results were likely to be biased due to missing data
Selective outcome reporting
Low risk: all pre‐defined, or clinically relevant and reasonably expected, outcomes were reported on. If the original trial protocol was available, outcomes should have been those called for in that protocol (Note: If the trial protocol was obtained from a trial registry (e.g. www.clinicaltrials.gov), the outcomes sought were those enumerated in the original protocol if the trial protocol had been registered before or at the time the trial began; if the trial protocol was registered after the trial began, those outcomes would not have been considered reliable in representing the outcomes initially sought). If the trial protocol was not available (or if the protocol had been registered after the trial began), we would expect the following clinically relevant and reasonably expected outcomes to have been reported by trial authors: all‐cause mortality, quality of life, serious adverse events, non‐serious adverse events, and days of hospitalisation
Unclear risk: not all pre‐defined, or clinically relevant and reasonably expected, outcomes were reported fully, or it is unclear whether data on these outcomes were recorded
High risk: one or more pre‐defined or clinically relevant and reasonably expected outcomes were not reported, although data on these outcomes were likely to have been available and even recorded
For‐profit bias
Low risk of bias: the trial appears to be free of industry sponsorship or other for‐profit support that may manipulate trial design, conduct, or results
Uncertain risk of bias: the trial may or may not be free of for‐profit bias, as no information on clinical trial support or sponsorship was provided
High risk of bias: the trial was sponsored by industry or received other for‐profit support
Other bias
Low risk of bias: the trial appears to be free of other components (e.g. academic bias) that could put it at risk of bias
Uncertain risk of bias: the trial may or may not be free of other components that could put it at risk of bias
High risk of bias: other factors in the trial can put it at risk of bias (e.g. study authors have conducted trials on the same topic)
We judged trials as having low risk of bias if assessed as having low risk of bias in all domains. In all other cases, we judged trials as having high risk of bias.
Measures of treatment effect
For binary outcomes, such as all‐cause mortality and adverse (serious and non‐serious) events, we calculated the risk ratio (RR) with 95% confidence interval (CI) and Trial Sequential Analysis‐adjusted CI (see below).
For continuous outcomes, such as quality of life (e.g. Short Form (SF)‐36), days of hospitalisation, and blood ammonium levels, we calculated the mean difference (MD) with 95% CI and Trial Sequential Analysis‐adjusted CI (see below). If different scales were used for measuring the same outcome (e.g. quality of life), we used the standardised mean difference (SMD) with 95% CI. As recommended by the Cochrane Handbook for Systematic Reviews of Interventions, if necessary, we multiplied the mean values from one set of studies by ‐1 to ensure that all scales point in the same direction (Higgins 2011). We estimated the ratio of means with 95% CIs for continuous outcomes (Friedrich 2008; Friedrich 2011).
Dealing with missing data
We attempted to contact the publication authors.
We attempted to use intention‐to‐treat analysis.
Due to lack of reporting of two primary outcomes (all‐cause mortality and serious adverse events), we performed a sensitivity analysis of two secondary outcomes (i.e. non‐serious adverse events and blood ammonium levels). Regarding these secondary outcomes, we included participants with incomplete or missing data in sensitivity analyses by imputing them according to the following scenarios (Hollis 1999).
Available‐case analysis, which ignores missing data and justifies missing at random assumption (Chaimani 2014).
Extreme‐case analysis favouring the experimental intervention ('best‐worse' case scenario): none of the dropouts/participants lost from the experimental arm, but all of the dropouts/participants lost from the control arm, experienced the outcome, including all randomised participants in the denominator (Hollis 1999).
Extreme‐case analysis favouring the control ('worst‐best' case scenario): all dropouts/participants lost from the experimental arm, but none from the control arm, experienced the outcome, including all randomised participants in the denominator (Hollis 1999).
Furthermore, we assessed the impact of missing data by using two methods based on the principle of uncertainty when used to impute missing trial data.
Gamble‐Hollis analysis (Gamble 2005).
Informative missingness odds ratio model (Chaimani 2014).
Assessment of heterogeneity
We quantified the impact of statistical heterogeneity by using the I² statistic, which describes the percentage of total variation across trials that is due to heterogeneity rather than to sampling error (Higgins 2003). We summarised these findings using a fixed‐effect model or a random‐effects model, according to Jakobsen 2014a. We estimated prediction intervals in cases of statistical heterogeneity by using the random‐effects model (Riley 2011; IntHout 2016; Borenstein 2017; Partlett 2017).
Assessment of reporting biases
For future updates, we will attempt to assess publication bias by using a funnel plot, which is usually used to illustrate variability between trials in a graphical way. We will need to include at least 10 trials if we are to make judgements about asymmetry, and if asymmetry is present, we will attempt to explore its causes (Sterne 2011).
Data synthesis
Meta‐analysis
We performed meta‐analyses with 95% CIs and Trial Sequential Analysis‐adjusted CIs (see below), using both fixed‐effect and random‐effects models, according to Jakobsen 2014a.
Trial Sequential Analysis
Although we identified no trials reporting neither all‐cause mortality nor serious adverse events, we conducted Trial Sequential Analysis (TSA) in estimating sample sizes for future trials regarding either all‐cause‐mortality or serious adverse events. We applied TSA, as cumulative meta‐analyses are at risk of producing random errors due to sparse data and repetitive testing of accumulating data (Brok 2008; Wetterslev 2008; Brok 2009; Thorlund 2009, Wetterslev 2009; Thorlund 2010; Imberger 2015; Imberger 2016; Wetterslev 2017). To minimise random errors, we calculated the required information size (i.e. the number of participants needed in a meta‐analysis to detect or reject a certain intervention effect) (Wetterslev 2008). The required information size calculation should also account for heterogeneity or diversity present in the meta‐analysis (Wetterslev 2008; Wetterslev 2009). In our meta‐analysis, the diversity‐adjusted required information size was based on the event proportion in the control group; assumption of a plausible RR reduction of 20% or RR reduction observed in the included trials at low risk of bias; risk of type I error of 5%; risk of type II error of 20%; and the empirical diversity (D²) of the meta‐analysis (Wetterslev 2009; Wetterslev 2017). Only one trial including only 67 participants assessed quality of life on the SF‐36 scale. We therefore decided not to conduct TSA, as the distance from the accrued sample size to a plausible required information size is too large. Accordingly, we reported naive 95% CIs, which ought to be interpreted conservatively. We will conduct TSA on quality of life if this outcome is measured by the same scale. We conducted TSA for serum ammonium concentration. Here, we used an alpha of 0.0125 (0.05/4) (Bonferrini adjustment), as there are four secondary outcomes, and a beta of 10% and the D² of the meta‐analysis. We added trials according to the year of publication, and if more than one trial has been published in a year, we will add trials alphabetically according to the last name of the first author. On the basis of the required information size, we constructed trial sequential monitoring boundaries (Lan 1983; Wetterslev 2008; Thorlund 2011). These boundaries determined the statistical inference one may draw regarding the cumulative meta‐analysis that has not reached the required information size; if the trial sequential monitoring boundary for benefit or harm was crossed before the required information size was reached, firm evidence might perhaps be established and further trials may turn out to be superfluous. On the other hand, if one of the boundaries is not surpassed, it is probably necessary to continue to conduct trials to detect or reject a certain intervention effect. This can be determined by assessing whether the cumulative Z‐curve crosses trial sequential boundaries for futility. If futility boundaries were crossed, then further trials might be unnecessary (TSA 2011).
We conducted TSA using the latest software version (0.9.5.10.Beta) from the Copenhagen Trial Unit (Thorlund 2011; TSA 2011).
Subgroup analysis and investigation of heterogeneity
We anticipated clinical heterogeneity in effects of the intervention, and for each comparison, we planned to conduct the following subgroup analyses, if data were available.
According to risk of bias when trials at low risk of bias were compared to trials at high risk of bias.
According to the West Haven grade of hepatic encephalopathy at entry.
According to the aetiology of hepatic encephalopathy.
According to acute liver disease compared to chronic liver disease.
We were not able to conduct subgroup analyses and investigations of heterogeneity due to lack of data: no trial measured or reported all‐cause mortality or serious adverse events. Only one trial assessed quality of life.
For future updates, we plan to perform subgroup analyses for primary outcomes.
Sensitivity analysis
In addition to the sensitivity analyses described under Dealing with missing data, we did not perform the following sensitivity analysis to explore the influence of these factors on the intervention effect size.
Repeating the analysis while taking attrition bias into consideration.
For future updates, we plan to perform sensitivity analyses for primary outcomes if data are available.
'Summary of findings' tables
We used the principles of the GRADE system to assess the quality of the body of evidence associated with specific outcomes (all‐cause mortality, quality of life, serious adverse events, fatigue, non‐serious adverse events, days of hospitalisation, and blood ammonium levels) in our review (Guyatt 2011e), and we constructed Table 1 using GRADEpro software. The GRADE approach appraises the quality of a body of evidence based on the extent to which one can be confident that an estimate of effect or association reflects the item being assessed. The quality of a body of evidence considers five factors regarding limitations in design and implementation of available studies suggesting high likelihood of bias: indirectness of evidence (indirect population, intervention, control, outcomes); unexplained heterogeneity and inconsistency of results (including problems with subgroup analyses); imprecision of results (wide confidence intervals); and high probability of publication bias (Balshem 2011; Guyatt 2011a; Guyatt 2011b; Guyatt 2011c; Guyatt 2011d; Guyatt 2011e; Guyatt 2011f; Guyatt 2011g; Guyatt 2011h; Guyatt 2013a; Guyatt 2013b; Guyatt 2013c; Guyatt 2013d; Mustafa 2013; Guyatt 2017).
Calculation and interpretation of Bayes Factor
Given that P values are not as reliable as many scientists assume (Nuzzo 2014), we estimated the threshold for clinical relevance with Bayes factor (Jakobsen 2014a), which has been pointed out as complementary statistical evidence to P values (Lin 2015). Bayes factor is a likelihood ratio indicating the relative strength of evidence for two theories (Goodman 1999; Goodman 2005; Dienes 2014). Bayes factor is the ratio between the probability of getting the result assuming the null hypothesis (H0) is true divided by the probability of getting the result assuming the alternative hypothesis (HA) is true (Jakobsen 2014b). We used the Copenhagen Trial Unit‐Bayes factor calculator.
Comparison of assessments of imprecision with GRADE and Trial Sequential Analysis
Excellent concordance is usually evident between imprecision assessments with GRADE and those with Trial Sequential Analysis (Castellini 2018; Gartlehner 2018). However, in meta‐analyses with diversity for which a random‐effects model is more appropriate, the required information size will be larger with Trial Sequential Analysis than that assessed by GRADE not employing diversity correction and using a fixed‐effect model to calculate the required information size. We will therefore assess imprecision by using both methods.
Results
Description of studies
Results of the search
We identified 738 references using our search strategies. Five trials involving 398 participants met our inclusion criteria (Malaguarnera 2006; Malaguarnera 2008; Malaguarnera 2011a; Malaguarnera 2011b; Malaguarnera 2011c). The evidence is current until 10 September 2018.
See Figure 1 for details of the flow of studies.
1.
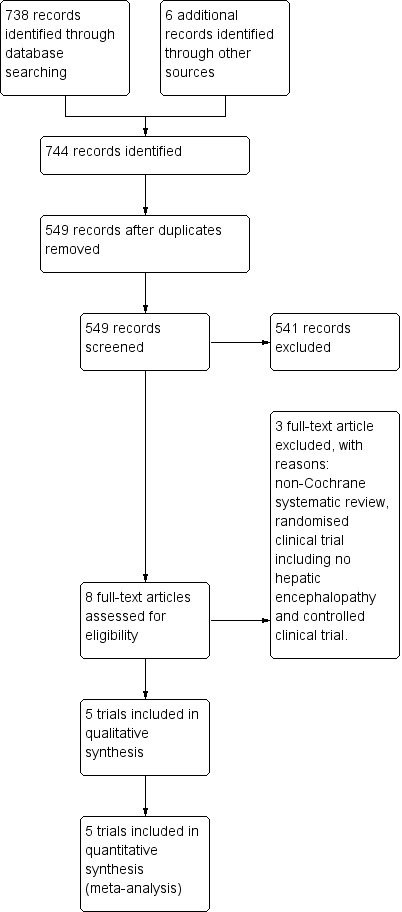
Study flow diagram for 10 August 2018.
Included studies
We have described these trials in the section Characteristics of included studies. Trials varied in size as well as in characteristics of participant populations, duration of intervention, and drug dosage.
Acetyl‐L‐carnitine and populations assessed in the trials
All trials compared acetyl‐L‐carnitine versus placebo (with or without co‐interventions). None of the trials sufficiently described the characteristics of the placebo (Malaguarnera 2006; Malaguarnera 2008; Malaguarnera 2011a; Malaguarnera 2011b; Malaguarnera 2011c).
The co‐interventions used most frequently in both experimental and control groups were lactulose (Malaguarnera 2006; Malaguarnera 2011b; Malaguarnera 2011c); insulin (Malaguarnera 2011b); diuretics (Malaguarnera 2008; Malaguarnera 2011b); beta‐blockers (Malaguarnera 2008; Malaguarnera 2011b); antibiotics (neomycin) (Malaguarnera 2011c); and branched‐chain amino acids (Malaguarnera 2011c). One trial did not report the use of any co‐intervention (Malaguarnera 2011a).
Four trials administered acetyl‐L‐carnitine orally at a dose of 2 grams (gr) twice daily over 90 days (Malaguarnera 2008; Malaguarnera 2011a; Malaguarnera 2011b; Malaguarnera 2011c). One trial administered acetyl‐L‐carnitine intravenously, and the dose was 4 gr once daily over 3 days (Malaguarnera 2006).
The mean age of participants was 50 years (standard deviation (SD) 2.3). Most participants were male (57.4% (SD 7%)). In all trials, hepatic encephalopathy was associated with cirrhosis and portal hypertension (i.e. type C) (Malaguarnera 2006; Malaguarnera 2008; Malaguarnera 2011a; Malaguarnera 2011b; Malaguarnera 2011c). Clinical severity varied and included covert hepatic encephalopathy (Malaguarnera 2008; Malaguarnera 2011a), as well as overt hepatic encephalopathy (Malaguarnera 2006; Malaguarnera 2011b; Malaguarnera 2011c). One trial reported precipitating factors (i.e. haemorrhage, sepsis, dehydration, and surgery) (Malaguarnera 2006). Trials did not provide information on duration of hepatic encephalopathy.
Location of trials
All trials were conducted in the Dipartimento di Scienze della Senescenza, Urologiche e Neurologiche, Università di Catania, in Italy (Malaguarnera 2006; Malaguarnera 2008; Malaguarnera 2011a; Malaguarnera 2011b; Malaguarnera 2011c).
Trial methods
All trials used a parallel‐group design and reported an a priori estimation of sample size. Trials were small, with sample sizes ranging from 24 to 125 participants and a median sample size of 67 and a mean size of 79.6 (SD 42.9). Trials reported inclusion and exclusion criteria. In all trials, the units of randomisation and analysis were the participants. All trials included two comparison groups, without reporting the follow‐up periods (Malaguarnera 2006; Malaguarnera 2008; Malaguarnera 2011a; Malaguarnera 2011b; Malaguarnera 2011c). Trials reported duration of the intervention: three days in Malaguarnera 2006, and 90 days in Malaguarnera 2008,Malaguarnera 2011a,Malaguarnera 2011b, and Malaguarnera 2011c. No trials reported drug company sponsorship.
Excluded studies
We excluded three studies: one meta‐analysis (Jiang 2013), one randomised clinical trial including no participants with hepatic encephalopathy (Malaguarnera 2014), and one non‐randomised clinical trial (Siciliano 2006). See the Characteristics of excluded studies table.
Ongoing trials
We identified one ongoing trial (NCT02173132). This trial also originated from Mariano Malaguarnera and his group from the University of Catania, in Italy. We have provided full details in the Characteristics of ongoing studies table.
Risk of bias in included studies
We have summarised risks of bias in the included trials in Figure 2 and Figure 3, and we have provided details in the Characteristics of included studies table.
2.
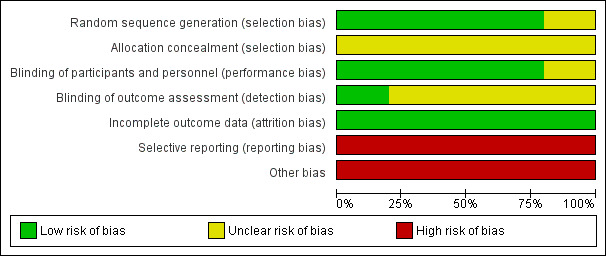
Risk of bias graph: review authors' judgements about each risk of bias item presented as percentages across all included studies.
3.
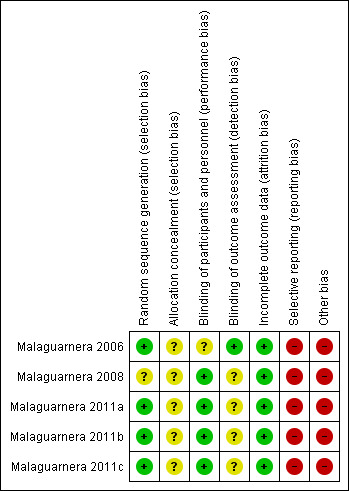
Risk of bias summary: review authors' judgements about each risk of bias item for each included study.
Allocation
Random sequence generation
We considered risk of bias arising from the method of generation of the allocation sequence to be low in four trials (Malaguarnera 2006; Malaguarnera 2011a; Malaguarnera 2011b; Malaguarnera 2011c). One trial had unclear risk of bias for this domain (Malaguarnera 2008).
Allocation concealment
We considered risk of bias arising from the method of allocation concealment to be unclear in all trials (Malaguarnera 2006; Malaguarnera 2008; Malaguarnera 2011a; Malaguarnera 2011b; Malaguarnera 2011c).
Blinding
Blinding of participants and personnel (performance bias)
We rated risk of bias due to lack of blinding of participants and personnel as low in four trials (Malaguarnera 2008; Malaguarnera 2011a; Malaguarnera 2011b; Malaguarnera 2011c). We judged risk of performance bias as unclear in one trial (Malaguarnera 2006).
Blinding of outcome assessment (detection bias)
One trial clearly reported outcome assessment as blinded, and we considered detection bias to be low (Malaguarnera 2006). Blinding of outcome assessors was unclear or was not performed in the remaining four trials (Malaguarnera 2008; Malaguarnera 2011a; Malaguarnera 2011b; Malaguarnera 2011c), so we considered risk of detection bias to be high.
Incomplete outcome data
We rated risk of attrition bias as low in all trials (Malaguarnera 2006; Malaguarnera 2008; Malaguarnera 2011a; Malaguarnera 2011b; Malaguarnera 2011c).
Selective reporting
We rated risk of selective outcome reporting bias as high in all trials (Malaguarnera 2006; Malaguarnera 2008; Malaguarnera 2011a; Malaguarnera 2011b; Malaguarnera 2011c), because these trials neither measured nor reported all‐cause mortality, quality of life, or adverse events data, considered as critical patient‐centred and patient‐reported outcomes. Only one trial reported trial registration number (Malaguarnera 2011b). Malaguarnera 2006 and Malaguarnera 2008 were not registered or published, so we could not assess what was intended and what was reported. Malaguarnera 2011a and Malaguarnera 2011c reported no trial registration number; however, these trials were registered. We noted a mean of 4 years and 6.2 months between the last trial conduction date (end of trial) and the trial publication date (Appendix 4).
Other potential sources of bias
We assessed Malaguarnera 2006,Malaguarnera 2008,Malaguarnera 2011a,Malaguarnera 2011b, and Malaguarnera 2011c as having high risk of other bias due to bias in the design associated with a large number of outcomes and a family‐wise error rate substantially over the 5% level (Follmann 1995; Delorme 2016).
We rated Malaguarnera 2008 as having high risk of allocation and confusion bias due to unclear reporting about random sequence generation and allocation concealment of sequence generation. Malaguarnera 2011b had high risk of bias in the presentation of data due to inconsistency in baseline data.
Accordingly, we considered all trials to have high risk of bias.
Effects of interventions
See: Table 1
All trials compared acetyl‐L‐carnitine versus placebo (Malaguarnera 2006; Malaguarnera 2008; Malaguarnera 2011a; Malaguarnera 2011b; Malaguarnera 2011c).
Primary outcomes
All‐cause mortality
None of the trials reported on all‐cause mortality. A calculation with Trial Sequential Analysis suggested that with proportion of all‐cause mortality in the control group of 38% (Bajaj 2017), a relative risk reduction of 20% in the experimental group, alpha of 5%, beta of 10%, and D² of 25%, we would need a sample size of 2184 participants when conducting a randomised clinical trial to assess the size effect of acetyl‐L‐carnitine versus placebo on all‐cause mortality.
Quality of life
Only one trial involving 67 participants with covert hepatic encephalopathy assessed quality of life using the SF‐36 scale (Malaguarnera 2011a). We therefore decided not to conduct Trial Sequential Analysis, as the distance from the accrued sample size to a plausible required information size was too large. Accordingly, reported naive 95% CIs ought to be interpreted conservatively. Researchers assessed quality of life at 90 days using the SF‐36 scale (range 0 to 100 points (the higher, the better)). Regarding physical functioning, the mean difference (MD) in acetyl‐L‐carnitine compared with placebo, assessed via fixed‐effect or random‐effects models, was 7.90 points (95% CI 4.49 to 11.31); for role limitations due to physical problems, the MD was 9.60 points (95% CI 5.77 to 13.43); for bodily pain, 1.80 points (95% CI ‐2.78 to 6.38); for general health, ‐6.20 points (95% CI ‐9.51 to ‐2.89); for vitality, 2.80 points (95% CI ‐0.11 to 5.71); for social functioning, 2.90 points (95% CI 0.44 to 5.36); for role of limitations due to emotional problems, 4.80 points (95% CI 1.45 to 8.15), and for general mental health perceptions, 3.10 points (95% CI 0.64 to 5.56). Table 2 shows the effect size in MD or ratio of means on domains of quality of life of acetyl‐L‐carnitine compared with placebo. We rated the quality of evidence as very low due to limitations in design and in execution (Malaguarnera 2011a). See Analysis 1.1.
1. Impact of acetyl‐L‐carnitine on quality of life in patients with hepatic encephalopathy.
|
Domain (SF‐36 scale; 0 to 100, higher score is better) |
Mean difference (95% CI) |
Ratio of means (95% CI) |
| Physical functioning | 7.90 (4.49 to 11.31) | 1.12 (1.07 to 1.18) |
| Role limitations due to physIcal problems | 9.60 (5.77 to 13.43) | 1.15 (1.09 to 1.21) |
| Bodily pain at 90 days | 1.80 (‐2.78 to 6.38) | 1.03 (0.96 to 1.10) |
| General health at 90 days | ‐6.20 (‐9.51 to ‐2.89) |
0.91 (0.86 to 0.96) |
| Vitality at 90 days | 2.80 (‐0.11 to 5.71) |
1.05 (1.00 to 1.10) |
| Social functioning at 90 days | 2.90 (0.44 to 5.36) | 1.05 (1.01 to 1.08) |
| Role limitations due to emotional problems at 90 days | 4.80 (1.45 to 8.15) |
1.08 (1.02 to 1.13) |
| General mental health perceptions at 90 days | 3.10 (0.64 to 5.56) |
1.05 (1.01 to 1.09) |
SF‐36: Short Form‐36.
1.1. Analysis.
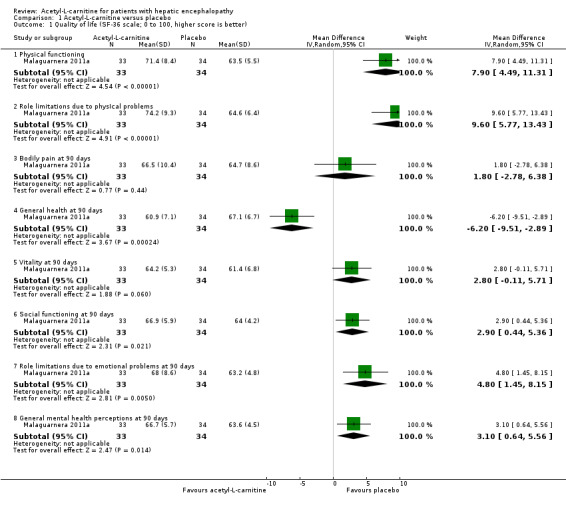
Comparison 1 Acetyl‐L‐carnitine versus placebo, Outcome 1 Quality of life (SF‐36 scale; 0 to 100, higher score is better).
Serious adverse events
None of the trials reported on serious adverse events. Calculation based on TSA suggested that with proportion of serious adverse events in the control group of 3%, a relative risk reduction of 50%, alpha of 5%, beta of 10%, and D² of 0%, we would need a sample size of 4109 participants to conduct a randomised clinical trial to detect the size effect of acetyl‐L‐carnitine versus placebo on serious adverse events.
Secondary outcomes
Non‐serious adverse events
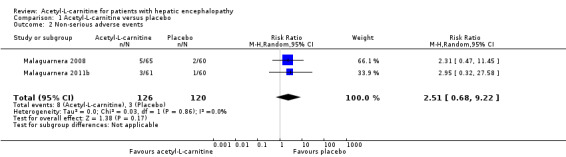
Meta‐analysis of two trials yielded evidence of no effect in terms of non‐serious adverse events when acetyl‐L‐carnitine was compared with placebo (8/126 (6.34%) vs 3/120 (2.5%); RR fixed‐effect model and random‐effects model 2.51; 95% CI 0.68 to 9.22; I² = 0%). We rated the quality of evidence as very low due to limitations in design and in execution (Malaguarnera 2008; Malaguarnera 2011b). See Analysis 1.2. Bayes factor was 4.07 × 10‐8, which means there is a likelihood of 4.07 × 10‐8 times for acetyl‐L‐carnitine versus placebo for increasing risk of non‐serious adverse events. Trial Sequential Analysis of two trials comparing acetyl‐L‐carnitine versus placebo on non‐serious adverse events in participants with hepatic encephalopathy with proportion of non‐serious adverse events in the control group of 2.51%, a relative risk reduction of 20%, alpha of 5%, beta of 20%, and D² of 0% suggests a sample size of 27,741 participants for conducting a randomised clinical trial for detecting the size effect of acetyl‐L‐carnitine compared with placebo on non‐serious adverse events.
1.2. Analysis.
Comparison 1 Acetyl‐L‐carnitine versus placebo, Outcome 2 Non‐serious adverse events.
Sensitivity analysis by missing data on non‐serious adverse events
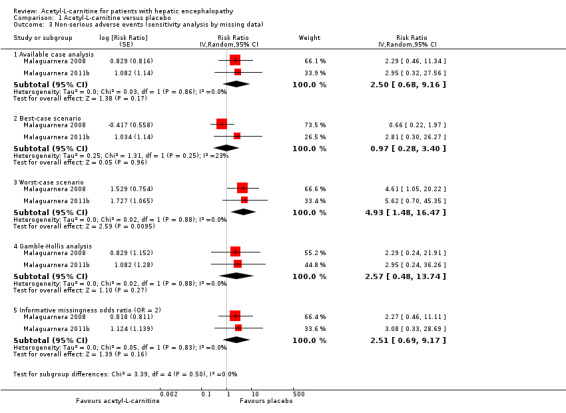
In sensitivity analysis by missing data showing the effect of acetyl‐L‐carnitine versus placebo on non‐serious adverse events by available case analysis (RR 2.50, 95% CI 0.68 to 9.16; I² = 0%), best‐case scenario (RR 0.97, 95% CI 0.28 to 3.40; I² = 23%), worst‐case scenario (RR 4.93, 95% CI 1.48 to 16.47; I² = 0%), Gamble‐Hollis analysis (RR 2.57, 95% CI 0.48 to 13.74; I² = 0%), and the informative missingness odds ratio model (RR 2.51, 95% CI 0.69 to 9.17; I² = 0%) showed evidence of no effect in terms of non‐serious adverse events. Testing for subgroup differences showed no significant differences (Chi² = 3.39, df = 4 (P = 0.50), I² = 0%) (Malaguarnera 2008; Malaguarnera 2011b). See Analysis 1.3.
1.3. Analysis.
Comparison 1 Acetyl‐L‐carnitine versus placebo, Outcome 3 Non‐serious adverse events (sensitivity analysis by missing data).
Table 3 provides details on how adverse events were reported (Malaguarnera 2006; Malaguarnera 2008; Malaguarnera 2011a; Malaguarnera 2011b; Malaguarnera 2011c).
2. Adverse events reported in each trial.
| Trial | Adverse events |
| Malaguarnera 2006 | "No side effects were observed in our study series" |
| Malaguarnera 2008 | "In the group treated with acetyl‐L‐carnitine, one patient complained of nausea, two of slight headache and two of abdominal pain. In the placebo group, one patient complained of diarrhoea and one of moderate headache. Nobody withdrew from the planned treatment" |
| Malaguarnera 2011a | Researchers did not report on adverse events |
| Malaguarnera 2011b | "Three patients in the acetyl‐L‐carnitine group (1 with mild hepatic encephalopathy and 2 with moderate hepatic encephalopathy) withdrew from the study because of abdominal pain. One patient in the placebo group withdrew from the study because of headache. In the placebo group, we observed occasional abdominal pain, cramping, diarrhoea, and flatulence. At follow‐up 1 mo after treatment ended, 2 patients in the acetyl‐L‐carnitine group and 5 patients in the placebo group experienced moderate hepatic encephalopathy" |
| Malaguarnera 2011c | Researchers did not report on adverse events |
Fatigue
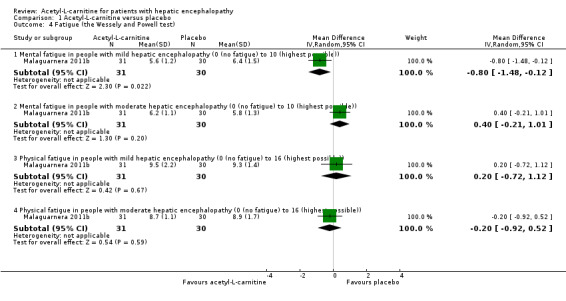
One trial involving 121 participants with overt hepatic encephalopathy assessed fatigue ‐ mental or physical (Malaguarnera 2011b). Researchers assessed fatigue using the Wessely and Powell test at day 90. The mental fatigue scale has a range of 0 (no fatigue) to 10 (highest) points. In terms of mental fatigue among people with mild‐grade hepatic encephalopathy, the mean difference between acetyl‐L‐carnitine versus placebo was ‐0.80 points (95% CI ‐1.48 to ‐0.12; participants = 61; trials = 1), and the mean difference in mental fatigue among people with moderate‐grade hepatic encephalopathy was ‐0.40 points (95% CI ‐0.21 to 1.01; participants = 61; trials = 1). For physical fatigue in people with mild‐grade hepatic encephalopathy (Wessely and Powell test from 0 (no fatigue) to 16 (highest possible)), the mean difference was 0.20 points (95% CI ‐0.72 to 1.12; participants = 61; trials = 1), and the mean difference for physical fatigue in people with moderate‐grade hepatic encephalopathy was ‐0.20 points (95% CI ‐0.92 to 0.52; participants = 61; trials = 1) assessed by the fixed‐effect model. Malaguarnera 2011b reported data by subgroup of mild or moderate hepatic encephalopathy. Table 4 shows the effect size in MD or ratio of means on fatigue of acetyl‐L‐carnitine compared with placebo. We rated the quality of evidence as very low due to limitations in design and in execution (Malaguarnera 2011b). See Analysis 1.4.
3. Impact of acetyl‐L‐carnitine on fatigue (the Wessely and Powell test).
| Type of fatigue by hepatic encephalopathy |
Fatigue (the Wessely and Powell test)b,c |
|
|
Mean difference (95% CI) |
Ratio of means (95% CI) |
|
| Mental fatigue in people with mild hepatic encephalopathy (0 (no fatigue) to 10 (highest possible))a | ‐0.80 (‐1.48 to ‐0.12) |
0.88 (0.78, to 0.98) |
| Mental fatigue in people with moderate hepatic encephalopathy (0 (no fatigue) to 10 (highest possible))a | 0.40 (‐0.21 to 1.01) |
1.07 (0.97 to 1.18) |
| Physical fatigue in people with mild hepatic encephalopathy (0 (no fatigue) to 16 (highest possible))a | 0.20 (‐0.72 to 1.12) |
1.02 (0.93 to 1.13) |
| Physical fatigue in people with moderate hepatic encephalopathy (0 (no fatigue) to 16 (highest possible))a | ‐0.20 (‐0.92 to 0.52) |
0.98 (0.90 to 1.06) |
1.4. Analysis.
Comparison 1 Acetyl‐L‐carnitine versus placebo, Outcome 4 Fatigue (the Wessely and Powell test).
Blood ammonium levels
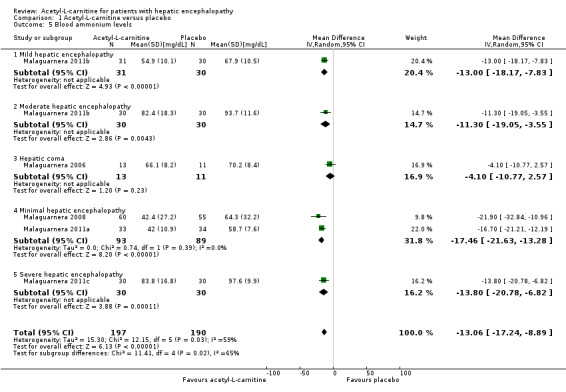
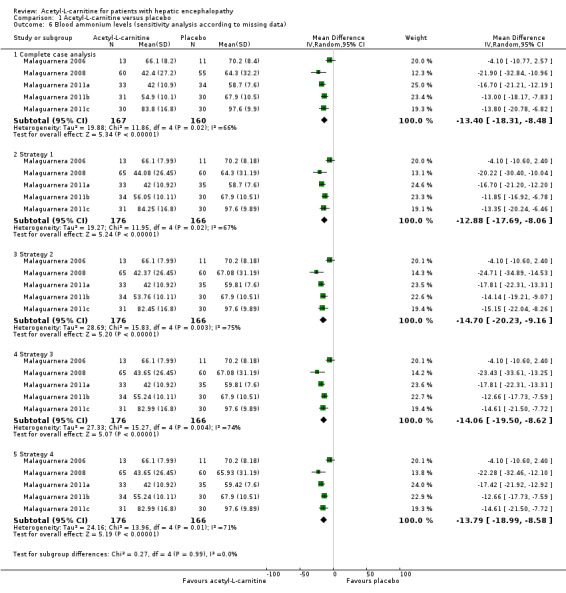
Meta‐analysis of five trials involving 387 participants with covert or overt hepatic encephalopathies showed a reduction in blood ammonium levels favouring participants assigned to acetyl‐L‐carnitine over participants allocated to placebo (MD ‐13.06 mg/dL, 95% CI ‐17.24 to ‐8.89; I² = 59% (95% CI 1% to 84%); D² of 63%) (Analysis 1.5). The prediction interval was MD ‐13.06 mg/dL (95% CI ‐25.43 to ‐0.69), which should be understood to show that in some 95% of the entire population, the true effect size in new settings will be between ‐25.43 and ‐0.69 mg/dL. Bayes factor was 5.02 × 10²⁰, which means there is a likelihood of 5.02 × 10²⁰ times for acetyl‐L‐carnitine over placebo for reducing blood ammonium levels by at least 13.06 mg/dL, or 18% (based on a ratio of means of 0.82). Trial Sequential Analysis of five trials comparing acetyl‐L‐carnitine versus placebo on blood ammonium levels in participants with hepatic encephalopathy suggests that no additional trials may be needed on this outcome (Figure 4). We rated the quality of evidence asvery low due to limitations in design and execution and inconsistency. Testing for subgroup differences was significant (P = 0.02), and I² attributed to subgroup differences was 64.9% (Malaguarnera 2006; Malaguarnera 2008; Malaguarnera 2011a; Malaguarnera 2011b; Malaguarnera 2011c). Table 5 shows the effect size in MD or in ratio of means of blood ammonium levels when acetyl‐L‐carnitine was compared with placebo.
1.5. Analysis.
Comparison 1 Acetyl‐L‐carnitine versus placebo, Outcome 5 Blood ammonium levels.
4.
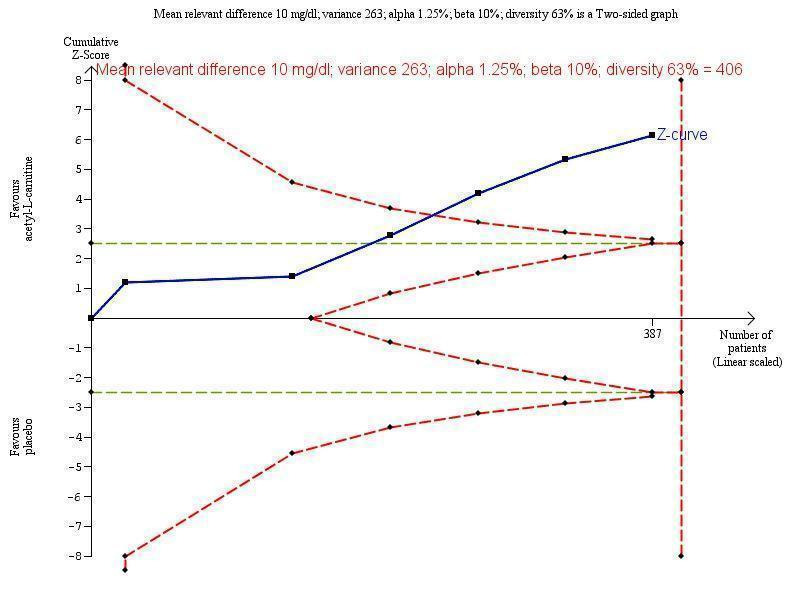
Trial Sequential Analysis of five trials comparing acetyl‐L‐carnitine versus placebo on blood ammonium levels in participants with hepatic encephalopathy.
Trial Sequential Analysis of five trials comparing acetyl‐L‐carnitine versus placebo on blood ammonium levels in participants with hepatic encephalopathy based on the diversity‐adjusted required information size (DARIS) of 406 participants. This DARIS was calculated based upon a mean relevant difference of 10 mg; a variance of 263; an alpha (α) of 1.25%; and a beta (β) of 10%. The cumulative Z‐curve (blue line) crossed the conventional alpha of 1.25% (green line) after three trials. This implies that there is not a random error. The cumulative Z‐curve (blue line) surpassed the continuous alpha‐spending boundary (monitoring efficacy boundary) after four trials. Presently, 95.3% (387/406) of the DARIS has been obtained.
Malaguarnera 2011b measured twice blood ammonium level with mild or moderate hepatic encephalopathy.
4. Impact of acetyl‐L‐carnitine on blood ammonium levels in patients with hepatic encephalopathy.
| Type of hepatic encephalopathy |
Acetyl‐L‐carnitine sample size |
Placebo sample size |
Blood ammonium levels | |
|
Mean difference, mg/dL (95% CI) |
Ratio of means (95% CI) |
|||
| Mild hepatic encephalopathya | 31 | 30 | ‐13.00 (‐18.17 to ‐7.83) | 0.81 (0.74 to 0.88) |
| Moderate hepatic encephalopathya | 30 | 30 | ‐11.30 (‐19.05 to ‐3.55) | 0.88 (0.80 to 0.96) |
| Hepatic comab | 13 | 11 | ‐4.10 (‐10.77 to 2.57) | 0.94 (0.85 to 1.04) |
| Minimal hepatic encephalopathyc,d Subtotal (95% CI) |
60 | 55 | ‐21.90 (‐32.84 to ‐10.96) | 0.66 (0.53 to 0.81) |
| 33 | 34 | ‐16.70 (‐21.21 to ‐12.19) | 0.72 (0.65 to 0.79) | |
| 93 | 89 | ‐17.46 (‐21.63 to ‐13.28) I²= 0% | 0.70 (0.64 to 0.77) I²= 0% | |
| Severe hepatic encephalopathye | 30 | 30 | ‐13.80 (‐20.78 to ‐6.82) | 0.86 (0.79 to 0.93) |
| Total (95% CI) | 197 | 190 | ‐13.06 (‐17.24 to ‐8.89) I²= 59% |
0.82
(0.75 to 0.89) I²= 78% |
Sensitivity analysis by missing data
Sensitivity analysis by missing data on the effect of acetyl‐L‐carnitine versus placebo on blood ammonium levels by complete‐case analysis (MD ‐13.40 mg/dL, 95% CI ‐18.31 to ‐8.48; participants = 327; I² = 66%), strategy 1 (MD ‐12.88 mg/dL, 95% CI ‐17.69 to ‐8.06; participants = 342; I² = 67%), strategy 2 (MD ‐14.70 mg/dL 95% CI ‐20.23 to ‐9.16; participants = 342; I² = 75%), strategy 3 (MD ‐14.06 mg/dL, 95% CI ‐19.50 to ‐8.62; participants = 342; I² = 74%), and strategy 4 (MD ‐13.79 mg/dL, 95% CI ‐18.99 to ‐8.58; participants = 342; I² = 71%) shows robustness of results for each of the imputation strategies. Testing for subgroup differences showed no difference (Chi² = 0.27, df = 4 (P = 0.99), I² = 0%) (Analysis 1.6).
1.6. Analysis.
Comparison 1 Acetyl‐L‐carnitine versus placebo, Outcome 6 Blood ammonium levels (sensitivity analysis according to missing data).
'Summary of findings' tables
Table 1 shows the overall grading of evidence found for this Cochrane systematic review.
Discussion
Summary of main results
This Cochrane systematic review about acetyl‐L‐carnitine for treating patients with hepatic encephalopathy includes five randomised clinical trials that randomised 398 participants. These trials evaluated acetyl‐L‐carnitine given orally or intravenously compared with placebo. Overall, we assessed these trials as having high risk of bias and as being underpowered. All trials reported an a priori sample size estimation. Drug companies did not sponsor any of the trials. Trials were conducted in one country (Italy) by the same team of investigators, in general in the outpatient (ambulatory) setting.
None of the included trials assessed, reported, or measured all‐cause mortality and serious adverse events. Regarding quality of life and mental and physical fatigue, the certainty of the estimate was very low due to limitations in design and execution of included trials, and smallness of study samples. We were able to meta‐analyse data only on trial participants with non‐serious adverse events. Meta‐analysis of two trials showed no effect of acetyl‐L‐carnitine versus placebo on non‐serious adverse events. The certainty of the estimate was very low due to limitations in design and execution of included trials, smallness of sample size, and very low numbers of events. Meta‐analysis of five trials showed a reduction in blood ammonium levels favouring people receiving acetyl‐L‐carnitine. We judged the certainty of the estimate as very low due to limitations in design and execution of included trials, and smallness of study samples (Table 1).
Overall completeness and applicability of evidence
Our analyses and conclusions are based on five single‐centre small randomised clinical trials at high risk of bias due to pitfalls in design and execution. Given this information and GRADE findings, we believe that future trials are necessary to determine, with greater certainty, the potential clinical benefits and harms of acetyl‐L‐carnitine for patients with hepatic encephalopathy. The harm profile of acetyl‐L‐carnitine remains unknown due to lack of sufficient reporting of adverse events and reactions. Regarding dealing with neutral results, one must keep in mind that 'absence of evidence' is not 'evidence of absence' (Fermi Paradox 1950; Altman 1995). The fact that this review detected no strong differences between acetyl‐L‐carnitine and placebo groups should not be interpreted as meaning that placebo therapy and acetyl‐L‐carnitine are equal. The first possible explanation is failure to achieve an appropriate sample size (Schulz 1995). Moreover, when dealing with such small numbers of participants as were randomised here, the risk that randomisation has not achieved what we want of it is substantial. Simulation studies have shown that sample sizes well over 1000 participants are needed before simple randomisation can bring what we expect: a fair and even distribution of prognostic factors among participants (Nguyen 2017).
When we assessed the results of Malaguarnera 2011b for mental or physical fatigue, we feared that study authors may have overinterpreted their results (Boutron 2010; Arunachalam 2016). It is widely recognised that subgroup analyses can produce spurious results (Brookes 2001). According to recommendations from Brookes 2001 and Sun 2014, results from any subgroup analysis should not be overinterpreted.
Although acetyl‐L‐carnitine reduced blood ammonium levels by almost 20%, it provided no apparent clinical benefit (Analysis 1.5; Table 5). A comparable phenomenon has been found with homocysteine‐lowering interventions for preventing cardiovascular events (Marti‐Carvajal 2015). Several variables have been described to explain this failure of physiological and biochemical theories to translate into benefit for patients (Heneghan 2017). The pitfalls of several biomarkers considered useful for assessing clinical benefits of interventions have been pointed out previously (Ioannidis 2017a). On the other hand, and to delve deeper into meta‐analysis on blood ammonium levels (Analysis 1.5), we found significant variation in estimated effects between trials (high statistical heterogeneity) measuring the mean difference or the ratio of means (Table 5). However, it is known that I² can be biased and inaccurate in small meta‐analyses (von Hippel 2015). Notwithstanding, Trial Sequential Analysis revealed diversity (D²) of 63% (Figure 4). Diversity is the percentage that between‐trial variability constitutes of the sum of between‐trial variability and a sampling error estimate in light of the required information size (Wetterslev 2009; Wetterslev 2017), when the required information size is not sufficiently accounted for by correction with I² (Higgins 2003). The impact of heterogeneity is shown in the wide prediction interval of differences in means (‐13.06 mg/dL, 95% confidence interval (CI) ‐25.43 to ‐0.69). Trials with low methodological quality and small sample sizes and the small number of included trials hinder determination of a potential association between a moderator variable and effect size (Hempel 2012; Hempel 2013). This is the case in meta‐analysis of acetyl‐L‐carnitine for blood ammonium levels in this Cochrane Review (Analysis 1.5).
Finally, this review found a shortage of data on harm profiles about acetyl‐L‐carnitine, which is not uncommon (Ioannidis 2009; Pitrou 2009; Storebø 2018).
Thus, overall completeness and applicability of evidence are poor due to potentially spurious findings.
Quality of the evidence
One key detail needed to understand the findings of this Cochrane Review is that the only source of evidence comprises trials conducted by the same research team. Evidence suggests that single‐centre randomised clinical trials overestimate treatment effects when compared to multi‐centre randomised clinical trials (Dechartres 2011; Unverzagt 2013). Therefore, one should assess clinical research findings from single centres with caution. We noted that proper description of placebo was lacking in included trials. It is known that in a particular context, placebo interventions can influence patient‐reported outcomes (Hróbjartsson 2010).
We conducted GRADE assessment on outcomes of both meta‐analysed and non‐meta‐analysed trials. We determined that none of the trials provided strong evidence, primarily due to small sample sizes (even after meta‐analysis), which generate wide confidence intervals and low precision of estimates of treatment effects, along with high risk of bias due to lack of adequate randomisation methods, unclear risk of blinding, and unclear reporting of outcomes. These issues are associated with inflation of intervention effect size estimates and increments in between‐trial inconsistency among trials reporting subjectively assessed outcomes (Savovic 2012a). Missing data did not affect results related to non‐serious adverse events (Analysis 1.5).
Although four of the five included trials reported the tool used for random sequence generation, none provided details of their randomisation techniques. Furthermore, none of the trials mentioned concealment of the allocation sequence (Malaguarnera 2006; Malaguarnera 2011a; Malaguarnera 2011b; Malaguarnera 2011c). These pitfalls may not have protected against bias, given the small size of included trials (Nguyen 2017), but they may have led to downgraded quality of evidence provided by the trials included in this Cochrane Review. Thereupon, causal inference from these trials fails (Berger 2008; Backmann 2017).
We downgraded the quality of evidence emerging from a biomarker outcome (blood ammonium levels) due to limitations in design and execution, as well as inconsistency. However, sensitivity analysis by missing data shows the robustness of evidence that emerged from meta‐analysis of this outcome (Guyatt 2017). Therefore, we did not downgrade the quality of evidence for missing data.
Due to the smallness of sample sizes or the very low numbers of events that yielded imprecision with wide confidence intervals, one should interpret all estimates of treatment effect reported in this review, possibly with the exception of those related to blood ammonium levels, as potentially false positive (inflated or overestimated beneficial effects) or as potentially false negative (underestimated harms) (Gaskin 2014; Szucs 2017).
See Table 1 for a complete assessment and rationale for ratings.
Potential biases in the review process
A group of biases called 'significance‐chasing biases' includes publication bias, selective outcome reporting bias, selective analysis reporting bias, and fabrication bias (Ioannidis 2010). Publication bias represents a major threat to the validity of systematic reviews, particularly reviews that include small trials. However, this Cochrane Review has low risk of publication bias due to the meticulous trial search that was performed. Furthermore, we adhered to the recommendations for reducing play of chance or bias due to selective inclusion and reporting of outcomes and analyses in systematic reviews of randomised trials of healthcare interventions (Page 2014). We were not able to prepare a funnel plot or test for funnel plot asymmetry due to lack of trials reporting primary outcomes and inclusion of few trials in this review.
Selective outcome reporting bias operates through suppression of information about specific outcomes and has similarities to publication bias for whole studies or trials, in that ‘negative’ results remain unpublished (Ioannidis 2010). Furthermore, it has been pointed out that selective reporting practices yield trial results that are more attractive but spurious (Ioannidis 2017b). We found five trials with high risk of selective outcome reporting bias mainly due to absence of information on all‐cause mortality and serious adverse events. However, all these trials reported information on blood ammonium levels, which remain a non‐validated surrogate outcome for patient‐centred outcomes such as hepatic encephalopathy, complications, and mortality (Cochrane Hepato‐Biliary Group Module). Only when we derive data (preferably individual participant data) from randomised clinical trials reporting effects of acetyl‐L‐carnitine on both blood ammonium levels and clinical outcomes can we assess whether changes in ammonium levies can predict changes in clinical outcomes (Gluud 2007).
This Cochrane Review has identified the following issues, which should be considered in planning of future trials: lack of information concerning all‐cause mortality and adverse events, and paucity of information on quality of life and fatigue, whether mental or physical. Differences in definitions of outcomes and inconsistency of reported outcomes must be avoided. Trials should adopt an agreed upon set of core outcomes for each medical condition (Clarke 2007). This approach may reduce the impact of outcome reporting bias (Kirkham 2010; Dwan 2013).
The impact of outcome reporting bias may be reduced by adopting the recommendations of the Patient‐Centered Outcomes Research Institute (PCORI) (Fleurence 2015). This organisation was established by the US Congress as an independent, non‐profit organisation, created to conduct research that provides information about the best available evidence, to help patients and their healthcare providers make more informed decisions. PCORI research is intended to enhance patient understanding of available prevention, treatment, and care options, as well as the science that supports these options (Selby 2014).
Agreements and disagreements with other studies or reviews
Our findings differ from those of a non‐Cochrane review and meta‐analysis published in 2013 (Jiang 2013). First, we conducted our systematic review based on a peer‐reviewed published protocol for the systematic review. Jiang and colleagues did not base their review on a published or unpublished protocol (Jiang 2013). Second, we assessed both orally and intravenously administered acetyl‐L‐carnitine, but Jiang 2013 included only trials assessing oral acetyl‐L‐carnitine and another compound. Third, Jiang 2013 included trials assessing acetyl‐L‐carnitine or L‐carnitine, and we included only trials assessing acetyl‐L‐carnitine. However, Jiang 2013 was explicit in its inclusion criteria for the intervention ‐ "RCTs compared oral acetyl‐L‐carnitine to placebo". Confusion seems related to the fact that acetyl‐L‐carnitine is not the same as L‐carnitine. Fourth, Jiang 2013 conducted assessment of risk of bias using Jadad's scale, and we assessed eight bias domains. Fifth, Jiang 2013 did not mention which were their primary or secondary outcomes. Sixth, Jiang 2013 did not report information about all‐cause mortality and adverse events. Thus, we found different results compared to Jiang 2013. This could be explained by differences in perspectives, goals, and constraints between Jiang 2013 and the present Cochrane systematic review (Saldanha 2017). However, both reviews found a paucity of information on adverse events. For this Cochrane Review, FDA 2016 presented a similar opinion as for Jiang 2013: "The general conclusion of the analysis is that acetyl‐L‐carnitine was effective in reducing serum ammonia levels. However, there were no outcomes that suggested the clinical meaningfulness of a mean reduction of serum ammonia by 26 mg/dL. No conclusions were drawn regarding the consistency of secondary outcomes" (FDA 2016).
Authors' conclusions
Implications for practice.
This Cochrane systematic review analysed a heterogeneous group of five trials conducted by a single research team. We assessed acetyl‐L‐carnitine versus placebo for patients with covert and overt hepatic encephalopathy. We found no data on mortality, serious adverse events, or days of hospitalisation. We found no clear differences in effect between acetyl‐L‐carnitine and placebo regarding quality of life, fatigue, and non‐serious adverse events. Research shows that acetyl‐L‐carnitine reduces blood ammonium levels compared with placebo. We rated all evidence as having very low certainty due to pitfalls in design and execution, inconsistency, smallness of sample sizes, and very low numbers of events. The harms profile of acetyl‐L‐carnitine remains unknown.
Implications for research.
This Cochrane Review has identified the need for well‐designed, adequately powered randomised clinical trials to assess the benefits and harms of acetyl‐L‐carnitine on all‐cause mortality, quality of life, and adverse events as primary outcomes in people with covert or overt hepatic encephalopathy. Trials should be designed according to the SPIRIT statement (Chan 2013), and they should be reported according to the CONSORT statement, to improve the quality of reporting of efficacy (Turner 2012); trials should also provide better reports of harms/adverse events encountered during their conduct (Ioannidis 2004). Future trials should be planned in keeping with Foundation of Patient‐Centered Outcomes Research recommendations (Fleurence 2015). Potential trials should include clinical outcomes such as all‐cause mortality, quality of life, and adverse events.
Acknowledgements
The review authors express gratitude to:
Sarah Louise Klingenberg of the Cochrane Hepato‐Biliary Group for preparing the search strategies; and
Dimitrinka Nikolova of the Cochrane Hepato‐Biliary Group for improving the quality of this Cochrane Review through her excellent questions and revisions.
Ingrid Arevalo‐Rodriguez is funded by a Sara Borrell contract from the Instituto de Salud Carlos III (CD17/00219; Acción Estrategica en Salud 2013‐2016, co‐funded by European Social Fund 2014‐2020, "Investing in your future").
Peer reviewers: Kapil Kumar Sharma, India; one peer reviewer who wishes to remain anonymous. Contact editor: Janus Christian Jakobsen, Denmark.
Cochrane Review Group funding acknowledgement: The Danish State is the largest single funder of the Cochrane Hepato‐Biliary Group through its investment in the Copenhagen Trial Unit, Centre for Clinical Intervention Research, Rigshospitalet, Copenhagen University Hospital, Denmark.
Disclaimer: The views and opinions expressed in this review are those of the authors and do not necessarily reflect those of the Danish State or the Copenhagen Trial Unit.
Appendices
Appendix 1. West Haven criteria for grading mental state
| Grade | Mental state (Shores 2008) |
| Grade 0 |
|
| Grade 1 |
|
| Grade 2 |
|
| Grade 3 |
|
| Grade 4 |
|
Appendix 2. Prevalence and incidence of hepatic encephalopathy
| Timing | Prevalence | Incidence |
| At diagnosis of cirrhosis | 10% to 14% in general have overt hepatic encephalopathy | ‐ |
| Decompensated cirrhosis | 16% to 21% have overt hepatic encephalopathy | ‐ |
| Transjugular intrahepatic portosystemic (TIPS) | 10% to 50% have overt hepatic encephalopathy | 10% to 50% have overt hepatic encephalopathy during a median follow‐up of 1 year |
| At some time during the clinical course of cirrhosis | ‐ | 30% to 40% will have overt hepatic encephalopathy |
| Any patients with cirrhosis | 20% to 80% have minimal or covert hepatic encephalopathy | ‐ |
| Pre‐hepatic non‐cirrhotic portal hypertension | Unknown | ‐ |
| Within 5 years after cirrhosis diagnosis | ‐ | 5% to 25% in general develop overt hepatic encephalopathy |
| With previous bout of overt hepatic encephalopathy |
‐ | 40% cumulative risk of recurrence during the following year |
| Another recurrence of overt hepatic encephalopathy | ‐ | 40% cumulative risk of recurrence during the following 6 months, despite lactulose treatment |
From Vilstrup 2014.
Appendix 3. Search strategy
| Database | Time span | Search strategy |
| Cochrane Hepato‐Biliary Group Controlled Trials Register | September 2018 | (carnitin* or alcar* or levacecarnin*) AND (liver cirrhos* or hepatic encephalopath*) |
| Cochrane Central Register of Controlled Trials (CENTRAL), in the Cochrane Library | 2018, Issue 8 | #1 MeSH descriptor: [Carnitine] explode all trees #2 carnitin* or alcar* or levacecarnin* #3 #1 or #2 #4 MeSH descriptor: [Hepatic Encephalopathy] explode all trees #5 MeSH descriptor: [Liver Cirrhosis] explode all trees #6 #7 #4 or #5 or #6 #8 #3 and #7 |
| MEDLINE Ovid | 1946 to September 2018 | 1. exp Carnitine/ 2. (carnitin* or alcar* or levacecarnin*).mp. [mp=title, abstract, original title, name of substance word, subject heading word, keyword heading word, protocol supplementary concept, rare disease supplementary concept, unique identifier] 3. 1 or 2 4. exp Hepatic Encephalopathy/ 5. exp Liver Cirrhosis/ 6. (liver cirrhos* or hepatic encephalopath*).mp. [mp=title, abstract, original title, name of substance word, subject heading word, keyword heading word, protocol supplementary concept, rare disease supplementary concept, unique identifier] 7. 4 or 5 or 6 8. 3 and 7 |
| Embase Ovid | 1974 to September 2018 | 1. exp carnitine/ 2. (carnitin* or alcar* or levacecarnin*).mp. [mp=title, abstract, subject headings, heading word, drug trade name, original title, device manufacturer, drug manufacturer, device trade name, keyword] 3. 1 or 2 4. exp hepatic encephalopathy/ 5. exp liver cirrhosis/ 6. (liver cirrhos* or hepatic encephalopath*).mp. [mp=title, abstract, subject headings, heading word, drug trade name, original title, device manufacturer, drug manufacturer, device trade name, keyword] 7. 4 or 5 or 6 8. 3 and 7 |
| Science Citation Index Expanded (Web of Science) | 1900 to September 2018 | #3 #2 AND #1 #2 TS=(liver cirrhos* or hepatic encephalopath*) #1 TS=(carnitin* or alcar* or levacecarnin*) |
| LILACS (Bireme) | 1982 to September 2018 | (carnitin$ or alcar$ or levacecarnin$) [Words] and (liver cirrhos$ or hepatic encephalopath$) [Words] |
| Food and Drug Administration (FDA) | 10 September 2018 | acetyl‐l‐carnitine AND hepatic encephalopathy |
| European Medicines Agency (EMA) | 10 September 2018 | acetyl‐l‐carnitine AND hepatic encephalopathy |
Appendix 4. Time between end of trial and publication of trial
| Trial | Trial end date | Trial publication date | Range |
| Malaguarnera 2006 | July 2002 | November 2006 | 4 years and 4 months |
| Malaguarnera 2008 | December 2003 | 21 March 2008 | 4 years and 3 months |
| Malaguarnera 2011a | November 2005 | June 2011 | 5 years and 7 months |
| Malaguarnera 2011b | December 2007 | April 2011 | 3 years and 8 months |
| Malaguarnera 2011c | December 2006 | 26 August 2011 | 4 years and 8 months |
Data and analyses
Comparison 1. Acetyl‐L‐carnitine versus placebo.
| Outcome or subgroup title | No. of studies | No. of participants | Statistical method | Effect size |
|---|---|---|---|---|
| 1 Quality of life (SF‐36 scale; 0 to 100, higher score is better) | 1 | Mean Difference (IV, Random, 95% CI) | Subtotals only | |
| 1.1 Physical functioning | 1 | 67 | Mean Difference (IV, Random, 95% CI) | 7.90 [4.49, 11.31] |
| 1.2 Role limitations due to physIcal problems | 1 | 67 | Mean Difference (IV, Random, 95% CI) | 9.60 [5.77, 13.43] |
| 1.3 Bodily pain at 90 days | 1 | 67 | Mean Difference (IV, Random, 95% CI) | 1.80 [‐2.78, 6.38] |
| 1.4 General health at 90 days | 1 | 67 | Mean Difference (IV, Random, 95% CI) | ‐6.20 [‐9.51, ‐2.89] |
| 1.5 Vitality at 90 days | 1 | 67 | Mean Difference (IV, Random, 95% CI) | 2.80 [‐0.11, 5.71] |
| 1.6 Social functioning at 90 days | 1 | 67 | Mean Difference (IV, Random, 95% CI) | 2.90 [0.44, 5.36] |
| 1.7 Role limitations due to emotional problems at 90 days | 1 | 67 | Mean Difference (IV, Random, 95% CI) | 4.80 [1.45, 8.15] |
| 1.8 General mental health perceptions at 90 days | 1 | 67 | Mean Difference (IV, Random, 95% CI) | 3.10 [0.64, 5.56] |
| 2 Non‐serious adverse events | 2 | 246 | Risk Ratio (M‐H, Random, 95% CI) | 2.51 [0.68, 9.22] |
| 3 Non‐serious adverse events (sensitivity analysis by missing data) | 2 | Risk Ratio (Random, 95% CI) | Subtotals only | |
| 3.1 Available case analysis | 2 | Risk Ratio (Random, 95% CI) | 2.50 [0.68, 9.16] | |
| 3.2 Best‐case scenario | 2 | Risk Ratio (Random, 95% CI) | 0.97 [0.28, 3.40] | |
| 3.3 Worst‐case scenario | 2 | Risk Ratio (Random, 95% CI) | 4.93 [1.48, 16.47] | |
| 3.4 Gamble‐Hollis analysis | 2 | Risk Ratio (Random, 95% CI) | 2.57 [0.48, 13.74] | |
| 3.5 Informative missingness odds ratio (OR = 2) | 2 | Risk Ratio (Random, 95% CI) | 2.51 [0.69, 9.17] | |
| 4 Fatigue (the Wessely and Powell test) | 1 | Mean Difference (IV, Random, 95% CI) | Subtotals only | |
| 4.1 Mental fatigue in people with mild hepatic encephalopathy (0 (no fatigue) to 10 (highest possible)) | 1 | 61 | Mean Difference (IV, Random, 95% CI) | ‐0.80 [‐1.48, ‐0.12] |
| 4.2 Mental fatigue in people with moderate hepatic encephalopathy (0 (no fatigue) to 10 (highest possible)) | 1 | 61 | Mean Difference (IV, Random, 95% CI) | 0.40 [‐0.21, 1.01] |
| 4.3 Physical fatigue in people with mild hepatic encephalopathy (0 (no fatigue) to 16 (highest possible)) | 1 | 61 | Mean Difference (IV, Random, 95% CI) | 0.20 [‐0.72, 1.12] |
| 4.4 Physical fatigue in people with moderate hepatic encephalopathy (0 (no fatigue) to 16 (highest possible)) | 1 | 61 | Mean Difference (IV, Random, 95% CI) | ‐0.20 [‐0.92, 0.52] |
| 5 Blood ammonium levels | 5 | 387 | Mean Difference (IV, Random, 95% CI) | ‐13.06 [‐17.24, ‐8.89] |
| 5.1 Mild hepatic encephalopathy | 1 | 61 | Mean Difference (IV, Random, 95% CI) | ‐13.00 [‐18.17, ‐7.83] |
| 5.2 Moderate hepatic encephalopathy | 1 | 60 | Mean Difference (IV, Random, 95% CI) | ‐11.30 [‐19.05, ‐3.55] |
| 5.3 Hepatic coma | 1 | 24 | Mean Difference (IV, Random, 95% CI) | ‐4.10 [‐10.77, 2.57] |
| 5.4 Minimal hepatic encephalopathy | 2 | 182 | Mean Difference (IV, Random, 95% CI) | ‐17.46 [‐21.63, ‐13.28] |
| 5.5 Severe hepatic encephalopathy | 1 | 60 | Mean Difference (IV, Random, 95% CI) | ‐13.80 [‐20.78, ‐6.82] |
| 6 Blood ammonium levels (sensitivity analysis according to missing data) | 5 | Mean Difference (IV, Random, 95% CI) | Subtotals only | |
| 6.1 Complete case analysis | 5 | 327 | Mean Difference (IV, Random, 95% CI) | ‐13.40 [‐18.31, ‐8.48] |
| 6.2 Strategy 1 | 5 | 342 | Mean Difference (IV, Random, 95% CI) | ‐12.88 [‐17.69, ‐8.06] |
| 6.3 Strategy 2 | 5 | 342 | Mean Difference (IV, Random, 95% CI) | ‐14.70 [‐20.23, ‐9.16] |
| 6.4 Strategy 3 | 5 | 342 | Mean Difference (IV, Random, 95% CI) | ‐14.06 [‐19.50, ‐8.62] |
| 6.5 Strategy 4 | 5 | 342 | Mean Difference (IV, Random, 95% CI) | ‐13.79 [‐18.99, ‐8.58] |
Characteristics of studies
Characteristics of included studies [ordered by study ID]
Malaguarnera 2006.
| Methods |
|
|
| Participants |
|
|
| Interventions |
|
|
| Outcomes |
|
|
| Notes |
|
|
| Risk of bias | ||
| Bias | Authors' judgement | Support for judgement |
| Random sequence generation (selection bias) | Low risk | Quote: "...a computer‐generated randomization schedule was used to assign..." (page 2243) |
| Allocation concealment (selection bias) | Unclear risk | The method used to conceal allocation is not described, so that intervention allocations may have been foreseen in advance of, or during, enrolment |
| Blinding of participants and personnel (performance bias) All outcomes | Unclear risk | Quote: "All evaluations were made blindly and independently by two observers (L.R., I.V.)" (page 2243) Information is insufficient to permit judgement of 'low risk' or 'high risk' Triai authors did not describe external appearance for both solutions |
| Blinding of outcome assessment (detection bias) All outcomes | Low risk | Quote: "All evaluations were made blindly and independently by two observers (L.R., I.V.)" (page 2243) Information was insufficient to permit judgement of 'low risk' or 'high risk' |
| Incomplete outcome data (attrition bias) All outcomes | Low risk | No participants were lost to follow‐up |
| Selective reporting (reporting bias) | High risk | Trial reported no relevant clinical outcome as expression of clinical benefits. However, trial reported adverse events |
| Other bias | High risk | Design bias: due to a large number of outcomes, the family‐wise error rate was substantially over the 5% level |
Malaguarnera 2008.
| Methods |
|
|
| Participants |
|
|
| Interventions |
|
|
| Outcomes |
This trial did not identify primary or secondary outcomes
|
|
| Notes |
|
|
| Risk of bias | ||
| Bias | Authors' judgement | Support for judgement |
| Random sequence generation (selection bias) | Unclear risk | Quote: "...were randomized either into group..." (page 3019) Information was insufficient to permit judgement of 'low risk' or 'high risk' |
| Allocation concealment (selection bias) | Unclear risk | Quote: "...were randomized either into the group..." (page 3019) Information was insufficient to permit judgement of 'low risk' or 'high risk' |
| Blinding of participants and personnel (performance bias) All outcomes | Low risk | Quote: "...administered drugs were identical in appearance..." (page 3019) Comment: taste information not provided Quote: "...neither investigators nor patients were informed of the selected agents at the end of the study" (page 3019‐20) |
| Blinding of outcome assessment (detection bias) All outcomes | Unclear risk | Quote: "...in double‐blind" (page 3019) There is no information on this item Information was insufficient to permit judgement of 'low risk' or 'high risk' |
| Incomplete outcome data (attrition bias) All outcomes | Low risk | Withdrawal: 8.69% (10/115)
Reasons: not supplied Inconsistency is evident between Figure 1 "(Patients' disposition ‐ CONSORT diagram)" and description reported in "Methods and Patients" section (page 3019) |
| Selective reporting (reporting bias) | High risk | Trial reported no relevant clinical outcome as expression of clinical benefits. However, trial reported adverse events |
| Other bias | High risk | Design bias: due to a large number of outcomes, the family‐wise error rate was substantially over the 5% level Allocation and confusion biases: unclear information on random sequence generation and allocation concealment |
Malaguarnera 2011a.
| Methods |
|
|
| Participants |
|
|
| Interventions |
|
|
| Outcomes |
Comment: trial authors did not mention depression and quality of life as endpoints of this trial despite its official title: "Acetyl‐L‐Carnitine Reduces Depression and Improves Quality of Life in Patients With Minimal Hepatic Encephalopathy"
Safety parameters on days 0, 30, and 60 |
|
| Notes |
|
|
| Risk of bias | ||
| Bias | Authors' judgement | Support for judgement |
| Random sequence generation (selection bias) | Low risk | Quote: "...computer‐generated randomization schedule..." (page 751) |
| Allocation concealment (selection bias) | Unclear risk | The method used to conceal allocation is not described so intervention allocations may have been foreseen in advance of, or during, enrolment |
| Blinding of participants and personnel (performance bias) All outcomes | Low risk | Quote: "...drugs and placebos were identical in appearance, and neither investigators nor patients were informed of the selected agent until the end of the study phase" (page 752) |
| Blinding of outcome assessment (detection bias) All outcomes | Unclear risk | No information was provided on this item Information was insufficient to permit judgement of 'low risk' or 'high risk' |
| Incomplete outcome data (attrition bias) All outcomes | Low risk | Withdrawal: 8.3% (6/72) |
| Selective reporting (reporting bias) | High risk | Trial reported information on quality of life. Trial did not report all‐cause mortality and adverse events |
| Other bias | High risk | Design bias: due to a large number of outcomes, the family‐wise error rate was substantially over the 5% level |
Malaguarnera 2011b.
| Methods |
|
|
| Participants |
|
|
| Interventions |
|
|
| Outcomes | Primary: changes in activity, motivation, and physical and mental fatigue severity | |
| Notes |
|
|
| Risk of bias | ||
| Bias | Authors' judgement | Support for judgement |
| Random sequence generation (selection bias) | Low risk | Quote: "Randomization was based on a computer generated list" |
| Allocation concealment (selection bias) | Unclear risk | The method used to conceal allocation was not described so that intervention allocations may have been foreseen in advance of, or during, enrolment |
| Blinding of participants and personnel (performance bias) All outcomes | Low risk | Quote: "... drugs and placebos were identical in appearance, and neither the investigators nor the patients were informed of the selected agent until the end of the study phase" (page 800) |
| Blinding of outcome assessment (detection bias) All outcomes | Unclear risk | No information on this item was provided Information was insufficient to permit judgement of 'low risk' or 'high risk' |
| Incomplete outcome data (attrition bias) All outcomes | Low risk | No participants were lost to follow‐up |
| Selective reporting (reporting bias) | High risk | No data on all‐cause mortality or quality of life were reported |
| Other bias | High risk | Design bias: due to a large number of outcomes, the family‐wise error rate was substantially over the 5% level Bias in the presentation of data: inconsistency exists in baseline data (Table 3, page 802). Data are shown only for experimental and placebo groups. Data by subgroup are not shown |
Malaguarnera 2011c.
| Methods |
|
|
| Participants |
|
|
| Interventions |
|
|
| Outcomes |
Outcomes not classified as primary or secondary
Quote: "effects on ammonia levels and performance in cognitive functions" (page 282) |
|
| Notes |
|
|
| Risk of bias | ||
| Bias | Authors' judgement | Support for judgement |
| Random sequence generation (selection bias) | Low risk | Quote: "...computer‐generated table of random numbers allocated in our central unit" (page 283) |
| Allocation concealment (selection bias) | Unclear risk | The method used to conceal allocation was not described so that intervention allocations may have been foreseen in advance of, or during, enrolment |
| Blinding of participants and personnel (performance bias) All outcomes | Low risk | Quote: "...drugs were identical in appearance, and neither investigators nor patients were informed of the selected agents at the end of the study" (page 283) |
| Blinding of outcome assessment (detection bias) All outcomes | Unclear risk | No information on this item was provided Information was insufficient to permit judgement of 'low risk' or 'high risk' |
| Incomplete outcome data (attrition bias) All outcomes | Low risk | Withdrawal: 1.63% (1/61). Reason was not reported |
| Selective reporting (reporting bias) | High risk | Trial reported no relevant clinical outcome as expression of clinical benefits. However, it reported adverse events |
| Other bias | High risk | Design bias: due to a large number of outcomes, the family‐wise error rate was substantially over the 5% level |
BUN: blood urea nitrogen. COWAT: Controlled Oral Word Association Test. EEG: electroencephalogram. EMQ: Everyday Memory Questionnaire. HE: hepatic encephalopathy. JLO: Judgement of Line Orientation. MMSE: Mini Mental State Examination. NA: not applicable. PCO₂: partial pressure of carbon dioxide. PO₂: partial pressure of oxygen. SD: standard deviation. SF‐36: Short Form‐36. TMT: Trail Making Test. WHO: World Health Organization.
Characteristics of excluded studies [ordered by study ID]
| Study | Reason for exclusion |
|---|---|
| Jiang 2013 | Meta‐analysis |
| Malaguarnera 2014 | Randomised clinical trial including no participants with hepatic encephalopathy |
| Siciliano 2006 | Controlled clinical trial including cirrhotic patients with hepatic encephalopathy ‐ not a randomised trial |
Characteristics of ongoing studies [ordered by study ID]
NCT02173132.
| Trial name or title | Acetyl‐L‐carnitine reduces perceived work stress and improves work ability and work performance in hepatic encephalopathy |
| Methods |
|
| Participants |
|
| Interventions |
|
| Outcomes |
|
| Starting date | April 2010 |
| Contact information |
|
| Notes |
|
Differences between protocol and review
We added 'Fatigue' because it is an important disability among people with hepatic encephalopathy
We were not able to search the Chinese BioMedical Database, Traditional Chinese Medical Literature Analysis and Retrieval System, China National Knowledge Infrastructure, Chinese VIP Information, Chinese Academic Conference Papers Database, and Chinese Dissertation Database
We adapted Trial Sequential Analysis to the recommendations described in Wetterslev 2017
We searched the Food and Drug Administraion and European Medicines Agency web sites for unpublished trials
We updated definitions in the assessment of risk of bias regarding 'Blinding of participants, personnel, and outcome assessors' according to hbg.cochrane.org/information‐authors
We included the threshold for clinical relevance as Bayes factor
We included estimations of prediction intervals
We added estimations of ratio of means
We added sensitivity analysis by missing data to improve information on non‐serious adverse events and blood ammonium levels, although these are secondary outcomes
Contributions of authors
Arturo Marti‐Carvajal drafted the review. Christian Gluud revised the review. Ingrid Arévalo Rodríguez revised the review and checked Risk of bias in included studies, Characteristics of included studies, and Characteristics of excluded studies, Cristina Martí‐Amarista checked double‐entry data and Risk of bias in included studies, Characteristics of included studies, and Characteristics of excluded studies.
All review authors approved this systematic review for publication.
Sources of support
Internal sources
No sources of support supplied
External sources
-
Cochrane Hepato‐Biliary Group, Denmark.
Academic and financial
-
Iberoamerican Cochrane Centre, Spain.
Academic
Declarations of interest
In 2004 and 2007, Arturo Martí‐Carvajal was employed by Eli Lilly to run a four‐hour workshop on "How to critically appraise clinical trials on osteoporosis and how to teach this". This activity was not related to Arturo Martí‐Carvajal's work with The Cochrane Collaboration or any other Cochrane Review. Christian Gluud: none known. Ingrid Arevalo‐Rodriguez: none known. However, see "Acknowledements". Cristina Martí‐Amarista: none known.
New
References
References to studies included in this review
Malaguarnera 2006 {published data only}
- Malaguarnera M, Pistone G, Astuto M, Vecchio I, Raffaele R, Lo Giudice E, et al. Effects of L‐acetylcarnitine on cirrhotic patients with hepatic coma: randomized double‐blind, placebo‐controlled trial. Digestive Diseases and Sciences 2006;51(12):2242‐7. [PUBMED: 17080254] [DOI] [PubMed] [Google Scholar]
Malaguarnera 2008 {published data only}
- Malaguarnera M, Gargante MP, Cristaldi E, Vacante M, Risino C, Cammalleri L, et al. Acetyl‐L‐carnitine treatment in minimal hepatic encephalopathy. Digestive Diseases and Sciences 2008;53(11):3018‐25. [PUBMED: 18357530] [DOI] [PubMed] [Google Scholar]
Malaguarnera 2011a {published data only}
- Malaguarnera M, Bella R, Vacante M, Giordano M, Malaguarnera G, Gargante MP, et al. Acetyl‐L‐carnitine reduces depression and improves quality of life in patients with minimal hepatic encephalopathy. Scandinavian Journal of Gastroenterology 2011;46(6):750‐9. [PUBMED: 21443422] [DOI] [PubMed] [Google Scholar]
Malaguarnera 2011b {published data only}
- Malaguarnera M, Vacante M, Giordano M, Pennisi G, Bella R, Rampello L, et al. Oral acetyl‐L‐carnitine therapy reduces fatigue in overt hepatic encephalopathy: a randomized, double‐blind, placebo‐controlled study. American Journal of Clinical Nutrition 2011;93(4):799‐808. [PUBMED: 21310833] [DOI] [PubMed] [Google Scholar]
Malaguarnera 2011c {published data only}
- Malaguarnera M, Vacante M, Motta M, Giordano M, Malaguarnera G, Bella R, et al. Acetyl‐L‐carnitine improves cognitive functions in severe hepatic encephalopathy: a randomized and controlled clinical trial. Metabolic Brain Disease 2011;26(4):281‐9. [PUBMED: 21870121] [DOI] [PubMed] [Google Scholar]
References to studies excluded from this review
Jiang 2013 {published data only}
- Jiang Q, Jiang G, Shi KQ, Cai H, Wang YX, Zheng MH. Oral acetyl‐L‐carnitine treatment in hepatic encephalopathy: view of evidence‐based medicine. Annals of Hepatology 2013;12(5):803‐9. [PUBMED: 24018499] [PubMed] [Google Scholar]
Malaguarnera 2014 {published data only}
- Malaguarnera G, Pennisi M, Gagliano C, Vacante M, Malaguarnera M, Salomone S, et al. Acetyl‐L‐carnitine supplementation during HCV therapy with pegylated interferon‐α 2b plus ribavirin: effect on work performance; a randomized clinical trial. Hepatitis Monthly 2014;14(5):e11608. [PUBMED: 24910702] [DOI] [PMC free article] [PubMed] [Google Scholar]
Siciliano 2006 {published data only}
- Siciliano M, Annicchiarico BE, Lucchese F, Bombardieri G. Effects of a single, short intravenous dose of acetyl‐L‐carnitine on pattern‐reversal visual‐evoked potentials in cirrhotic patients with hepatic encephalopathy. Clinical and Experimental Pharmacology and Physiology 2006;33(1‐2):76‐80. [PUBMED: 16445703] [DOI] [PubMed] [Google Scholar]
References to ongoing studies
NCT02173132 {published data only}
- Acetyl‐L‐carnitine reduces perceived work stress and improves work ability and work performance in hepatic encephalopathy. Ongoing study April 2010.
Additional references
Als‐Nielsen 2004
- Als‐Nielsen B, Gluud LL, Gluud C. Benzodiazepine receptor antagonists for hepatic encephalopathy. Cochrane Database of Systematic Reviews 2004, Issue 2. [DOI: 10.1002/14651858.CD002798.pub2] [DOI] [PubMed] [Google Scholar]
Altman 1995
- Altman DG, Bland JM. Absence of evidence is not evidence of absence. BMJ (Clinical Research Ed.) 1995;311(7003):485. [PUBMED: 7647644] [DOI] [PMC free article] [PubMed] [Google Scholar]
Arunachalam 2016
- Arunachalam L, Hunter IA, Killeen S. Reporting of randomized controlled trials with statistically nonsignificant primary outcomes published in high‐impact surgical journals. Annals of Surgery 2016;265(6):1141‐5. [PUBMED: 27257737] [DOI] [PubMed] [Google Scholar]
Backmann 2017
Bajaj 2017
- Bajaj JS, O'Leary JG, Tandon P, Wong F, Garcia‐Tsao G, Kamath PS, et al. Hepatic encephalopathy Is associated with mortality in patients with cirrhosis independent of other extrahepatic organ failures. Clinical Gastroenterology and Hepatology 2017;15(4):565‐74.e4. [PUBMED: 27720916] [DOI] [PubMed] [Google Scholar]
Balshem 2011
- Balshem H, Helfand M, Schunemann HJ, Oxman AD, Kunz R, Brozek J, et al. GRADE guidelines: 3. Rating the quality of evidence. Journal of Clinical Epidemiology 2011;64(4):401‐6. [PUBMED: 21208779] [DOI] [PubMed] [Google Scholar]
Basu 2015
- Basu PP, Shah NJ. Clinical and neurologic manifestation of minimal hepatic encephalopathy and overt hepatic encephalopathy. Clinics in Liver Disease 2015;19(3):461‐72. [PUBMED: 26195201] [DOI] [PubMed] [Google Scholar]
Berger 2008
- Berger VW, Matthews JR, Grosch EN. On improving research methodology in clinical trials. Statistical Methods in Medical Research 2008;17(3):231‐42. [PUBMED: 17925317] [DOI] [PubMed] [Google Scholar]
Borenstein 2017
- Borenstein M, Higgins JP, Hedges LV, Rothstein HR. Basics of meta‐analysis: I2 is not an absolute measure of heterogeneity. Research Synthesis Methods 2017;8(1):5‐18. [PUBMED: 28058794] [DOI] [PubMed] [Google Scholar]
Boutron 2010
- Boutron I, Dutton S, Ravaud P, Altman DG. Reporting and interpretation of randomized controlled trials with statistically nonsignificant results for primary outcomes. JAMA 2010;303(20):2058‐64. [PUBMED: 20501928] [DOI] [PubMed] [Google Scholar]
Brok 2008
- Brok J, Thorlund K, Gluud C, Wetterslev J. Trial sequential analysis reveals insufficient information size and potentially false positive results in many meta‐analyses. Journal of Clinical Epidemiology 2008;61(8):763‐9. [PUBMED: 18411040] [DOI] [PubMed] [Google Scholar]
Brok 2009
- Brok J, Thorlund K, Wetterslev J, Gluud C. Apparently conclusive meta‐analyses may be inconclusive ‐ trial sequential analysis adjustment of random error risk due to repetitive testing of accumulating data in apparently conclusive neonatal meta‐analyses. International Journal of Epidemiology 2009;38(1):287‐98. [PUBMED: 18824466] [DOI] [PubMed] [Google Scholar]
Brookes 2001
- Brookes ST, Whitley E, Peters TJ, Mulheran PA, Egger M, Davey Smith G. Subgroup analyses in randomised controlled trials: quantifying the risks of false‐positives and false‐negatives. Health Technology Assessment 2001;5(33):1‐56. [PUBMED: 11701102] [DOI] [PubMed] [Google Scholar]
Castellini 2018
- Castellini G, Bruschettini M, Gianola S, Gluud C, Moja L. Assessing imprecision in Cochrane systematic reviews: a comparison of GRADE and Trial Sequential Analysis. Systematic Reviews 2018;7(1):110. [PUBMED: 30055658] [DOI] [PMC free article] [PubMed] [Google Scholar]
Chaimani 2014
Chalder 1993
- Chalder T, Berelowitz G, Pawlikowska T, Watts L, Wessely S, Wright D, et al. Development of a fatigue scale. Journal of Psychosomatic Research 1993;37(2):147‐53. [PUBMED: 8463991] [DOI] [PubMed] [Google Scholar]
Chan 2013
- Chan AW, Tetzlaff JM, Altman DG, Laupacis A, Gotzsche PC, Krleza‐Jeric K, et al. SPIRIT 2013 statement: defining standard protocol items for clinical trials. Annals of Internal Medicine 2013;158(3):200‐7. [PUBMED: 23295957] [DOI] [PMC free article] [PubMed] [Google Scholar]
Ciapponi 2011
- Ciapponi A, Glujovsky D, Bardach A, García Martí S, Comande D. EROS: a new software for early stage of systematic reviews. ISPOR 3rd Latin America Conference. Mexico City: Hilton Mexico City Reforma, 2011.
Clarke 2007
- Clarke M. Standardising outcomes for clinical trials and systematic reviews. Trials 2007;8:39. [PUBMED: 18039365] [DOI] [PMC free article] [PubMed] [Google Scholar]
Conn 1977
- Conn HO. Trailmaking and number‐connection tests in the assessment of mental state in portal systemic encephalopathy. American Journal of Digestive Diseases 1977;22(6):541‐50. [PUBMED: 868833] [DOI] [PubMed] [Google Scholar]
Dalal 2017
- Dalal R, McGee RG, Riordan SM, Webster AC. Probiotics for people with hepatic encephalopathy. Cochrane Database of Systematic Reviews 2017, Issue 2. [DOI: 10.1002/14651858.CD008716.pub3] [DOI] [PMC free article] [PubMed] [Google Scholar]
De Rui 2016
- Rui M, Montagnese S, Amodio P. Recent developments in the diagnosis and treatment of covert/minimal hepatic encephalopathy. Expert Review of Gastroenterology and Hepatology 2016;10(4):443‐50. [PUBMED: 26758861] [DOI] [PubMed] [Google Scholar]
Dechartres 2011
- Dechartres A, Boutron I, Trinquart L, Charles P, Ravaud P. Single‐center trials show larger treatment effects than multicenter trials: evidence from a meta‐epidemiologic study. Annals of Internal Medicine 2011;155(1):39‐51. [PUBMED: 21727292] [DOI] [PubMed] [Google Scholar]
Delorme 2016
- Delorme P, Micheaux PL, Liquet B, Riou J. Type‐II generalized family‐wise error rate formulas with application to sample size determination. Statistics in Medicine 2016;35(16):2687‐714. [PUBMED: 26914402] [DOI] [PubMed] [Google Scholar]
Dienes 2014
- Dienes Z. Using Bayes to get the most out of non‐significant results. Frontiers in Psychology 2014;5:781. [PUBMED: 25120503] [DOI] [PMC free article] [PubMed] [Google Scholar]
Dwan 2013
- Dwan K, Gamble C, Williamson PR, Kirkham JJ. Systematic review of the empirical evidence of study publication bias and outcome reporting bias ‐ an updated review. PloS One 2013;8(7):e66844. [PUBMED: 23861749] [DOI] [PMC free article] [PubMed] [Google Scholar]
Falavigna 2007
- Falavigna M, Kieling C, Wolff FH, Medeiros LRF, Cheinquer H. Antibiotics for hepatic encephalopathy. Cochrane Database of Systematic Reviews 2007, Issue 1. [DOI: 10.1002/14651858.CD006314] [DOI] [Google Scholar]
FDA 2016
- Food, Drug Administration. FDA briefing document. Pharmacy Compounding Advisory Committee (PCAC) meeting. www.fda.gov/AdvisoryCommittees/CommitteesMeetingMaterials/Drugs/PharmacyCompoundingAdvisoryCommittee/ucm486144.htm 2016 (accessed 19 March 2017).
Felipo 2013
- Felipo V. Hepatic encephalopathy: effects of liver failure on brain function. Nature Reviews. Neuroscience 2013;14(12):851‐8. [PUBMED: 24149188] [DOI] [PubMed] [Google Scholar]
Fermi Paradox 1950
- Fermi Paradox. www.crystalinks.com/fermiparadox.html (accessed 19 March 2017).
Fleurence 2015
- Fleurence R, Whicher D, Dunham K, Gerson J, Newhouse R, Luce B. The patient‐centered outcomes research institute's role in advancing methods for patient‐centered outcomes research. Medical Care 2015;53(1):2‐8. [PUBMED: 25334055] [DOI] [PMC free article] [PubMed] [Google Scholar]
Follmann 1995
- Follmann D. Multivariate tests for multiple endpoints in clinical trials. Statistics in Medicine 1995;14(11):1163‐75. [PUBMED: 7667558] [DOI] [PubMed] [Google Scholar]
Frederick 2011
- Frederick RT. Current concepts in the pathophysiology and management of hepatic encephalopathy. Gastroenterology & Hepatology 2011;7(4):222‐33. [PUBMED: 21857820] [PMC free article] [PubMed] [Google Scholar]
Friedrich 2008
- Friedrich JO, Adhikari NK, Beyene J. The ratio of means method as an alternative to mean differences for analyzing continuous outcome variables in meta‐analysis: a simulation study. BMC Medical Research Methodology 2008;8:32. [PUBMED: 18492289] [DOI] [PMC free article] [PubMed] [Google Scholar]
Friedrich 2011
- Friedrich JO, Adhikari NK, Beyene J. Ratio of means for analyzing continuous outcomes in meta‐analysis performed as well as mean difference methods. Journal of Clinical Epidemiology 2011;64(5):556‐64. [PUBMED: 21447428] [DOI] [PubMed] [Google Scholar]
Frontera 2014
- Frontera JA. Management of hepatic encephalopathy. Current Treatment Options in Neurology 2014;16(6):297. [PUBMED: 24807164] [DOI] [PubMed] [Google Scholar]
Gamble 2005
- Gamble C, Hollis S. Uncertainty method improved on best‐worst case analysis in a binary meta‐analysis. Journal of Clinical Epidemiology 2005;58(6):579‐88. [PUBMED: 15878471] [DOI] [PubMed] [Google Scholar]
Gartlehner 2018
- Gartlehner G, Nussbaumer‐Streit B, Wagner G, Patel S, Swinson‐Evans T, Dobrescu A, et al. Increased risks for random errors are common in outcomes graded as high certainty of evidence. Journal of Clinical Epidemiology 2018 Oct 18 [Epub ahead of print]. [DOI: 10.1016/j.jclinepi.2018.10.009] [DOI] [PubMed]
Gaskin 2014
- Gaskin CJ, Happell B. Power, effects, confidence, and significance: an investigation of statistical practices in nursing research. International Journal of Nursing Studies 2014;51(5):795‐806. [PUBMED: 24207028] [DOI] [PubMed] [Google Scholar]
Gluud 2007
- Gluud C, Brok J, Gong Y, Koretz RL. Hepatology may have problems with putative surrogate outcome measures. Journal of Hepatology 2007;46(4):734‐42. [PUBMED: 17316871] [DOI] [PubMed] [Google Scholar]
Gluud 2016
- Gluud LL, Vilstrup H, Morgan MY. Non‐absorbable disaccharides versus placebo/no intervention and lactulose versus lactitol for the prevention and treatment of hepatic encephalopathy in people with cirrhosis. Cochrane Database of Systematic Reviews 2016, Issue 4. [DOI: 10.1002/14651858.CD003044.pub4] [DOI] [PubMed] [Google Scholar]
Gluud 2017
- Gluud LL, Dam 2, Les I, Marchesini G, Borre M, Aagaard NK, Vilstrup H. Branched‐chain amino acids for people with hepatic encephalopathy. Cochrane Database of Systematic Reviews 2017, Issue 5. [DOI: 10.1002/14651858.CD001939.pub4] [DOI] [PMC free article] [PubMed] [Google Scholar]
Goodman 1999
- Goodman SN. Toward evidence‐based medical statistics. 2: the Bayes factor. Annals of Internal Medicine 1999;130(12):1005‐13. [PUBMED: 10383350] [DOI] [PubMed] [Google Scholar]
Goodman 2005
- Goodman SN. Introduction to Bayesian methods I: measuring the strength of evidence. Clinical Trials 2005;2(4):282‐90; discussion 301‐4, 364‐78. [PUBMED: 16281426] [DOI] [PubMed] [Google Scholar]
GRADEpro [Computer program]
- McMaster University (developed by Evidence Prime). GRADEpro. Version accessed 4 December 2018. Hamilton (ON): McMaster University (developed by Evidence Prime), 2015.
Guyatt 2011a
- Guyatt G, Oxman AD, Akl EA, Kunz R, Vist G, Brozek J, et al. GRADE guidelines: 1: introduction ‐ GRADE evidence profiles and summary of findings tables. Journal of Clinical Epidemiology 2011;64(4):383‐94. [PUBMED: 21195583] [DOI] [PubMed] [Google Scholar]
Guyatt 2011b
- Guyatt GH, Oxman AD, Kunz R, Atkins D, Brozek J, Vist G, et al. GRADE guidelines: 2: framing the question and deciding on important outcomes. Journal of Clinical Epidemiology 2011;64(4):395‐400. [PUBMED: 21194891] [DOI] [PubMed] [Google Scholar]
Guyatt 2011c
- Guyatt GH, Oxman AD, Vist G, Kunz R, Brozek J, Alonso‐Coello P, et al. GRADE guidelines: 4: rating the quality of evidence ‐ study limitations (risk of bias). Journal of Clinical Epidemiology 2011;64(4):407‐15. [PUBMED: 21247734] [DOI] [PubMed] [Google Scholar]
Guyatt 2011d
- Guyatt GH, Oxman AD, Montori V, Vist G, Kunz R, Brozek J, et al. GRADE guidelines: 5: rating the quality of evidence ‐ publication bias. Journal of Clinical Epidemiology 2011;64(12):1277‐82. [PUBMED: 21802904] [DOI] [PubMed] [Google Scholar]
Guyatt 2011e
- Guyatt GH, Oxman AD, Kunz R, Brozek J, Alonso‐Coello P, Rind D, et al. GRADE guidelines: 6: rating the quality of evidence ‐ imprecision. Journal of Clinical Epidemiology 2011;64(12):1283‐93. [PUBMED: 21839614] [DOI] [PubMed] [Google Scholar]
Guyatt 2011f
- Guyatt GH, Oxman AD, Kunz R, Woodcock J, Brozek J, Helfand M, et al. GRADE guidelines: 7: rating the quality of evidence ‐ inconsistency. Journal of Clinical Epidemiology 2011;64(12):1294‐302. [PUBMED: 21803546] [DOI] [PubMed] [Google Scholar]
Guyatt 2011g
- Guyatt GH, Oxman AD, Kunz R, Woodcock J, Brozek J, Helfand M, et al. GRADE guidelines: 8: rating the quality of evidence ‐ indirectness. Journal of Clinical Epidemiology 2011;64(12):1303‐10. [PUBMED: 21802903] [DOI] [PubMed] [Google Scholar]
Guyatt 2011h
- Guyatt GH, Oxman AD, Sultan S, Glasziou P, Akl EA, Alonso‐Coello P, et al. GRADE guidelines: 9: rating up the quality of evidence. Journal of Clinical Epidemiology 2011;64(12):1311‐6. [PUBMED: 21802902] [DOI] [PubMed] [Google Scholar]
Guyatt 2013a
- Guyatt G, Oxman AD, Sultan S, Brozek J, Glasziou P, Alonso‐Coello P, et al. GRADE guidelines: 11: making an overall rating of confidence in effect estimates for a single outcome and for all outcomes. Journal of Clinical Epidemiology 2013;66(2):151‐7. [DOI] [PubMed] [Google Scholar]
Guyatt 2013b
- Guyatt GH, Oxman AD, Santesso N, Helfand M, Vist G, Kunz R, et al. GRADE guidelines: 12: preparing Summary of Findings tables ‐ binary outcomes. Journal of Clinical Epidemiology 2013;66(2):158‐72. [DOI] [PubMed] [Google Scholar]
Guyatt 2013c
- Guyatt GH, Thorlund K, Oxman AD, Walter SD, Patrick D, Furukawa TA, et al. GRADE guidelines: 13: preparing Summary of Findings tables ‐ continuous outcomes. Journal of Clinical Epidemiology 2013;66(2):173‐83. [DOI] [PubMed] [Google Scholar]
Guyatt 2013d
- Guyatt G, Andrews J, Oxman AD, Alderson P, Dahm P, Falck‐Ytter Y, et al. GRADE guidelines: 15. going from evidence to recommendations: the significance and presentation of recommendations. Journal of Clinical Epidemiology 2013;66(7):719‐25. [DOI] [PubMed] [Google Scholar]
Guyatt 2017
- Guyatt GH, Ebrahim S, Alonso‐Coello P, Johnston BC, Mathioudakis AG, Briel M, et al. GRADE guidelines 17: assessing the risk of bias associated with missing participant outcome data in a body of evidence. Journal of Clinical Epidemiology 2017;87:14‐22. [PUBMED: 28529188] [DOI] [PubMed] [Google Scholar]
Hempel 2012
- Hempel S, Miles J, Suttorp MJ, Wang Z, Johnsen B, Morton S, et al. Detection of associations between trial quality and effect sizes. www.ncbi.nlm.nih.gov/books/NBK84249/pdf/Bookshelf_NBK84249.pdf 2012 (accessed 6 June 2017). [PUBMED: 22359777] [PubMed]
Hempel 2013
- Hempel S, Miles JN, Booth MJ, Wang Z, Morton SC, Shekelle PG. Risk of bias: a simulation study of power to detect study‐level moderator effects in meta‐analysis. Systematic Reviews 2013;2:107. [PUBMED: 24286208] [DOI] [PMC free article] [PubMed] [Google Scholar]
Henderson 2015
- Henderson PK, Herrera JL. Should we treat minimal/covert hepatic encephalopathy, and with what?. Clinics in Liver Disease 2015;19(3):487‐95. [PUBMED: 26195203] [DOI] [PubMed] [Google Scholar]
Heneghan 2017
- Heneghan C, Goldacre B, Mahtani KR. Why clinical trial outcomes fail to translate into benefits for patients. Trials 2017; Vol. 18, issue 1:122. [PUBMED: 28288676] [DOI] [PMC free article] [PubMed]
Higgins 2003
- Higgins JP, Thompson SG, Deeks JJ, Altman DG. Measuring inconsistency in meta‐analyses. BMJ (Clinical Research Ed.) 2003;327(7414):557‐60. [PUBMED: 12958120] [DOI] [PMC free article] [PubMed] [Google Scholar]
Higgins 2011
- Higgins JPT, Green S (editors). Cochrane Handbook for Systematic Reviews of Interventions Version 5.1.0 (updated March 2011). The Cochrane Collaboration, 2011. Available from www.cochrane‐handbook.org.
Hollis 1999
- Hollis S, Campbell F. What is meant by intention to treat analysis? Survey of published randomised controlled trials. BMJ (Clinical Research Ed.) 1999;319(7211):670‐4. [PUBMED: 10480822] [DOI] [PMC free article] [PubMed] [Google Scholar]
Hróbjartsson 2010
- Hróbjartsson AA, Gøtzsche PC. Placebo interventions for all clinical conditions. Cochrane Database of Systematic Reviews 2010, Issue 1. [DOI: 10.1002/14651858.CD003974.pub3] [DOI] [PMC free article] [PubMed] [Google Scholar]
ICH‐GCP 1997
- International Conference on Harmonisation Expert Working Group. International conference on harmonisation of technical requirements for registration of pharmaceuticals for human use. ICH harmonised tripartite guideline. Guideline for good clinical practice CFR & ICH Guidelines. Vol. 1, Philadelphia (PA): Barnett International/PAREXEL, 1997. [Google Scholar]
Imberger 2015
- Imberger G, Gluud C, Boylan J, Wetterslev J. Systematic reviews of anesthesiologic interventions reported as statistically significant: problems with power, precision, and type 1 error protection. Anesthesia and Analgesia 2015;121(6):1611‐22. [PUBMED: 26579662] [DOI] [PubMed] [Google Scholar]
Imberger 2016
- Imberger G, Thorlund K, Gluud C, Wetterslev J. False‐positive findings in Cochrane meta‐analyses with and without application of trial sequential analysis: an empirical review. BMJ Open 2016;6(8):e011890. [PUBMED: 27519923] [DOI] [PMC free article] [PubMed] [Google Scholar]
IntHout 2016
- IntHout J, Ioannidis JP, Rovers MM, Goeman JJ. Plea for routinely presenting prediction intervals in meta‐analysis. BMJ Open 2016;6(7):e010247. [PUBMED: 27406637] [DOI] [PMC free article] [PubMed] [Google Scholar]
Ioannidis 2004
- Ioannidis JP, Evans SJ, Gotzsche PC, O'Neill RT, Altman DG, Schulz K, et al. Better reporting of harms in randomized trials: an extension of the CONSORT statement. Annals of Internal Medicine 2004;141(10):781‐8. [PUBMED: 15545678] [DOI] [PubMed] [Google Scholar]
Ioannidis 2009
Ioannidis 2010
- Ioannidis JP. Meta‐research: the art of getting it wrong. Research Synthesis Methods 2010;1(3‐4):169‐84. [DOI] [PubMed] [Google Scholar]
Ioannidis 2017a
- Ioannidis JP, Bossuyt PM. Waste, leaks, and failures in the biomarker pipeline. Clinical Chemistry 2017;63(5):963‐72. [PUBMED: 28270433] [DOI] [PubMed] [Google Scholar]
Ioannidis 2017b
- Ioannidis JP, Caplan AL, Dal‐Re R. Outcome reporting bias in clinical trials: why monitoring matters. BMJ (Clinical Research Ed.) 2017;356:j408. [PUBMED: 28196819] [DOI] [PubMed] [Google Scholar]
Jakobsen 2014a
- Jakobsen JC, Wetterslev J, Winkel P, Lange T, Gluud C. Thresholds for statistical and clinical significance in systematic reviews with meta‐analytic methods. BMC Medical Research Methodology 2014;14:120. [PUBMED: 25416419] [DOI] [PMC free article] [PubMed] [Google Scholar]
Jakobsen 2014b
- Jakobsen JC, Gluud C, Winkel P, Lange T, Wetterslev J. The thresholds for statistical and clinical significance ‐ a five‐step procedure for evaluation of intervention effects in randomised clinical trials. BMC Medical Research Methodology 2014;14:34. [PUBMED: 24588900] [DOI] [PMC free article] [PubMed] [Google Scholar]
Junker 2014
- Junker AE, Als‐Nielsen B, Gluud C, Gluud LL. Dopamine agents for hepatic encephalopathy. Cochrane Database of Systematic Reviews 2014, Issue 2. [DOI: 10.1002/14651858.CD003047.pub3] [DOI] [PMC free article] [PubMed] [Google Scholar]
Kimer 2015
- Kimer N, Krag A, Bendtsen F, Møller S, Gluud LL. Rifaximin for people with hepatic encephalopathy. Cochrane Database of Systematic Reviews 2015, Issue 3. [DOI: 10.1002/14651858.CD011585] [DOI] [Google Scholar]
Kirkham 2010
- Kirkham JJ, Dwan KM, Altman DG, Gamble C, Dodd S, Smyth R, et al. The impact of outcome reporting bias in randomised controlled trials on a cohort of systematic reviews. BMJ (Clinical Research Ed.) 2010;340:c365. [PUBMED: 20156912] [DOI] [PubMed] [Google Scholar]
Kjaergard 2001
- Kjaergard LL, Villumsen J, Gluud C. Reported methodologic quality and discrepancies between large and small randomized trials in meta‐analyses. Annals of Internal Medicine 2001;135(11):982‐9. [PUBMED: 11730399] [DOI] [PubMed] [Google Scholar]
Krähenbühl 1996
- Krähenbühl S. Carnitine metabolism in chronic liver disease. Life Sciences 1996;59(19):1579‐99. [PUBMED: 8913324] [DOI] [PubMed] [Google Scholar]
Krähenbühl 1997
- Krähenbühl S, Reichen J. Carnitine metabolism in patients with chronic liver disease. Hepatology (Baltimore, Md.) 1997;25(1):148‐53. [PUBMED: 8985281] [DOI] [PubMed] [Google Scholar]
Lan 1983
- Lan GKK, DeMets DL. Discrete sequential boundaries for clinical trials. Biometrika 1983;70(3):659‐63. [DOI: 10.1093/biomet/70.3.659] [DOI] [Google Scholar]
Leise 2014
- Leise MD, Poterucha JJ, Kamath PS, Kim WR. Management of hepatic encephalopathy in the hospital. Mayo Clinic Proceedings 2014;89(2):241‐53. [PUBMED: 24411831] [DOI] [PMC free article] [PubMed] [Google Scholar]
Lin 2015
- Lin R, Yin G. Bayes factor and posterior probability: complementary statistical evidence to p‐value. Contemporary Clinical Trials 2015;44:33‐5. [PUBMED: 26212520] [DOI] [PubMed] [Google Scholar]
Liou 2014
- Liou IW. Management of end‐stage liver disease. Medical Clinics of North America 2014;98(1):119‐52. [PUBMED: 24266918] [DOI] [PubMed] [Google Scholar]
Lundh 2017
- Lundh A, Sismondo S, Lexchin J, Busuioc OA, Bero L. Industry sponsorship and research outcome. Cochrane Database of Systematic Reviews 2017, Issue 2. [DOI: 10.1002/14651858.MR000033.pub3] [DOI] [PMC free article] [PubMed] [Google Scholar]
Malaguarnera 2012
- Malaguarnera M. Carnitine derivatives: clinical usefulness. Current Opinion in Gastroenterology 2012;28(2):166‐76. [PUBMED: 22333562] [DOI] [PubMed] [Google Scholar]
Malaguarnera 2013
- Malaguarnera M. Acetyl‐L‐carnitine in hepatic encephalopathy. Metabolic Brain Disease 2013;28(2):193‐9. [PUBMED: 23389620] [DOI] [PubMed] [Google Scholar]
Marti‐Carvajal 2015
- Marti‐Carvajal AJ, Sola I, Lathyris D. Homocysteine‐lowering interventions for preventing cardiovascular events. Cochrane Database of Systematic Reviews 2015, Issue 1. [DOI: 10.1002/14651858.CD006612.pub4; PUBMED: 25590290] [DOI] [PubMed] [Google Scholar]
McPhail 2010
- McPhail MJ, Bajaj JS, Thomas HC, Taylor‐Robinson SD. Pathogenesis and diagnosis of hepatic encephalopathy. Expert Review of Gastroenterology & Hepatology 2010;4(3):365‐78. [PUBMED: 20528123] [DOI] [PubMed] [Google Scholar]
Moher 1995
- Moher D, Jadad AR, Nichol G, Penman M, Tugwell P, Walsh S. Assessing the quality of randomized controlled trials: an annotated bibliography of scales and checklists. Controlled Clinical Trials 1995;16(1):62‐73. [PUBMED: 7743790] [DOI] [PubMed] [Google Scholar]
Moher 1998
- Moher D, Pham B, Jones A, Cook DJ, Jadad AR, Moher M, et al. Does quality of reports of randomised trials affect estimates of intervention efficacy reported in meta‐analyses?. Lancet 1998;352(9128):609‐13. [PUBMED: 9746022] [DOI] [PubMed] [Google Scholar]
Munoz 2008
- Munoz SJ. Hepatic encephalopathy. Medical Clinics of North America 2008;92(4):795‐812, viii. [PUBMED: 18570943] [DOI] [PubMed] [Google Scholar]
Mustafa 2013
- Mustafa RA, Santesso N, Brozek J, Akl EA, Walter SD, Norman G, et al. The GRADE approach is reproducible in assessing the quality of evidence of quantitative evidence syntheses. Journal of Clinical Epidemiology 2013;66(7):736‐42; quiz 742.e1‐5. [PUBMED: 23623694] [DOI] [PubMed] [Google Scholar]
Nardone 2016
- Nardone R, Taylor AC, Holler Y, Brigo F, Lochner P, Trinka E. Minimal hepatic encephalopathy: a review. Neuroscience Research 2016;111:1‐12. [PUBMED: 27153746] [DOI] [PubMed] [Google Scholar]
Nguyen 2017
- Nguyen TL, Collins GS, Lamy A, Devereaux PJ, Daures JP, Landais P, et al. Simple randomization did not protect against bias in smaller trials. Journal of Clinical Epidemiology 2017;84:105‐13. [PUBMED: 28257927] [DOI] [PubMed] [Google Scholar]
Nusrat 2014
- Nusrat S, Khan MS, Fazili J, Madhoun MF. Cirrhosis and its complications: evidence based treatment. World Journal of Gastroenterology 2014;20(18):5442‐60. [PUBMED: 24833875] [DOI] [PMC free article] [PubMed] [Google Scholar]
Nuzzo 2014
Page 2014
- Page MJ, McKenzie JE, Kirkham J, Dwan K, Kramer S, Green S, et al. Bias due to selective inclusion and reporting of outcomes and analyses in systematic reviews of randomised trials of healthcare interventions. Cochrane Database of Systematic Reviews 2014, Issue 10. [DOI: 10.1002/14651858.MR000035.pub2; PUBMED: 25271098] [DOI] [PMC free article] [PubMed] [Google Scholar]
Partlett 2017
- Partlett C, Riley RD. Random effects meta‐analysis: coverage performance of 95% confidence and prediction intervals following REML estimation. Statistics in Medicine 2017;36(2):301‐17. [PUBMED: 27714841] [DOI] [PMC free article] [PubMed] [Google Scholar]
Patidar 2015
- Patidar KR, Bajaj JS. Covert and overt hepatic encephalopathy: diagnosis and management. Clinical Gastroenterology and Hepatology 2015;13(12):2048‐61. [PUBMED: 26164219] [DOI] [PMC free article] [PubMed] [Google Scholar]
Perazzo 2012
- Perazzo JC, Tallis S, Delfante A, Souto PA, Lemberg A, Eizayaga FX, et al. Hepatic encephalopathy: an approach to its multiple pathophysiological features. World Journal of Hepatology 2012;4(3):50‐65. [PUBMED: 22489256] [DOI] [PMC free article] [PubMed] [Google Scholar]
Pitrou 2009
- Pitrou I, Boutron I, Ahmad N, Ravaud P. Reporting of safety results in published reports of randomized controlled trials. Archives of Internal Medicine 2009;169(19):1756‐61. [PUBMED: 19858432] [DOI] [PubMed] [Google Scholar]
Poordad 2007
- Poordad FF. Review article: the burden of hepatic encephalopathy. Alimentary Pharmacology & Therapeutics 2007;25(Suppl 1):3‐9. [DOI] [PubMed] [Google Scholar]
Rahimi 2013
- Rahimi RS, Rockey DC. End‐stage liver disease complications. Current Opinion in Gastroenterology 2013;29(3):257‐63. [PUBMED: 23429468] [DOI] [PubMed] [Google Scholar]
Review Manager 2014 [Computer program]
- The Nordic Cochrane Centre, The Cochrane Collaboration. Review Manager (RevMan). Version 5.3. Copenhagen: The Nordic Cochrane Centre, The Cochrane Collaboration, 2014.
Riley 2011
- Riley RD, Higgins JP, Deeks JJ. Interpretation of random effects meta‐analyses. BMJ (Clinical Research Ed.) 2011;342:d549. [PUBMED: 21310794] [DOI] [PubMed] [Google Scholar]
Romero‐Gomez 2014
Royle 2003
- Royle P, Milne R. Literature searching for randomized controlled trials used in Cochrane reviews: rapid versus exhaustive searches. International Journal of Technology Assessment in Health Care 2003;19(4):591‐603. [DOI] [PubMed] [Google Scholar]
Saldanha 2017
- Saldanha IJ, Li T, Yang C, Owczarzak J, Williamson PR, Dickersin K. Clinical trials and systematic reviews addressing similar interventions for the same condition do not consider similar outcomes to be important: a case study in HIV/AIDS. Journal of Clinical Epidemiology 2017;84:85‐94. [PUBMED: 28249722] [DOI] [PMC free article] [PubMed] [Google Scholar]
Savovic 2012a
- Savovic J, Jones HE, Altman DG, Harris RJ, Juni P, Pildal J, et al. Influence of reported study design characteristics on intervention effect estimates from randomized, controlled trials. Annals of Internal Medicine 2012;157(6):429‐38. [PUBMED: 22945832] [DOI] [PubMed] [Google Scholar]
Savovic 2012b
- Savovic J, Jones H, Altman D, Harris R, Juni P, Pildal J, et al. Influence of reported study design characteristics on intervention effect estimates from randomised controlled trials: combined analysis of meta‐epidemiological studies. Health Technology Assessment 2012;16(35):1‐82. [PUBMED: 22989478] [DOI] [PubMed] [Google Scholar]
Savović 2018
- Savović J, Turner RM, Mawdsley D, Jones HE, Beynon R, Higgins JPT, et al. Association between risk‐of‐bias assessments and results of randomized trials in Cochrane Reviews: the ROBES Meta‐Epidemiologic Study. American Journal of Epidemiology 2018;187(5):1113‐22. [DOI] [PMC free article] [PubMed] [Google Scholar]
Schulz 1995
- Schulz KF, Chalmers I, Hayes RJ, Altman DG. Empirical evidence of bias. Dimensions of methodological quality associated with estimates of treatment effects in controlled trials. JAMA 1995;273(5):408‐12. [PUBMED: 7823387] [DOI] [PubMed] [Google Scholar]
Selby 2014
- Selby JV, Lipstein SH. PCORI at 3 years ‐ progress, lessons, and plans. New England Journal of Medicine 2014;370(7):592‐5. [PUBMED: 24521104] [DOI] [PubMed] [Google Scholar]
Selimoglu 2001
- Selimoglu MA, Aydogdu S, Yagci RV, Huseyinov A. Plasma and liver carnitine status of children with chronic liver disease and cirrhosis. Pediatrics International 2001;43(4):391‐5. [PUBMED: 11472585] [DOI] [PubMed] [Google Scholar]
Shawcross 2016
- Shawcross DL, Dunk AA, Jalan R, Kircheis G, Knegt RJ, Laleman W, et al. How to diagnose and manage hepatic encephalopathy: a consensus statement on roles and responsibilities beyond the liver specialist. European Journal of Gastroenterology and Hepatology 2016;28(2):146‐52. [PUBMED: 26600154] [DOI] [PMC free article] [PubMed] [Google Scholar]
Shores 2008
- Shores NJ, Keeffe EB. Is oral L‐acyl‐carnitine an effective therapy for hepatic encephalopathy? Review of the literature. Digestive Diseases and Sciences 2008;53(9):2330‐3. [PUBMED: 18270833] [DOI] [PubMed] [Google Scholar]
Stepanova 2012
- Stepanova M, Mishra A, Venkatesan C, Younossi ZM. In‐hospital mortality and economic burden associated with hepatic encephalopathy in the United States from 2005 to 2009. Clinical Gastroenterology and Hepatology 2012;10(9):1034‐41.e1. [PUBMED: 22642955] [DOI] [PubMed] [Google Scholar]
Sterne 2011
- Sterne JA, Sutton AJ, Ioannidis JP, Terrin N, Jones DR, Lau J, et al. Recommendations for examining and interpreting funnel plot asymmetry in meta‐analyses of randomised controlled trials. BMJ (Clinical Research Ed.) 2011;343:d4002. [PUBMED: 21784880] [DOI] [PubMed] [Google Scholar]
Storebø 2018
- Storebø OJ, Pedersen N, Ramstad E, Kielsholm ML, Nielsen SS, Krogh HB, et al. Methylphenidate for attention deficit hyperactivity disorder (ADHD) in children and adolescents – assessment of adverse events in non‐randomised studies. Cochrane Database of Systematic Reviews 2018, Issue 5. [DOI: 10.1002/14651858.CD012069.pub2] [DOI] [PMC free article] [PubMed] [Google Scholar]
Sturgeon 2014
- Sturgeon JP, Shawcross DL. Recent insights into the pathogenesis of hepatic encephalopathy and treatments. Expert Review of Gastroenterology & Hepatology 2014;8(1):83‐100. [PUBMED: 24236755] [DOI] [PubMed] [Google Scholar]
Sun 2009
- Sun SL, Yang KH, Jing T, Zhang J, Tian JH, Ma B, et al. Naloxone for hepatic encephalopathy. Cochrane Database of Systematic Reviews 2009, Issue 4. [DOI: 10.1002/14651858.CD008177] [DOI] [Google Scholar]
Sun 2014
- Sun X, Ioannidis JP, Agoritsas T, Alba AC, Guyatt G. How to use a subgroup analysis: users' guide to the medical literature. JAMA 2014;311(4):405‐11. [PUBMED: 24449319] [DOI] [PubMed] [Google Scholar]
Sundaram 2009
- Sundaram V, Shaikh OS. Hepatic encephalopathy: pathophysiology and emerging therapies. Medical Clinics of North America 2009;93(4):819‐36, vii. [PUBMED: 19577116] [DOI] [PubMed] [Google Scholar]
Szucs 2017
- Szucs D, Ioannidis JP. Empirical assessment of published effect sizes and power in the recent cognitive neuroscience and psychology literature. PLoS Biology 2017;15(3):e2000797. [PUBMED: 28253258] [DOI] [PMC free article] [PubMed] [Google Scholar]
Thorlund 2009
- Thorlund K, Devereaux PJ, Wetterslev J, Guyatt G, Ioannidis JP, Thabane L, et al. Can trial sequential monitoring boundaries reduce spurious inferences from meta‐analyses. International Journal of Epidemiology 2009;38(1):276‐86. [DOI] [PubMed] [Google Scholar]
Thorlund 2010
- Thorlund K, Anema A, Mills E. Interpreting meta‐analysis according to the adequacy of sample size. An example using isoniazid chemoprophylaxis for tuberculosis in purified protein derivative negative HIV‐infected individuals. Clinical Epidemiology 2010;2:57‐66. [DOI] [PMC free article] [PubMed] [Google Scholar]
Thorlund 2011
- Thorlund K, Engstrøm J, Wetterslev J, Brok J, Imberger G, Gluud C. User manual for Trial Sequential Analysis (TSA). ctu.dk/tsa/files/tsa_manual.pdf 2011 (accessed 10 July 2014).
TSA 2011 [Computer program]
- Copenhagen Trial Unit. TSA ‐ Trial Sequential Analysis. Version 0.9.5.10 Beta. Copenhagen: Copenhagen Trial Unit, 2011.
Turner 2012
- Turner L, Shamseer L, Altman DG, Weeks L, Peters J, Kober T, et al. Consolidated standards of reporting trials (CONSORT) and the completeness of reporting of randomised controlled trials (RCTs) published in medical journals. Cochrane Database of Systematic Reviews 2012, Issue 11. [DOI: 10.1002/14651858.MR000030.pub2; PUBMED: 23152285] [DOI] [PMC free article] [PubMed] [Google Scholar]
Unverzagt 2013
- Unverzagt S, Prondzinsky R, Peinemann F. Single‐center trials tend to provide larger treatment effects than multicenter trials: a systematic review. Journal of Clinical Epidemiology 2013;66(11):1271‐80. [PUBMED: 23972520] [DOI] [PubMed] [Google Scholar]
Vilstrup 2014
- Vilstrup H, Amodio P, Bajaj J, Cordoba J, Ferenci P, Mullen KD, et al. Hepatic encephalopathy in chronic liver disease: 2014 Practice Guideline by the American Association for the Study of Liver Diseases and the European Association for the Study of the Liver. Hepatology (Baltimore, Md.) 2014;60(2):715‐35. [PUBMED: 25042402] [DOI] [PubMed] [Google Scholar]
von Hippel 2015
- Hippel PT. The heterogeneity statistic I(2) can be biased in small meta‐analyses. BMC Medical Research Methodology 2015;15:35. [PUBMED: 25880989] [DOI] [PMC free article] [PubMed] [Google Scholar]
Wakim‐Fleming 2011
- Wakim‐Fleming J. Hepatic encephalopathy: suspect it early in patients with cirrhosis. Cleveland Clinic Journal of Medicine 2011;78(9):597‐605. [PUBMED: 21885692] [DOI] [PubMed] [Google Scholar]
Wessely 1989
- Wessely S, Powell R. Fatigue syndromes: a comparison of chronic "postviral" fatigue with neuromuscular and affective disorders. Journal of Neurology, Neurosurgery, and Psychiatry 1989;52(8):940‐8. [PUBMED: 2571680] [DOI] [PMC free article] [PubMed] [Google Scholar]
Wetterslev 2008
- Wetterslev J, Thorlund K, Brok J, Gluud C. Trial sequential analysis may establish when firm evidence is reached in cumulative meta‐analysis. Journal of Clinical Epidemiology 2008;61(1):64‐75. [PUBMED: 18083463] [DOI] [PubMed] [Google Scholar]
Wetterslev 2009
- Wetterslev J, Thorlund K, Brok J, Gluud C. Estimating required information size by quantifying diversity in random‐effects model meta‐analyses. BMC Medical Research Methodology 2009;9:86. [PUBMED: 20042080] [DOI] [PMC free article] [PubMed] [Google Scholar]
Wetterslev 2017
- Wetterslev J, Jakobsen JC, Gluud C. Trial sequential analysis in systematic reviews with meta‐analysis. BMC Medical Research Methodology 2017;17(1):39. [PUBMED: 28264661] [DOI] [PMC free article] [PubMed] [Google Scholar]
Wong 2014
- Wong RJ, Gish RG, Ahmed A. Hepatic encephalopathy is associated with significantly increased mortality among patients awaiting liver transplantation. Liver Transplantation 2014;20(12):1454‐61. [PUBMED: 25155379] [DOI] [PubMed] [Google Scholar]
Wood 2008
- Wood L, Egger M, Gluud LL, Schulz KF, Jüni P, Altman DG, et al. Empirical evidence of bias in treatment effect estimates in controlled trials with different interventions and outcomes: meta‐epidemiological study. BMJ (Clinical Research Ed.) 2008;336(7644):601‐5. [PUBMED: 18316340] [DOI] [PMC free article] [PubMed] [Google Scholar]
Zavala 2006 [Computer program]
- Zavala D, Martí A, Peña‐Martí G, Comunián G. Sheet to enter data for performing a Cochrane review. Valencia, Venezuela: Universidad de Carabobo, 2006.
References to other published versions of this review
Marti‐Carvajal 2014
- Martí‐Carvajal AJ, Gluud C, Arevalo‐Rodriguez I. Acetyl‐L‐carnitine for patients with hepatic encephalopathy. Cochrane Database of Systematic Reviews 2014, Issue 12. [DOI: 10.1002/14651858.CD011451] [DOI] [PMC free article] [PubMed] [Google Scholar]