

Abstract
Purpose
We determine the changes in intestinal microbiota and/or disruptions in intestinal homeostasis during uveitis.
Methods
Experimental autoimmune uveitis (EAU) was induced in B10.RIII mice with coadministration of interphotoreceptor retinoid-binding protein peptide (IRBP) and killed mycobacterial antigen (MTB) as an adjuvant. Using 16S rRNA gene sequencing, we looked at intestinal microbial differences during the course of uveitis, as well as intestinal morphologic changes, changes in intestinal permeability by FITC-dextran leakage, antimicrobial peptide expression in the gastrointstinal tract, and T lymphocyte prevalence before and at peak intraocular inflammation.
Results
We demonstrate that increased intestinal permeability and antimicrobial peptide expression in the intestinal tract coincide in timing with increased effector T cells in the mesenteric lymph nodes, during the early stages of uveitis, before peak inflammation. Morphologic changes in the intestine were most prominent during this phase, but also occurred with adjuvant MTB alone, whereas increased intestinal permeability was found only in IRBP-immunized mice that develop uveitis. We also demonstrate that the intestinal microbiota were altered during the course of uveitis, and that some of these changes are specific to uveitic animals, whereas others are influenced by adjuvant MTB alone. Intestinal permeability peaked at 2 weeks, coincident with an increase in intestinal bacterial strain differences, peak lipocalin production, and peak uveitis.
Conclusions
An intestinal dysbiosis accompanies a disruption in intestinal homeostasis in autoimmune uveitis, although adjuvant MTB alone promotes intestinal disruption as well. This may indicate a novel axis for future therapeutic targeting experimentally or clinically.
Keywords: microbiome, uveitis, intestinal dysbiosis, intestinal homeostasis, zonulin
Noninfectious uveitis is thought to be caused by a combination of genetic and environmental factors that lead to a breach of immunologic tolerance toward ocular antigens. The environmental stimulus that triggers ocular inflammation in susceptible individuals has not been identified due to the difficulty in testing uveitis patients before the initial onset of inflammatory eye disease. However, in reactive arthritis, which can be associated with acute anterior uveitis, several bacteria have been implicated in disease pathogenesis.1
The normal commensal intestinal bacterial microbiota, consisting of >100 species, can influence host immunity and promote intestinal homeostasis. Other diseases, besides reactive arthritis, associated with an intestinal dysbiosis include ankylosing spondylitis, inflammatory bowel disease (IBD), and multiple sclerosis (MS), all of which are associated with the development of uveitis.2–4 For MS, Nouri et al.5 published a study in which intestinal homeostasis was disrupted at the onset of an MS-like disease in mice called experimental autoimmune encephalomyelitis (EAE).
Several mechanisms can explain how the intestinal microbiota can contribute to ocular inflammatory disease when disrupted: mimicry between cross-reactive intestinal bacterial and ocular antigens6,7; the threshold hypothesis, in which immune cell subsets educated in the intestinal tract by its microbial constituents migrate to extraintestinal lymphoid tissues and reduce the threshold for extraintestinal inflammation8; and the leaky gut hypothesis, in which the bacteria or their components escape from an inflamed GI tract to promote inflammation elsewhere in the body.4 In fact, specific intestinal bacterial strains can promote differentiation of Th17 cells to lower the threshold for extraintestinal inflammation.9–11 Yet other bacterial strains can promote differentiation of regulatory T cells (Tregs)12,13 and contribute to immune homeostasis. We reported oral antibiotic-mediated alteration in the intestinal microbiota reducing the severity of uveitis in an inducible experimental autoimmune uveitis (EAU) model by increasing Tregs, and that certain intestinal bacterial constituents were associated with severe uveitis.14
Due to the body of evidence that suggests a connection between intestinal homeostasis, the intestinal microbiome, and the maintenance of host health, with disruptions in these factors associated with extraintestinal immune-mediated disease, we tested the hypothesis that intestinal dysbiosis likely starts even before peak uveitic inflammation, and may be associated with morphologic, functional, and immunologic changes in the intestinal epithelium.
Materials and Methods
EAU Induction
Female 8- to 12-week-old B10.RIII mice were purchased from Jackson Laboratory (Sacramento, CA, USA) or bred at Oregon Health & Science University (OHSU). All mice were maintained in accordance with the institutional policies for animal health and well-being, in ventilated cages under HEPA-filtered barrier conditions, and fed gamma-irradiated food and water ad libitum. Mice were immunized with an emulsion containing 15 μg interphotoreceptor retinoid binding protein (IRBP)161–180 peptide (Anaspec, Fremont, CA, USA) in complete Freund's adjuvant (Sigma-Aldrich Corp., St. Louis, MO, USA) containing 2.5 mg/mL killed Mycobacterium tuberculosis (MTB) antigen (Difco, Houston, TX, USA)14,15 or with emulsion containing only MTB antigen as an adjuvant-only control. A scrambled IRBP peptide (scIRBP) (Genscript, Township, NJ, USA) was used as an irrelevant antigen control, administered in an emulsion with the same amount of MTB. Clinical EAU score was evaluated by fundus examination using a 90 diopter (D) lens (Volk, Mentor, OH, USA; Keeler, Sacramento, CA, USA) every 3 days. Clinical and histopathologic scoring of uveitis was conducted based on a grading scale of 0 to 4 as described previously.15 Mouse fundus photos were obtained using a Micron IV fundus camera (Phoenix Research Labs, Pleasanton, CA, USA).
Cell Isolation
Single cell suspensions were obtained by processing the mesenteric lymph node (MLN), through a 70-μm cell strainer. Lamina propria lymphocytes (LPL) were isolated: the cecum and colon were cut into 1 cm segments, contents removed, and lumen opened. This was incubated 30 minutes at 37°C in RPMI culture media (Gibco/Life Technologies, Waltham, MA, USA) containing 3% fetal bovine serum (FBS) (Sigma-Aldrich Corp.), 5 mM EDTA (Life Technologies), and 1 mM dithiothreitol (Sigma-Aldrich Corp.). Tissue digestions with 0.1 mg/ mL collagenase II (Sigma-Aldrich Corp.) and 0.1 mg/mL DNase I (Roche, San Francisco, CA, USA) were performed for 45 minutes. Digested tissues were layered on a 30%/40%/60% Percoll (GE Healthcare, Pittsburgh, PA, USA) gradient, spun at 740g for 20 minutes, and lymphocytes collected from the 40%/60% interface.
Flow Cytometry
For T helper (Th) subsets, single cell suspensions were stimulated in vitro for 3 hours at 37°C with 500 ng/mL phorbol 12-myristate 13-acetate (PMA; Sigma-Aldrich Corp.) and 2 μg/mL ionomycin (Sigma-Aldrich Corp.) in culture media (10% FBS, RPMI, penicillin, streptomycin, β-mercaptoethanol) in the presence of monensin (BD Biosciences, San Jose, CA, USA). Cells were stained with CD4-PE-Cy7 (eBioscience/Affymetrix) and Live/Dead stain, then fixed and permeabilized using an intracellular cytokine detection kit (BD Biosciences). The intracellular staining panel included IFNγ-FITC (BD Biosciences), TNFα-phycoerythrin (TNFα-PE) (eBioscience/Affymetrix), IL-2-Alexa Fluor 647 (IL-2-AF647) and IL-17A-allophycocyanin (IL-17A-APC) (BD Pharmingen). Flow cytometric data were acquired on an LSRFortessa cell analyzer (BD Biosciences).
Lipocalin Assay
Ileal and colonic contents reconstituted in 100 mg/mL PBS (Gibco/Life Technologies) containing 0.1% Tween-20 (Sigma-Aldrich Corp.) were vortexed at high speed for 20 minutes at room temperature. Samples were centrifuged for 10 minutes at 13,800g (4°C). Clarified supernatants were collected and analyzed immediately or stored at −20°C. Lipocalin levels from supernatants were measured using Mouse Lipocalin-2/NGAL DuoSet enzyme-linked immunosorbent assay kit (R&D Systems, Minneapolis, MN) using undiluted or diluted up to 160-fold in kit-recommended diluent (Gibco/Life Technologies) containing 1% BSA (Sigma-Aldrich Corp.). Plates were read on a Victor3 plate reader (PerkinElmer, Waltham, MA) at 450 nm.
Intestinal Morphology
Ileal tissue was fixed with 10% neutral buffered formalin (NBF) overnight, stored in 70% ethanol 4°C until placed in an automated tissue processor (Shandon Citadel 2000; Thermo Fisher Scientific, Waltham, MA, USA), and then paraffin-embedded. Ileum sections (5 μm) were de-paraffinized and stained with hematoxylin and eosin (H&E), then photographed using a DM5000 B microscope, DC500 camera, and IM50 software (all Leica, Wetzlar, Germany). Three ileum sections from each animal were analyzed by measuring four parameters: villus, crypt, submucosa, and muscularis thickness, in two different areas, using ImageJ.16
Quantitative Reverse-Transcriptase PCR
Total RNA was isolated from flash frozen ileum stored at −80°C using TRIzol (Thermo Fisher Scientific/Life Technologies). cDNA was synthesized using High-Capacity cDNA Reverse Transcriptase kit (Thermo Fisher Scientific/Applied Biosystems). Quantitative RT-PCR of anti-microbial peptide (AMPs) expression was performed using Taqman gene expression assay and mouse-specific oligonucleotides: Reg3γ (Mm00441128_g1) and S100A8 (Mm00496696_g1) normalized to the housekeeping gene hypoxanthine-guanine phosphoribosyltransferase (HPRT; Mm01545399_mL; Thermo Fisher Scientific/Applied Biosystems). For cytokine expression, custom-made oligonucleotides were used with PerfeCta Sybr Green Supermix (Quantabio, Beverly, MA): IFNγ (forward: 5′-GCGTCATTGAATCACACCTG-3′, reverse: 5′-TGAGCTCATTGAATGCTTGG-3′),17 IL-10 (forward: 5′-GGTTGCCAAGCCTTATCGGA-3′, reverse: 5′-ACCTGCTCCACTG CCTTGCT-3′),18 and IL-17A (forward: 5′-CTCAAAGCTCAGCGTGTC CAAACA-3′, reverse: 5′-TATCAGGGTCTTCATTGCGGTGGA-3′), normalized to glyceraldehyde 3-phosphate dehydrogenase gene (forward: 5′-TCAACAGCAACTCCCACTCTTCCA-3′, reverse: 5′-ACCCTGTTGCTGTAGCCGTATTCA-3′).19 RT-PCR was performed on a ViiA 7 Real-time PCR System (Thermo Fisher Scientific, Waltham, MA).
In vivo Intestinal Permeability Assay
An in vivo intestinal permeability assay was performed to examine intestinal barrier function.20 8- to 12-week-old B10.RIII mice were fasted (food and water) for 4 hours, and then were given FITC-labeled dextran (360 mg/kg body weight, MW4000; Sigma-Aldrich Corp.) via oral gavage. Whole blood was collected through cardiac puncture 1 hour after gavage, and was centrifuged to obtain serum. Serum was diluted with PBS pH 7.4 (1:6 vol/vol). Standard curves were obtained by serial dilution of FITC-dextran in nontreated serum diluted with PBS (1:6 vol/vol). Fluorescence intensity was measured (excitation 485 nm, emission 535 nm; VICTOR3 PerkinElmer). FITC-dextran concentrations were calculated, based on the standard curves.
Immunofluorescence ZO-1 Staining
Mouse ileal sections were deparaffinized, rehydrated, and underwent antigen retrieval by incubating slides in 92°C Target Retrieval Solution (pH6.1; Ready-to-use; Agilent Technologies, Santa Clara, CA, USA) for 45 minutes followed by a 1 hour room temperature block using CAS-Block with 2% normal goat serum (Invitrogen, Camarillo, CA, USA). Samples were treated with the background-reducing TrueBlack Lipofuscin for 3 minutes (Biotium, Fremont, CA, USA) followed by a PBS wash, and incubation overnight at 4°C in a humidified chamber with rabbit anti-(ZO)-1 antibody 0.6 mg/mL in CAS-Block (Invitrogen), or isotype control rabbit IgG (Life Technologies, Eugene, OR) 0.6 mg/mL. After washing, slides were incubated for 1 hour at room temperature with secondary goat anti-rabbit-AlexaFluor488 antibody 1:500 (Life Technologies). Secondary antibody solution was removed and 4′,6-diamidino-2-phenylendole (DAPI) 5 mg/mL added for 3 minutes. After washing, slides were mounted with Prolong gold anti-fade mounting media (Thermo Fisher Scientific). Confocal microscopy z-stacked images were obtained using an Olympus FV1000 (Olympus Corporation, Shinjuku, Tokyo, Japan) and FluoView software (FV10-ASW 2.1; Olympus). Raw confocal images were converted to TIFF files and color channels separated through ImageJ (NIH, Bethesda, MD, USA) to perform quantitative analysis of ZO-1 levels, expressed as integrated density/total area, of a single villus and crypt using manual segmentation.
16S rRNA Gene Sequencing
Microbial DNA was isolated from frozen cecal contents with a Mo Bio isolation kit (Laboratories, Inc., Carlsbad, CA, USA) according to manufacturer instructions. Amplification of the 16S small subunit rRNA gene was performed using standard protocols of the Earth Microbiome Project (available in the public domain at www.earthmicrobiome.org).21 The V4 region of the 16S gene was targeted with universal primers 515F/806RB and sequenced on the Illumina MiSeq. The sequences were processed using scripts implemented through the workflow package Quantitative Insights Into Microbial Ecology (QIIME; v1.9.0).22 Individual sequence reads were assembled with FASTQ-join (ea-utils, version 1.1.2-686), with default settings. Operational taxonomic units (OTUs) were picked with open reference OTU-picking using uclust and the greengenes reference database (gg_13_8).23 Chimeric sequences were removed with the blast_fragments approach implemented in QIIME. Taxonomy was assigned to individual OTUs using uclust with a minimum of 90% similarity to consider a database match a hit and minimum consensus fraction of 0.51. OTU tables were filtered for OTUs found at more than 0.01% of total abundance and represented in at least 10% of samples. Alpha diversity was calculated from filtered OTU tables by quantifying the number of distinct OTUs present in each sample. To identify differentially abundant OTUs between groups, we used Linear discriminant analysis of Effect Size (LEfSe) analysis developed by the Huttenhower lab (available in the public domain at https://huttenhower.sph.harvard.edu/galaxy/), which uses a nonparametric factorial Kruskal-Wallis (KW) sum-rank test to detect features with significant differential abundance; biological significance then was determined using pairwise tests using the Wilcoxon rank-sum test.24
Statistical Analyses
Grubb's test was used to identify outliers. Nonparametric, Mann-Whitney U tests were performed to compare treatment groups using GraphPad Prism 4 software (GraphPad Software, Inc., La Jolla, CA).
Results
Time Course of Experimental Autoimmune Uveitis
B10.RIII mice develop a robust, monophasic uveitis when immunized with IRBP plus MTB as an adjuvant. Onset of mild inflammation is between 7 and 10 days after immunization with peak ocular inflammation between days 12 and 14 (Fig. 1A), characterized by multiple plaque-like, confluent and linear chorioretinal inflammatory infiltrates, subretinal and vitreous hemorrhage, and occasionally serous retinal detachment (Figs. 1B, 1C). The average clinical score at peak for EAU in B10.RIII mice in these studies was 3.6 of 4.15 Scrambled IRBP peptide given in the same MTB-containing emulsion does not promote ocular inflammation nor does MTB (adjuvant) alone.
Figure 1.

Time course of EAU in B10.RIII mice. (A) Time course of uveitis clinical scores by fundus examination. (B) Representative fundus and histology photos for each group, ***P < 0.001. (C) Red arrow designates single cell seen in IRBP day 7.
Intestinal Dysbiosis in EAU
Often cited in 16S rRNA gene sequencing analyses, alpha diversity takes into account bacterial species richness (number of bacterial species) and evenness (similar high abundance of species). Beta diversity is a measure of distance or dissimilarity between each sample pair, is mostly descriptive, plotted on a principal coordinates analysis (PCoA) plot, and when using a weighted UniFrac analysis, takes into account the abundance of OTUs and the phylogeny of the bacteria. The alpha diversity measure was significantly lower in IRBP-immunized animals compared to nonimmunized (NI) mice at 1 week after immunization, before onset of significant ocular inflammation (Figs. 2A, 2B). Beta diversity analysis demonstrated differences in animals immunized with adjuvant MTB alone compared to IRBP, as well as differences between MTB compared to nonimmunized mice (Fig. 2C; Table).
Figure 2.

Cecal bacterial microbiome alterations in EAU versus MTB adjuvant alone. (A, B) Alpha diversity measures from cecal contents in EAU versus MTB-immunized versus nonimmunized mice at 1 (day 7) and 2 (day 14) weeks by observed OTUs (A) and Chao1 index (B). (C) Beta diversity as shown by weighted unifrac analysis on a PCoA plot. (D) LefSe analysis showing differentially abundant cecal bacterial strains in IRBP-immunized mice compared to MTB-alone at 1 week. Cladogram showing phylotype differences between MTB-immunized versus IRBP-immunized (EAU) mice at 1 week (at right). (E) LefSe analysis showing differentially abundant cecal bacterial genera in IRBP-immunized mice versus MTB-alone at 2 weeks. Cladogram showing phylotype differences between MTB-immunized versus IRBP-immunized (EAU) mice at 2 weeks (at right). **P < 0.01.
Table.
Weighted Unifrac Permanova Analyses Between Individual Groups
|
Weighted |
NI |
IRBP 1 Wk |
IRBP 2 Wk |
MTB 1 Wk |
MTB 2 Wk |
| NI | 0.024 | 0.213 | 0.003 | 0.001 | |
| IRBP 1 wk | 0.024 | 0.002 | 0.001 | ||
| IRBP 2 wk | 0.213 | 0.002 | 0.001 | ||
| MTB 1 wk | 0.003 | 0.001 | 0.001 | ||
| MTB 2 wk | 0.001 | 0.001 | 0.001 |
Bold texts reveal comparisons that show P < 0.05 after multiple comparisons testing.
Using LEfSe, we found an increased abundance in Clostridium and S24-7 bacteria, but depletion in Verrucomicrobia, Akkermansia, Dorea, and other bacteria in uveitic mice compared to adjuvant MTB alone (Fig. 2D). At 2 weeks after immunization (at the peak of uveitis), more bacterial genera were differentially abundant in IRBP-immunized animals compared to adjuvant MTB alone (Fig. 2E). Increased in abundance were Prevotella, Lactobacilli, Anaeroplasma, Parabacteroides, and Clostridium species, whereas Ruminococcus, Bacteroidia, S24-7, Proteobacteria, and Desulfovibrio were more abundant in adjuvant MTB alone. The cladogram shows an enrichment in the phylotypes Bacteroidetes and Proteobacteria with adjuvant MTB alone, whereas Firmicutes were more abundant in IRBP- immunized (EAU) mice at peak uveitis (Fig. 2E).We also found intestinal microbial changes in adjuvant MTB or IRBP compared to nonimmunized animals at 1 to 2 weeks after immunization (Supplementary Fig. S1).
Intestinal Morphologic Changes
Intestinal barrier dysfunction is characterized by alterations in intestinal morphology, gene expression, inflammation, and permeability. Nouri et al.5 reported that disruption of intestinal homeostasis preceded central nervous system (CNS) inflammation in EAE, a model analogous to human MS, and similar in implementation to EAU. Interestingly, to our knowledge, no prior study has investigated the effect of adjuvant MTB alone.
We assessed parameters of intestinal morphology: villus length, crypt depth, submucosal thickness, and muscularis thickness. Changes in ileal crypts and submucosal layers, correlate with disease states in other inflammatory conditions.25–27 The intestinal morphologic changes in our study were most significant at day 7, before the peak of uveitis, with significant decreases in villus, crypt, submucosal, and muscularis length in IRBP-immunized animals compared to nonimmunized animals (Figs. 3A, 3B). These changes in intestinal morphology reversed for most parameters by day 14. Most intestinal morphology measures were similarly reduced by adjuvant MTB alone, and in the case of submucosal length, was significantly more reduced. Most intestinal morphologic parameters reversed by day 14 with adjuvant MTB alone also. These reductions in intestinal morphologic measurements before peak ocular inflammation are consistent with our findings in EAU induced in C57Bl/6J mice.28 It is important to note that clinically, no immunized animal had diarrhea or weight changes, nor did they exhibit any other overt signs of gastrointestinal inflammation.
Figure 3.

Changes in intestinal structure, zonula occludens-1, and intestinal permeability during early and peak uveitis. (A) Representative H&E-stained ileum sections from nonimmunized (NI), IRBP-, or MTB-immunized mice. Numbered bars show representative measurements for villi (1), crypts (2), submucosa (3), and muscularis (4). (B) Quantitation of ileal measurements represented in A. (C) Representative confocal microscope images of immunofluorescence ZO-1 staining in ileum from NI, IRBP-, or MTB-immunized mice. (D) Quantitation of ileal ZO-1 expression as represented in C. (E) Intestinal permeability as quantitated by FITC-dextran assay. *P < 0.05, **P < 0.01, ***P < 0.001; ****P < 0.0001; n = 4–6, repeated up to 6 times; ZO-1: zonula occludens-1.
Zonula-Occludens-1 Expression and Intestinal Permeability During Uveitis
Zonula-occludens-1 (ZO-1) is an intestinal tight junction protein that can be modulated during changes in intestinal permeability, although its correlation to increased versus decreased intestinal permeability has resulted in mixed results in the literature.29 We found an increase in ZO-1 expression in the ileum of IRBP-immunized mice throughout the apical surface of the villi and crypts, with highest expression at day 7, before the peak of uveitis (Figs. 3C, 3D). Ileal ZO-1 levels decreased at day 14 (peak uveitis) coinciding with the time course of events for the intestinal morphologic changes. Immunization with MTB alone also induced a significant increase in ileal ZO-1 expression compared to nonimmunized mice at day 7, but not as vigorously as IRBP-immunized mice. A scrambled IRBP peptide control (given with MTB as in all other groups) did not significantly increase ileal ZO-1 expression.
On the other hand, intestinal permeability as measured by a FITC-dextran assay showed that only IRBP-immunized mice had significantly increased intestinal permeability, starting at day 7, and peaking at day 14, at peak uveitis (Fig. 3E). The time course of increased intestinal permeability coincided with the intestinal microbiota changes but differed slightly from peak ZO-1 expression. Neither MTB alone nor scrambled IRBP peptide appeared to significantly alter intestinal permeability as measured by the FITC-dextran assay.
Anti-Microbial Peptide and Cytokine Changes in the Ileum During EAU
Next, we assessed ileal gene expression involved in host defense, including anti-microbial peptides (AMPs) and cytokine production (Fig. 4). AMPs, including regenerating islet-derived protein 3 gamma (Reg3γ), S100A8, and lipocalin-2, are secreted by Paneth cells located at the bottom of the crypt. AMPs exert lytic, phagocytic, chemotactic activities, and are important in the clearance of endotoxins, such as bacterial lipopolysaccharide.30,31 The calcium-binding protein, S100A8, is increased in IBD32 and in response to microbial invasion.33 Widely used as a biomarker for IBD, quantifying S100A8 levels is a way to assess intestinal inflammatory status, and potentially, response to treatment.34 During EAU, there was a significant increase in Reg3γ and S100A8 gene expression by RT-qPCR starting as early as day 7, before peak uveitis (Figs. 4A, 4B), and for S100A8, this extended out to day 14. For Reg3γ this increase was reversed by day 14, coinciding with the time course of ZO-1 staining and morphologic intestinal changes. These increases in Reg3γ and S100A8 also could be induced by adjuvant MTB alone, but were reversed by day 14. Scrambled IRBP peptide appeared to have a lesser effect on expression of these AMPs, although S100A8 was significantly increased in this group compared to nonimmunized mice (Fig. 4A,B).
Figure 4.
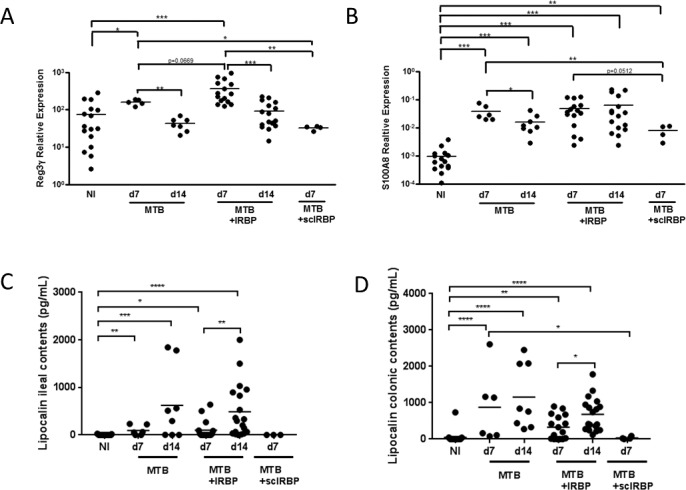
Ileal antimicrobial peptide expression during uveitis. (A) Expression of Reg3γ transcript in ileum tissue in IRBP-immunized versus MTB-alone mice by reverse transcriptase quantitative PCR, as expressed relative to housekeeping gene. (B) Expression of S100A8 transcript in ileum tissue in IRBP-immunized versus MTB-immunized mice. (C) Production of lipocalin-2 protein in the ileum and colon (D) in IRBP versus MTB-immunized mice. *P < 0.05, **P < 0.01, ***P < 0.001; n = 4–6, repeated up to 6 times.
Lipocalin-2 has been identified as a sensitive inflammatory biomarker useful for tracking disease in various immune-mediated diseases. Fecal lipocalin levels have been a marker for low-grade intestinal inflammation in experimental colitis.35 Most recently, lipocalin-2 (also known as neutrophil gelatinase-associated lipocalin or NGAL) has been identified as a diagnostic tool for patients with IBD alongside the calprotectin biomarker, because of its unique site of expression in the epithelial layer of the intestine.36 To detect subclinical intestinal inflammation in EAU mice in tandem with the initial and peak stages of uveitis, we measured the concentration of lipocalin-2 in ileum and colon contents from mice at 7 and 14 days after immunization. Lipocalin-2 levels were significantly elevated over nonimmunized mice starting at day 7 and continuing at day 14 in EAU mice in the colon and ileum (Figs. 4C, 4D). As opposed to the data reported thus far in regards to morphologic changes in the intestines and ZO-1 expression, lipocalin levels were even higher at day 14 than at day 7 in IRBP-immunized mice, coinciding with the enhanced number of intestinal microbial differences seen at day 14 on 16S rRNA gene sequencing and with peak increased intestinal permeability. MTB-alone had a similar effect on lipocalin-2 production at both time points, but the scrambled IRBP peptide had no effect.
Next, we looked at inflammatory cytokine transcripts within the ileum by RT-qPCR. Contrary to lipocalin-2 levels, IFNγ, IL-17, and IL-10 transcripts were reduced in IRBP-immunized mice at day 7, and this reduction was abrogated by day 14 for IFNγ and IL-10 (Figs. 5A–C). MTB alone similarly caused reductions in all three cytokine transcripts at day 7 that were abrogated by day 14 (Figs. 5A–C). This pattern mimics the time course of morphologic intestinal changes (a reduction followed by normalization). Scrambled IRBP peptide caused reduction in IFNγ and IL-10, but the reduction in IL-17 was not statistically significant.
Figure 5.

Ileal cytokine production during uveitis. (A) Expression of IFNγ transcript in ileal tissue in nonimmunized versus IRBP-immunized versus MTB-immunized mice as determined by reverse transcriptase quantitative PCR, as expressed relative to housekeeping gene expression. (B) Expression of IL-17A transcript in ileal tissue in nonimmunized versus IRBP-immunized versus MTB-alone mice. (C) Expression of IL-10 transcript in ileal tissue in nonimmunized versus IRBP-immunized versus MTB-immunized mice. *P < 0.05, **P < 0.01, ***P < 0.001; n = 4–6 per group, repeated up to 6 times.
T Cell Subsets in the Large Intestine and Extraintestinal Tissues During EAU
Colonic and cecal LPLs were analyzed by flow cytometry to determine at what time point there appeared to be altered T cell populations in the intestinal tract in EAU. Th17 cells were reduced in the LPLs at day 7 of IRBP-immunization compared to MTB-alone, and this was partially abrogated by day 14 (Figs. 6A, 6B). Scrambled IRBP peptide, on the other hand, increased Th1 and Th17 cells in the large intestinal LPLs at day 7.
Figure 6.

Cecal and colonic LPL T cell subsets during uveitis. (A) Flow cytometric quantitation of IFNγ-producing, IL-17A–producing, IL-2–producing, and TNFα-producing, CD4+ T cells in the large intestinal LPL in nonimmunized versus MTB-immunized versus IRBP-immunized mice. (B) Representative flow cytometric plots for groups shown in A. *P < 0.05, **P < 0.01; n = 4–6 per group, repeated up to 6 times.
By contrast, in the MLN (lymphatic drainage of the intestinal tract), there were increases in Th1 cells in IRBP-immunized and adjuvant MTB–alone animals (Figs. 7A, 7B), although Th17 cells were more significantly increased by adjuvant MTB compared to IRBP. IL-2 producing and TNF-α producing helper T cells also were increased by day 7 in MTB and IRBP groups. Increases seen in effector T cells were often partially reversed by day 14 in MTB and IRBP groups, suggesting a transient effect. Scrambled IRBP peptide had a relatively smaller effect by comparison for Th1 and TNF-α–producing helper T cells, but had just as large an effect on the MLN Th17 cells. There were no statistically significant differences in any of the Th subsets tested in the spleen at day 7 or day 14 (data not shown).
Figure 7.

Mesenteric lymph node (MLN) T cell subsets during uveitis. (A) Flow cytometric quantitation of IFNγ-producing, IL-17A–producing, IL-2–producing, and TNFα-producing, CD4+ T cells in the MLN in nonimmunized versus MTB-immunized versus IRBP-immunized mice. (B) Representative flow cytometric plots for groups shown in (A). *P < 0.05, **P < 0.01; n = 4–6 per group, repeated up to 6 times.
Discussion
We have made several novel findings in this study showing various aspects of subclinical intestinal alterations during the course of uveitis. First, we demonstrated that an intestinal dysbiosis occurs in uveitis starting before peak ocular inflammation, but becomes more exaggerated at peak inflammation (comparing IRBP to MTB-alone). Adjuvant MTB alone can induce different intestinal microbial changes than IRBP. The alterations in the intestinal microbiota induced by adjuvant MTB alone compared to IRBP are potentially representative of bacteria that are pathogenic in uveitis, although additional studies, such as reintroducing particular bacterial strains in a germ-free environment or in antibiotic pretreated EAU mice, are required to test this hypothesis. Among the differentially abundant bacterial strains, there were a few overlapping strains (Clostridia, Lactobacillus) between our previous publication14 and this study, but it should be noted that the comparisons shown are very different from the prior study. In this study, we showed differentially abundant intestinal microbiota between EAU mice and MTB-immunized mice at 1 and 2 weeks after immunization. In our previously published study, we showed the differentially abundant bacteria in EAU mice compared to nonimmunized mice at 3 weeks after immunization. While overlap might be interesting to demonstrate, complete overlap is not expected.
The largest morphologic changes in the ileum occur before peak uveitis, and coincide with peak intestinal ZO-1 expression, increased intestinal AMP production, and decreased ileal cytokine production. While some of these changes (morphologic alterations, ZO-1 expression, AMP production, and intestinal cytokine production) appear to be transient (partially reverse by day 14), other changes are persistent and peak at day 14 (e.g., lipocalin production, extent of intestinal dysbiosis, and intestinal permeability), at peak uveitis. Hence, one might consider intestinal lipocalin levels, extent of intestinal dysbiosis, and intestinal permeability as better markers for the extent of ocular inflammation than the other markers. One caveat to this study is that ZO-1 versus zonulin was studied, the latter being a more reliable marker that coincides with increased intestinal permeability. Also, we have not tested IRBP without adjuvant MTB as a control group to look an intestinal microbial changes induced by the peptide without adjuvant MTB.
In the MLN, we demonstrated increased Th1 and Th17 cells at the early time point, when intestinal cytokine levels were reduced (at day 7). This suggests that before peak uveitis, intestinal changes might favor migration of leukocytes, including Th1 and Th17 cells, from the intestines to the extraintestinal lymph nodes,28 although altered migration was not directly demonstrated in this study. The initiation of increased ZO-1 and lipocalin levels coincides with the timing of these effector T cell changes, although not with peak ZO-1 or lipocalin levels. Thus, it is possible that dynamic changes in the intestinal mucosal immune system and permeability may be crucial to the development of uveitis, with the contribution of adjuvant MTB being quite significant. These data corroborate other work by our lab that there is enhanced migration of leukocytes from the gastrointestinal tract to extraintestinal lymphoid tissues and the eye during uveitis when induced in Kaede transgenic C57Bl/6J mice.28
In summary, we report novel intestinal changes and microbial alterations, some of which are induced by adjuvant MTB alone, and some of which are associated with the uveitic state. These results suggest an important association between disruptions in intestinal immune homeostasis and inflammatory diseases outside the GI tract, such as the eye. Targeting intestinal immune homeostasis and permeability may thus be a potentially effective approach to treating noninfectious uveitis.
Supplementary Material
Acknowledgments
The authors thank Yuzhen Pan, Hanna Brush, Ritwika Petluri, Stephen R. Planck, and Yuki Nakamura for their assistance.
Supported by a National Eye Institute Grant K08 EY022948, a Collins Medical Trust Grant, and a Research to Prevent Blindness Career Development Award (PL), a National Institutes of Health (NIH; Bethesda, MD, USA) BIRCWH K12 Award (K12 HD 043488; LK), by core grant P30 EY010572 from the NIH, by unrestricted departmental funding from Research to Prevent Blindness (New York, NY, USA), by the Spondylitis Association of America, the Rheumatology Research Foundation, and NIH Grant RO1 EY029266 (JTR, MA), and by the Stan and Madelle Family Trust and the William and Mary Bauman Foundation (JTR).
Disclosure: C. Janowitz, None; Y.K. Nakamura, None; C. Metea, None; A. Gligor, None; W. Yu, None; L. Karstens, None; J.T. Rosenbaum, None; M. Asquith, None; P. Lin, None
References
- 1.Carter JD. Reactive arthritis: defined etiologies, emerging pathophysiology, and unresolved treatment. Infect Dis Clin North Am. 2006;20:827–847. doi: 10.1016/j.idc.2006.09.004. [DOI] [PubMed] [Google Scholar]
- 2.Costello ME, Ciccia F, Willner D, et al. Brief report: intestinal dysbiosis in ankylosing spondylitis. Arthritis Rheumatol. 2015;67:686–691. doi: 10.1002/art.38967. [DOI] [PubMed] [Google Scholar]
- 3.Miyake S, Kim S, Suda W, et al. Dysbiosis in the gut microbiota of patients with multiple sclerosis, with a striking depletion of species belonging to clostridia xiva and iv clusters. PLoS One. 2015;10:e0137429. doi: 10.1371/journal.pone.0137429. [DOI] [PMC free article] [PubMed] [Google Scholar]
- 4.Rosenbaum JT, Lin P, Asquith M. The microbiome, HLA, and the pathogenesis of uveitis. Jpn J Ophthalmol. 2016;60:1–6. doi: 10.1007/s10384-015-0416-y. [DOI] [PubMed] [Google Scholar]
- 5.Nouri M, Bredberg A, Westrom B, Lavasani S. Intestinal barrier dysfunction develops at the onset of experimental autoimmune encephalomyelitis, and can be induced by adoptive transfer of auto-reactive T cells. PLoS One. 2014;9:e106335. doi: 10.1371/journal.pone.0106335. [DOI] [PMC free article] [PubMed] [Google Scholar]
- 6.Horai R, Sen HN, Caspi RR. Commensal microbiota as a potential trigger of autoimmune uveitis. Expert Rev Clin Immunol. 2017;13:291–293. doi: 10.1080/1744666X.2017.1288098. [DOI] [PMC free article] [PubMed] [Google Scholar]
- 7.Horai R, Zarate-Blades CR, Dillenburg-Pilla P, et al. Microbiota-dependent activation of an autoreactive t cell receptor provokes autoimmunity in an immunologically privileged site. Immunity. 2015;43:343–353. doi: 10.1016/j.immuni.2015.07.014. [DOI] [PMC free article] [PubMed] [Google Scholar]
- 8.Honda K, Littman DR. The microbiota in adaptive immune homeostasis and disease. Nature. 2016;535:75–84. doi: 10.1038/nature18848. [DOI] [PubMed] [Google Scholar]
- 9.Ivanov II, Atarashi K, Manel N, et al. Induction of intestinal Th17 cells by segmented filamentous bacteria. Cell. 2009;139:485–498. doi: 10.1016/j.cell.2009.09.033. [DOI] [PMC free article] [PubMed] [Google Scholar]
- 10.Tan TG, Sefik E, Geva-Zatorsky N, et al. Identifying species of symbiont bacteria from the human gut that, alone, can induce intestinal Th17 cells in mice. Proc Natl Acad Sci U S A. 2016;113:E8141–E8150. doi: 10.1073/pnas.1617460113. [DOI] [PMC free article] [PubMed] [Google Scholar]
- 11.Wu HJ, Ivanov II, Darce J, et al. Gut-residing segmented filamentous bacteria drive autoimmune arthritis via T helper 17 cells. Immunity. 2010;32:815–827. doi: 10.1016/j.immuni.2010.06.001. [DOI] [PMC free article] [PubMed] [Google Scholar]
- 12.Atarashi K, Tanoue T, Shima T, et al. Induction of colonic regulatory T cells by indigenous Clostridium species. Science. 2011;331:337–341. doi: 10.1126/science.1198469. [DOI] [PMC free article] [PubMed] [Google Scholar]
- 13.Round JL, Mazmanian SK. Inducible Foxp3+ regulatory T-cell development by a commensal bacterium of the intestinal microbiota. Proc Natl Acad Sci U S A. 2010;107:12204–12209. doi: 10.1073/pnas.0909122107. [DOI] [PMC free article] [PubMed] [Google Scholar]
- 14.Nakamura YK, Metea C, Karstens L, et al. Gut microbial alterations associated with protection from autoimmune uveitis. Invest Ophthalmol Vis Sci. 2016;57:3747–3758. doi: 10.1167/iovs.16-19733. [DOI] [PMC free article] [PubMed] [Google Scholar]
- 15.Agarwal RK, Caspi RR. Rodent models of experimental autoimmune uveitis. Methods Mol Med. 2004;102:395–419. doi: 10.1385/1-59259-805-6:395. [DOI] [PubMed] [Google Scholar]
- 16.Schneider CA, Rasband WS, Eliceiri KW. NIH. Image to ImageJ: 25 years of image analysis. Nat Methods. 2012;9:671–675. doi: 10.1038/nmeth.2089. [DOI] [PMC free article] [PubMed] [Google Scholar]
- 17.Flahou B, Deun KV, Pasmans F, et al. The local immune response of mice after Helicobacter suis infection: strain differences and distinction with Helicobacter pylori. Vet Res. 2012;43:75. doi: 10.1186/1297-9716-43-75. [DOI] [PMC free article] [PubMed] [Google Scholar]
- 18.Matsushita T, Yanaba K, Bouaziz JD, Fujimoto M, Tedder TF. Regulatory B cells inhibit EAE initiation in mice while other B cells promote disease progression. J Clin Invest. 2008;118:3420–3430. doi: 10.1172/JCI36030. [DOI] [PMC free article] [PubMed] [Google Scholar]
- 19.Wainwright DA, Sengupta S, Han Y, Ulasov IV, Lesniak MS. The presence of IL-17A and T helper 17 cells in experimental mouse brain tumors and human glioma. PLoS One. 2010;5:e15390. doi: 10.1371/journal.pone.0015390. [DOI] [PMC free article] [PubMed] [Google Scholar]
- 20.Cani PD, Possemiers S, Van de Wiele T, et al. Changes in gut microbiota control inflammation in obese mice through a mechanism involving GLP-2-driven improvement of gut permeability. Gut. 2009;58:1091–1103. doi: 10.1136/gut.2008.165886. [DOI] [PMC free article] [PubMed] [Google Scholar]
- 21.Gilbert JA, Meyer F, Jansson J, et al. The Earth Microbiome Project: Meeting report of the “1 EMP meeting on sample selection and acquisition” at Argonne National Laboratory October 6 2010. Stand Genomic Sci. 2010;3:249–253. doi: 10.4056/aigs.1443528. [DOI] [PMC free article] [PubMed] [Google Scholar]
- 22.Caporaso JG, Kuczynski J, Stombaugh J, et al. QIIME allows analysis of high-throughput community sequencing data. Nat Methods. 2010;7:335–336. doi: 10.1038/nmeth.f.303. [DOI] [PMC free article] [PubMed] [Google Scholar]
- 23.Edgar RC. Search and clustering orders of magnitude faster than BLAST. Bioinformatics. 2010;26:2460–2461. doi: 10.1093/bioinformatics/btq461. [DOI] [PubMed] [Google Scholar]
- 24.Segata N, Izard J, Waldron L, et al. Metagenomic biomarker discovery and explanation. Genome Biol. 2011;12:R60. doi: 10.1186/gb-2011-12-6-r60. [DOI] [PMC free article] [PubMed] [Google Scholar]
- 25.Burke JP, Mulsow JJ, O'Keane C, Docherty NG, Watson RW, O'Connell PR. Fibrogenesis in Crohn's disease. Am J Gastroenterol. 2007;102:439–448. doi: 10.1111/j.1572-0241.2006.01010.x. [DOI] [PubMed] [Google Scholar]
- 26.MacDonald TT, Spencer J. The role of activated T cells in transformed intestinal mucosa. Digestion. 1990;46(suppl 2):290–296. doi: 10.1159/000200399. [DOI] [PubMed] [Google Scholar]
- 27.Zeitz M, Ullrich R, Schneider T, Kewenig S, Hohloch K, Riecken EO. HIV/SIV enteropathy. Ann N Y Acad Sci. 1998;859:139–148. doi: 10.1111/j.1749-6632.1998.tb11118.x. [DOI] [PubMed] [Google Scholar]
- 28.Nakamura YK, Janowitz C, Metea C, et al. Short chain fatty acids ameliorate immune-mediated uveitis partially by altering migration of lymphocytes from the intestine. Sci Rep. 2017;7:11745. doi: 10.1038/s41598-017-12163-3. [DOI] [PMC free article] [PubMed] [Google Scholar]
- 29.Miele L, Valenza V, La Torre G, et al. Increased intestinal permeability and tight junction alterations in nonalcoholic fatty liver disease. Hepatology. 2009;49:1877–1887. doi: 10.1002/hep.22848. [DOI] [PubMed] [Google Scholar]
- 30.Moschen AR, Gerner RR, Wang J, et al. Lipocalin 2 protects from inflammation and tumorigenesis associated with gut microbiota alterations. Cell Host Microbe. 2016;19:455–469. doi: 10.1016/j.chom.2016.03.007. [DOI] [PubMed] [Google Scholar]
- 31.Wozniak KL, Hole CR, Yano J, Fidel PL, Jr, Wormley FL., Jr Characterization of IL-22 and antimicrobial peptide production in mice protected against pulmonary Cryptococcus neoformans infection. Microbiology. 2014;160:1440–1452. doi: 10.1099/mic.0.073445-0. [DOI] [PMC free article] [PubMed] [Google Scholar]
- 32.Lugering N, Stoll R, Kucharzik T, et al. Immunohistochemical distribution and serum levels of the Ca(2+)-binding proteins MRP8, MRP14 and their heterodimeric form MRP8/14 in Crohn's disease. Digestion. 1995;56:406–414. doi: 10.1159/000201267. [DOI] [PubMed] [Google Scholar]
- 33.Rodenburg W, Keijer J, Kramer E, et al. Salmonella induces prominent gene expression in the rat colon. BMC Microbiol. 2007;7:84. doi: 10.1186/1471-2180-7-84. [DOI] [PMC free article] [PubMed] [Google Scholar]
- 34.Pavlidis P, Gulati S, Dubois P, et al. Early change in faecal calprotectin predicts primary non-response to anti-TNFalpha therapy in Crohn's disease. Scand J Gastroenterol. 2016;51:1447–1452. doi: 10.1080/00365521.2016.1205128. [DOI] [PubMed] [Google Scholar]
- 35.Chassaing B, Srinivasan G, Delgado MA, Young AN, Gewirtz AT, Vijay-Kumar M. Fecal lipocalin 2, a sensitive and broadly dynamic non-invasive biomarker for intestinal inflammation. PLoS One. 2012;7:e44328. doi: 10.1371/journal.pone.0044328. [DOI] [PMC free article] [PubMed] [Google Scholar]
- 36.Thorsvik S, Damas JK, Granlund AV, et al. Fecal neutrophil gelatinase-associated lipocalin as a biomarker for inflammatory bowel disease. J Gastroenterol Hepatol. 2017;32:128–135. doi: 10.1111/jgh.13598. [DOI] [PubMed] [Google Scholar]
Associated Data
This section collects any data citations, data availability statements, or supplementary materials included in this article.