

Abstract
The species of Artemisia, one of the largest genera of the family Asteraceae, are frequently utilized for the treatment of diseases such as malaria, hepatitis, cancer, inflammation, and infections by fungi, bacteria, and viruses. Karyological studies were performed on 18 Artemisia khorassanica populations: eleven were diploid (2n = 18) and seven were tetraploid (2n = 36). The mean chromosome lengths were 3.61 and 3.84 µm for diploids and tetraploids, respectively. Two chromosome types (“m”, “sm”) formed karyotype formulas “18m” for diploids and “36m” and “34m + 2sm” for tetraploids. The mean 2C DNA contents were 5.91 and 11.53 pg in diploids and tetraploids, respectively. The transcription levels of key genes involved in artemisinin production were compared in diploid (B, D, H) and tetraploid (O, P, R) A. khorassanica relative to A. annua as a standard species. No artemisinin content was detected in diploid and tetraploid A. khorassanica populations. No significant diefrences were detected between diploids and tetraploids in terms of DXR , HMGR, FDS, and ADS gene expression. This implies that most of the genomic amplification likely occurs in the amount of repetitive DNA and not in unique sequences. The DBR2 gene was expressed in the diploid A. khorassanica in a low amount but silenced in the autotetraploid A. khorassanica.
Keywords: Artemisia khorassanica, artemisinin, chromosome, flow cytometry, gene expression, genome size
1. Introduction
Artemisia L. is the largest genus of small herbs and shrubs belonging to the family Asteraceae. It comprises over 500 species, which are mainly found in Asia, Europe, and North America (Bora and Sharma, 2011) . Asia has the greatest concentration of species and there are 35 species of this genus in Iran (Abad et al., 2012) , some of which are endemic to Iran, e.g., A. khorassanica. Data about karyotypes can be helpful in species recognition and analysis of hybrid populations in genetic and breeding studies (Anjali and Srivastava, 2012) . The genus Artemisia has two basic chromosome numbers of x = 9, present in all the subgenera, and the less frequent x = 8, present in some subgenera (Oliva and Vallès, 1994; McArthur and Sanderson, 1999; Dolatyari et al., 2013) . The reason for this descending dysploidy, reducing the basic chromosome number from x = 9 to 8, may have been a centric Robertsonian chromosome fusion, as is widely accepted (Vallès and Siljak-Yakovlev, 1997; Pellicer et al., 2011) . Moreover, a basic number of x = 7 was previously reported for Artemisia pattersonii by Wiens and Richter (1966) . Flow cytometry is known as the most reliable and quick method for estimating the genome size (2C DNA) for a wide range of plant communities (Garcia et al., 2004; Doležel and Bartoš, 2005; Doležel et al., 2007; Loureiro et al., 2007; Mahdavi and Karimzadeh, 2010; Majdi et al., 2010; Karimzadeh et al., 2010, 2011; Abedi et al., 2015; Tavan et al., 2015; Tarkesh Esfahani et al., 2016; Javadian et al., 2017) . The term “C-value” refers to the constant amount of DNA of an unreplicated haploid chromosome complement (Swift, 1950) . Artemisia species are frequently utilized as medicinal plants for the treatment of diseases such as malaria, hepatitis, cancer, inflammation, and infections by fungi, bacteria, and viruses (Willcox, 2009) . Terpenes are diversified and abundant in the genus Artemisia (Vallès et al., 2011) . The basic C 5 precursors for terpenoid biosynthesis are synthesized via two distinct pathways: the mevalonate (MVA) pathway in the cytosol and the methylerythritol phosphate (MEP) pathway in plastids ( Vranová et al., 2013 ). Farnesyl diphosphate (FDP) is an important product at the branch point of terpenoid metabolism that is produced by farnesyl diphosphate synthase (FDS). The conversion of FDP into amorpha-4,11-diene, which has been proposed as the first specific precursor of artemisinin, is catalyzed by amorpha4,11-diene synthase (ADS; Kim et al., 2006) . Artemisinin, a sesquiterpene lactone, is an eefctive antimalarial drug, active against some cancers, hepatitis B, and schistosomiasis (Eefrth, 2009) and produced in glandular trichomes of some Artemisia species, e.g., A. aaftngutica , A. absinthium, A. bushriences, A. cina, A. dracunculus, A. dubia, A. indica, A. japonica, A. moorcroiftana, A. parvioflra , A. roxburghiana, A. sieberi, A. vulgaris, A. campestris, A. difusa, A. scoparia, A. sieberi, A. deserti, A. marschalliana, and A. persica (Arab et al., 2006; Hsu, 2006; Zia et al., 2007; Mannan et al., 2010; Ranjbar et al., 2015; Salehi et al., 2018) . DBR2 (artemisinic aldehyde Δ11(13) reductase) was reported as a limiting factor of artemisinin biosynthesis in Artemisia species (Salehi et al., 2018) . The expression of Aa-ADS was not detected in A. afra and A. absinthium, but expression of Aa-CYP71AV1 was detected in both species (Komori et al., 2013) . Moreover, the expression of Aa-DBR2 was reported in A. absinthium (Muangphrom et al., 2014) . The artemisinin biosynthetic pathway (Aa-ADS, Aa-CYP71AV1, Aa-ALDH1, Aa-DBR2, and Aa-RED1) was studied in eight Artemisia species, where A. absinthium showed a higher expression level of both genes Aa-ALDH1 and Aa-CYP71AV1 compared to A. annua at all developmental stages (Ranjbar et al., 2015) . Five Artemisia species with different artemisinin contents were studied and it was reported that the artemisinin content of A. deserti (S4, 5.30 mg g–1 DW) was significantly the same as that of A. annua of Iran (S1, 6.27 mg g–1 DW) and less than that of A. annua cv ‘Anamed’ (14.50 mg g–1 DW) despite having the highest glandular trichome area per leaf and high relative expression of Aa-ADS, AaALDH1, Aa-CYP71AV1, Aa-TTG1, and Aa-TFAR1 (Salehi et al., 2018) . Considering that A. khorassanica is endemic to Iran, the knowledge of sesquiterpene biosynthesis in this species is substantial for natural products research in the near future. Thus, for knowledge on artemisinin biosynthesis in A. khorassanica, the expression of key genes involved in artemisinin production was assessed in diploid and tetraploid A. khorassanica populations. In the current study, the chromosomal parameters and intraspecific variations in genomic DNA amount (DNA C-value) were assessed between Iranian endemic flora of A. khorassanica populations, and the artemisinin content and expression level of one enzyme of the MEP pathway, 1-deoxy-D-xylulose 5-phosphate reductase (DXR), one enzyme of MVA pathway, 3-hydroxy-3-methyl-glutaryl coenzyme A reductase (HMGR), FDS, and two key enzymes of the artemisinin biosynthesis pathway (ADS and DBR2) were assessed in diploid and tetraploid A. khorassanica populations.
2. Materials and methods
Seeds of 18 populations of Iranian endemic A. khorassanica were obtained from the Artemisia collection of the Iranian Biological Resource Center (Table 1), Tehran, Iran. Seeds were planted in cultivation trays containing 1:1 perlite and peat moss with a photoperiod of 16 h and light intensity of 70 µmol m–2 s–1 at 23 °C and then were transplanted into pots containing 1:2 field soil and perlite in the 6-leaf stage with a photoperiod of 12 h and light intensity of 99 µmol m–2 s–1 at 25 °C in the greenhouse of the Faculty of Agriculture, Tarbiat Modares University, Tehran, Iran. Karyotype and nuclear DNA content were determined in these 18 populations. Half of each leaf was cut and mixed for RNA extraction and expression analyses, and another half was investigated for artemisinin measurement. Flow cytometric 2C DNA contents, artemisinin, and RNA extraction were performed with three replications and karyological study was done with vfie replications. For artemisinin and RNA extraction, each replication was a mixture of three sampled plants (upper branches). For karyological study and flow cytometric 2C DNA contents, each replication was one individual plant.
Table 1.
Local information of collected Iranian endemic Artemisia khorassanica populations.
| Population codes | Local collection sites | Latitude (N) | Longitude (E) | Altitude (m) | Mean Temp (°C) | Mean rainfall (mm) |
|---|---|---|---|---|---|---|
| A | Semnan, Iran | 36°36′38.7″ | 55°23′31.4″ | 1276 | 15.03 | 10.66 |
| B | Semnan, Iran | 36°26′45.8″ | 54°58′37.8″ | 1412 | 15.03 | 10.66 |
| C | Khorasan, Iran | 37°30′25.6″ | 59°13′22.0″ | 337 | 17.88 | 8.77 |
| D | Semnan, Iran | 36°39′48.2″ | 55°19′32.1″ | 1445 | 15.03 | 10.66 |
| E | Khorasan, Iran | 36°38′09.7″ | 58°16′35.6″ | 1385 | 11.95 | 27.26 |
| F | Khorasan, Iran | 36°52′25.2″ | 58°56′31.7″ | 1266 | 15.98 | 18.30 |
| G | Khorasan, Iran | 36°00′51.5″ | 59°38′19.9″ | 1226 | 15.89 | 18.23 |
| H | Semnan, Iran | 36°16′31.2″ | 54°05′03.8″ | 1517 | 17.83 | 8.29 |
| I | Semnan, Iran | 35°54′09.8″ | 55°08′37.6″ | 1080 | 17.83 | 8.29 |
| J | Semnan, Iran | 36°45′17.6″ | 55°17′15.4″ | 1686 | 15.03 | 10.66 |
| K | Khorasan, Iran | 35°35′38.2″ | 59°06′41.6″ | 1640 | 14.61 | 17.92 |
| L | Khorasan, Iran | 37°42′36.2″ | 57°47′27.9″ | 1590 | 13.39 | 18.22 |
| M | Khorasan, Iran | 37°15′41.8″ | 59°18′00.8″ | 612 | 17.88 | 18.77 |
| N | Semnan, Iran | 36°41′00.5″ | 55°17′15.4″ | 1574 | 15.03 | 10.66 |
| O | Golestan, Iran | 37°54′38.3″ | 55°41′51.2″ | 133 | 17.64 | 43.51 |
| P | Semnan, Iran | 36°19′57.5″ | 54°57′06.5″ | 1235 | 15.03 | 10.66 |
| Q | Khorasan, Iran | 34°00′07.9″ | 58°48′43.1″ | 1541 | 20.12 | 10.20 |
| R | Khorasan, Iran | 33°44′21.9″ | 59°23′54.1″ | 1320 | 15.32 | 11.92 |
2.1. Chromosome preparation
Growing roots were used for cytogenetic studies. The best method to study mitosis for preparing a karyotype is the use of root tip meristem tissues. The appropriate root length and time (when the largest number of cells are in metaphase) were chosen to cut the roots. For the cytological preparations, growing roots of about 1 cm long were removed and pretreated in 0.02% (w/v) colchicine for 3.5 h at room temperature (RT) in the dark to induce metaphase arrest, followed by washing three times (each for 5 min) in distilled H O and fixing in fresh 3:1 (v/v) absolute ethanol:glacial acetic acid for 24 h at 4 °C (Karimzadeh et al., 2010, 2011; Shariat et al., 2013) . The fixed roots were hydrolyzed in 1 M HCl for 10 min at RT, then washed three times (each for 5 min) in distilled H O and stained in 2% (w/v) aceto-orcein for 3 h at RT. Five well-spread monolayer metaphase plates from different individuals were analyzed per each population of A. khorassanica. High-resolution microscopic digital photographs were taken using an Olympus BX50 microscope (Olympus Optical Co., Tokyo, Japan), equipped with an Olympus DP12 digital camera (Olympus Optical Co.). Six chromosomal parameters were either measured as long (L) and short (S) arm lengths or calculated as chromosome length (CL), arm ratio (AR; L/S), total chromosome volume (TCV = πr2 CL) where r = average chromosome radius, and centromeric index (CI = S/CL). Idiograms were drawn from the mean values, and chromosome types were determined using the formula of Levan et al. (1964) . For analysis of karyotype asymmetry, the following parameters were also assessed: Stebbins asymmetry categories (Stebbins, 1971) , Romero-Zarco (1986) intrachromosomal (A1) and interchromosomal (A2) asymmetry indices, coeficient of variation of chromosome length (CVCL; Paszko, 2006) , and mean centromeric asymmetry (MCA; Paszko, 2006) . For CVCL and MCA, a larger value signifies greater asymmetry in the karyotype.
2.2. Flow cytometric (FCM) assessment
FCM studies were performed using the propidium iodide (PI) staining method and Pisum sativum ‘Ctirad’ (2C DNA = 9.09 pg; Doležel et al., 2007 ) as an internal reference standard plant. Plant materials of 1 cm2 (leaves of A. khorassanica and P. sativum ‘Ctirad’) were chopped with a sharp razor blade in 1 mL of woody plant buefr (Loureiro et al., 2007) in a petri dish followed by filtering the isolated nuclei through a Partec 30-µm nylon mesh (Partec, Münster, Germany). Then 50 µL of PI and 50 µL of RNase were added to the suspension of isolated nuclei. To determine genomic 2C DNA amount, the nuclei suspension was analyzed with a BD FACSCanto flow cytometer (BD Biosciences, Bedford, MA, USA), equipped with an argon ion laser (488 nm), using BD FACSDiva software. Three replications were considered for genome size measurements. Histograms were gated in Partec FloMax ver. 2.4e. The measurements of relative fluorescence intensity of stained nuclei were performed on a linear scale. The absolute DNA amount of a sample was calculated based on the values of the G1 peak means (Doležel et al., 2003, 2007; Doležel and Bartoš, 2005 ) as follows: Sample 2C DNA (pg) content = (Sample G1 peak mean/standard G1 peak mean) × standard 2C DNA amount (pg). 1Cx-DNA value was calculated based on the conversion formula proposed by Doležel et al. (2003) , where 1 pg of DNA represents 978 Mbp. The mean coeficients of variation (CV%) of FCM measurements were less than 5%.
2.3. Artemisinin extraction
For high-performance liquid chromatography (HPLC) analysis, the leaves were sampled from the upper branches and dried in the dark. Artemisinin was analyzed from the leaves with a procedure described by Salehi et al. (2018) .
2.4. Real-time RT-PCR
Total RNA was extracted using a GeneAll Ribospin total RNA purification kit (Pd No.: 3033523) according to the manufacturer’s instructions. In addition, the remaining genomic DNA was removed using RNase-Free DNase (QIAGEN, 79254). First-strand cDNA was synthesized with 1 µg of total RNA using RevertAid M-MuLV Reverse Transcriptase following the manufacturer’s protocol to finally obtain 20 µL of cDNA solution (Fermentas, K1622). The qPCR primer of DBR2 was designed using Oligo 7 and OligoAnalyzer. The qPCR primers of Actin , ADS (Salehi et al., 2018) , DXR, HMGR (Olofsson et al., 2011) , and FDS (Zare Mehrjerdi et al., 2013) genes were obtained from documents (Table 2). Relative expression levels were calculated using the 2–∆CT method (Livak and Schmittgen, 2001) .
Table 2.
| Target gene | Primer sequences | Amplicon lengths (bp) |
|---|---|---|
| DXR | F: 5ʹ-GGTGATGAAGGTGTTGTTGAGGTT-3ʹ | 160 |
| R: 5ʹ-AGGGACCGCCAGCAATTAAGGT-3ʹ | ||
| HMGR | F: 5ʹ-GGGCGTGGAAAATCTGTTGTGTTC-3ʹ | 136 |
| R: 5ʹ-GAACCAGCAATAGCAGAACCAGTAA-3ʹ | ||
| ADS | F: 5ʹ-CCGAGCAAGAAAGAAAACATAG-3ʹ | 203 |
| R: 5ʹ-AACTTCAAGAAACTGGCACA-3ʹ | ||
| FDS | F: 5ʹ-GAACTCGCCAATGAGGAACA-3ʹ | 200 |
| R: 5ʹ-TTTCAGCACCGCTTGGACT-3′ | ||
| DBR2 | F: 5ʹ-GCGGTGGTTACACTAGAGAACTT-3ʹ | 223 |
| R: 5ʹ-CAAAACTAGAGGAGTGACCC-3ʹ | ||
| ACTIN | F: 5ʹ-CCCCTGCTATGTATGTTGCCA-3ʹ | 202 |
| R: 5ʹ-CGCTCGGTAAGGATCTTCATCA-3ʹ |
2.5. Statistical analysis
The data were first examined for normality and were then analyzed based on a completely randomized design with three replications for flow cytometric 2C DNA contents, artemisinin, and RNA extraction and vfie replications for karyological study. The least significant diefrence (LSD) test was used for means comparison and a correlation method was applied for cluster analysis to test chromosomal similarity among populations. Clustering was performed, using the unweighted pair group method with arithmetic mean (UPGMA). Statistical analyses were performed using Minitab 16 and SAS software packages.
3. Results
3.1. Karyological analysis
From the eighteen populations of examined Iranian endemic A. khorassanica, eleven were diploid (2n = 2x = 18) and seven were tetraploid (2n = 2x = 36). ANOVA showed significant differences between the populations for most studied parameters (Table 3), confirming intraspecific chromosomal variations. Karyotypes of those somatic complements are demonstrated in Figures 1A–1R. In diploids, there were significant (P < 0.01) differences for S, L, CL, and TCV. In tetraploids, there were significant (P < 0.01) differences in all parameters tested (S, L, CL, TCV, AR, CI). In diploids, mean CL was 3.61 µm (varied from 3.48 µm in “G” to 3.94 µm in “J”), while in tetraploids it was 3.84 µm (ranged from 3.68 µm in “L” to 4.03 µm in “M”). The mean TCV was 5.21 µm 3 (5.06–5.92 µm, G–J) in diploids and 5.31 µm3 (5.19–6.03 µm3, Q–M) in tetraploids. In tetraploids, mean CI varied from 42 (N, P, R) to 44 (L). According to various karyotypic symmetrical indices, Artemisia populations showed different symmetrical groups. Karyotypes of diploid and tetraploid populations were classified in the 1A category (Stebbins, 1971) . For more detailed studies of asymmetry, Romero-Zarco (1986) indices of A1 and A2 were also considered (Table 4). The scatter diagram (not shown) of these indices presents three groups in diploid (Group 1, A, C, E–H; Group 2, B, D, I, J; Group 3, K) and tetraploid (Group 1, L, O; Group 2, M, Q; Group 3, N, P, R) populations. Table 4 also shows two more asymmetry indices of MCA and CVCL. Very similar to the A1 and A2 indices, the scatter plot (not shown) of MCA vs. CVCL illustrates three groups in diploid (Group 1, A, B, C, E–H; Group 2, D, I, J; Group 3, K) and tetraploid (Group 1, L, O; Group 2, M, Q; Group 3, N, P, R) populations. The Ward dendrogram constructed on the basis of karyotype similarities (Figure 2) shows three major clusters for either ploidy level. In diploids, the clusters comprise (A, B, F, G, H), (C, E, K), and (D, J, I) populations, and in tetraploids the clusters consist of (L, Q), (M, O), and (N, P, R) populations.
Table 3.
ANOVA for chromosomal parameters and 2C DNA amounts of eleven 2x (A–K) and seven 4x (L–R) Artemisia khorassanica populations.
| S.O.V. | Df | MS | |||||
|---|---|---|---|---|---|---|---|
| S | L | CL | AR | TCV | CI | ||
| 2x | 10 | 12.23** | 0.113** | 7.966** | 1.45ns | 0.127** | 1.43ns |
| Error | 484 | 0.76 | 0.004 | 0.242 | 0.98 | 0.007 | 0.98 |
| 4x | 6 | 17.72** | 21.082** | 0.149** | 4.46** | 0.132** | 3.88** |
| Error | 623 | 0.83 | 0.802 | 0.005 | 0.96 | 0.008 | 0.97 |
| S.O.V. | Df | 2C DNA | |||||
| 2x | 10 | 0.019** | |||||
| Error | 22 | 0.76 | |||||
| 4x | 6 | 0.076* | |||||
| Error | 14 | 0.83 | |||||
ns, *, **: Nonsignificant (P > 0.05) and significant differences (P < 0.05, P < 0.01), respectively.
Figure 1.

Somatic chromosomes of eleven 2x (2n = 18; A–K) and seven 4x (2n = 36; L–R) populations of Artemisia khorassanica. Arrow indicates B-chromosomes (B). Scale bar = 5 μm.
Table 4.
Karyotypic symmetry formula and flow cytometric genome size of eleven 2x (A–K) and seven 4x (L–R) Artemisia khorassanica populations.
| Population codes | Asymmetry indices | ST1 | KF2 | CV | M | 2C ψ Mean (pg) ± SE | 1 C DNA (pg) | Holoploid (1C DNA) genome size (Mbp) | Monoploid (1 Cx DNA) genome size (Mbp) | |
|---|---|---|---|---|---|---|---|---|---|---|
| A1 | A2 | |||||||||
| 2x = 18 | ||||||||||
| A | 0.22 | 0.09 | 1A | 18m | 8.89 | 13.10 | 5.91 ± 0.052e | 2.955 | 2889.99 | 2889.99 |
| B | 0.24 | 0.08 | 1A | 18m | 8.15 | 10.83 | 5.91 ± 0.014e | 2.955 | 2889.99 | 2889.99 |
| C | 0.22 | 0.10 | 1A | 18m | 9.58 | 13.00 | 6.05 ± 0.023abcd | 3.025 | 2958.45 | 2958.45 |
| D | 0.24 | 0.09 | 1A | 18m | 9.13 | 14.64 | 6.13 ± 0.033a | 3.065 | 2997.57 | 2997.57 |
| E | 0.21 | 0.10 | 1A | 18m | 9.50 | 12.17 | 5.95 ± 0.014cde | 2.975 | 2909.55 | 2909.55 |
| F | 0.21 | 0.10 | 1A | 18m | 9.65 | 12.45 | 6.03 ± 0.042abcde | 3.015 | 2948.67 | 2948.67 |
| G | 0.21 | 0.10 | 1A | 18m | 9.89 | 12.50 | 5.93 ± 0.029de | 2.965 | 2899.77 | 2899.77 |
| H | 0.21 | 0.09 | 1A | 18m | 9.16 | 12.24 | 6.11 ± 0.044ab | 3.055 | 2987.79 | 2987.79 |
| I | 0.27 | 0.09 | 1A | 18m | 9.46 | 16.19 | 5.99 ± 0.033bcde | 2.955 | 2929.11 | 2929.11 |
| J | 0.25 | 0.09 | 1A | 18m | 9.04 | 14.99 | 6.00 ± 0.025bcde | 3.000 | 2934.00 | 2934.00 |
| K | 0.20 | 0.14 | 1A | 18m | 13.58 | 11.62 | 6.08 ± 0.014abc | 3.040 | 2973.12 | 2973.12 |
| 4x = 36 | ||||||||||
| L | 0.20 | 0.12 | 1A | 36m | 11.67 | 11.30 | 11.61 ± 0.055cd | 5.805 | 5677.29 | 2838.65 |
| M | 0.24 | 0.10 | 1A | 36m | 10.16 | 13.96 | 11.97 ± 0.087a | 5.985 | 5853.33 | 2926.67 |
| N | 0.27 | 0.11 | 1A | 34m + 2sm | 10.88 | 16.71 | 11.83 ± 0.077abc | 5.915 | 5784.87 | 2892.44 |
| O | 0.22 | 0.11 | 1A | 36m | 10.65 | 12.67 | 11.69 ± 0.017bcd | 5.845 | 5716.41 | 2858.21 |
| P | 0.26 | 0.08 | 1A | 36m | 8.35 | 15.34 | 11.83 ± 0.054abc | 5.915 | 5784.87 | 2892.43 |
| Q | 0.23 | 0.09 | 1A | 36m | 9.48 | 13.70 | 11.89 ± 0.118ab | 5.945 | 5814.21 | 2907.11 |
| R | 0.27 | 0.10 | 1A | 34m + 2sm | 10.04 | 16.54 | 11.53 ± 0.142d | 5.765 | 5638.17 | 2819.09 |
1ST: Stebbins classification (1971), 2KF: Karyotype formula. ψ Means with different superscript letters are significantly different in 2x (P < 0.01) and in 4x (P < 0.05).
Figure 2.

Dendrogram showing the phenetic relationships among the studied 2x and 4x Artemisia khorassanica populations, constructed using the Ward method. Cophenetic correlation (2x) = 0.83 and (4x) = 0.85.
3.2. Flow cytometric analysis
ANOVA indicated significant differences for nuclear 2C DNA amount between diploid (P < 0.01) and tetraploid (P < 0.05; Table 4) populations, verifying intraspecific genome size variation. The mean 2C DNA values were 5.91 pg (ranged from 5.91 pg in “A” and “B” to 6.13 pg in “D”) and 11.53 pg (ranged from 11.53 pg in “R” to 11.97 pg in “M”) in diploids and tetraploids, respectively (Table 4). The histograms obtained for analyzing genomic DNA amount contained two peaks (Figure 3). In diploids (A– K), the left peaks refer to the unknown A. khorassanica samples and the right peaks to the known Pisum sativum ‘Ctirad’ (2C DNA = 9.09 pg) internal reference standard. In tetraploids (L–R), the left peaks refer to the reference standard plant and the right peaks to the unknown A. khorassanica samples. The coeficients of variation (CVs) of G1 peaks were less than 5% for A. khorassanica populations and for P. sativum samples. No significant correlations were identified between 2C DNA content and any environmental conditions (latitude, longitude, altitude, average annual temperature, and rainfall).
Figure 3.

Flow cytometric 2C DNA content histograms of eleven 2x (A–K) and seven 4x (L–R) Artemisia khorassanica populations. In A–K, the left peaks refer to the G1 peaks of 2x samples and the right peaks refer to the G1 peaks of Pisum sativum ‘Ctirad’ (2C DNA = 9.09 pg) as an internal reference standard plant. In L–R, the left peaks refer to the reference standard plant and the right peaks refer to the 4x samples.
3.3. Artemisinin content and relative gene expression analysis
Artemisia populations having relatively high, moderate, and low genome sizes (Table 4) were selected from the diploids (D, H, B) and tetraploids (P, O, R) for HPLC and gene expression analysis. Artemisinin content of A. annua was 3.6 ± 0.23 mg g–1 DW, while no artemisinin content was detected in diploid and tetraploid A. khorassanica populations (Figure 4). The transcription levels of the vfie enzymes in the diploid (D, H, B) and tetraploid (P, O, R) populations were compared relatively to A. annua, which was chosen as the reference species (Figure 5). There were no obvious differences between the diploid and tetraploid populations of A. khorassanica in terms of DXR, HMGR, FDS, and ADS gene expressions. The expression levels of the DXR and FDS genes in A. khorassanica were higher than those in A. annua (Figure 5). The DBR2 gene was expressed very low (P < 0.01) in the diploid A. khorassanica but silenced in the autotetraploid A. khorassanica. The expression level of the ADS gene, which is the main gene involved in the artemisinin biosynthesis pathway, was very low (P < 0.01) in A. khorassanica diploid and tetraploid populations (Figure 5).
Figure 4.
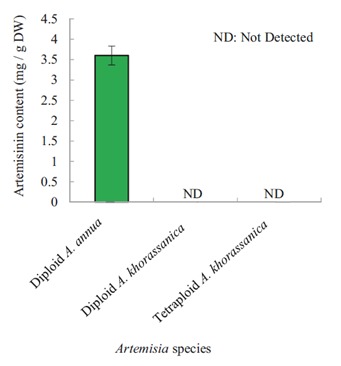
Artemisinin content of A. annua and genome sizebased selected 2x and 4x Artemisia khorassanica populations.
Figure 5.

Relative expression of genes involved in artemisinin biosynthesis in genome size-based selected 2x and 4x Artemisia khorassanica populations relative to 2x A. annua (the reference species) at vegetative stage. Error bars are shown as SE (n = 3). Means within a gene followed by the same letter are not significantly different according to the LSD at P < 0.01.
4. Discussion
In the present study, most of the chromosomal parameters were significantly different in diploid (L, S, CL, TCV) and in tetraploid (L, S, CL, TCV, AR, CI) A. khorassanica populations. Diefrences between diploid and tetraploid populations for most karyological parameters confirm the intraspecific chromosomal variations. These results are in agreement with those reported by Selma et al. (2011) and Kurşat et al. (2015) for A. campestris and A. scoparia in terms of AR and CI. Dolatyari et al. (2013) studied 28 Artemisia species and reported two basic chromosome numbers of x = 8, 9, each with diploid, tetraploid, and hexaploid levels. Three populations were A. khorassanica (2n = 2x = 18), one of which (P1000307) had one additional B chromosome. In our present study, the B chromosome was identified in one diploid population (Figure 1B).
In other reports, one B chromosome was reported in polyploid series, with known levels up to dodecaploid for x = 9 and hexaploid for x = 8 (Oliva and Vallès, 1994; McArthur and Sanderson, 1999) . In the current study, two chromosome types (“m”, “sm”) formed karyotype formulas of “18m” for diploids and “36m” and “34m + 2sm” for tetraploids. Similar to our findings, Dolatyari et al. (2013) reported the same two chromosome types in diploid A. khorassanica populations, but they formed two different karyotype formulas of “16m + 2sm” and “14m + 4sm”. In the latter report, one more chromosome type of “st” was reported, as well as various karyotype formulas for other studied Artemisia species. Dolatyari et al. (2013) reported that the mean CL of A. khorassanica was 5.11 µm while 1ST: Stebbins classification (1971), 2KF: Karyotype formula. ψ Means with different superscript letters are significantly different in 2x (P < 0.01) and in 4x (P < 0.05). that in our 18 A. khorassanica population was 3.70 µm. hTis indicates smaller chromosomes of this species in our study compared to that reported previously by Dolatyari et al. (2013) . Karyotype symmetry was more indicative of evolutionary traits in the studied A. khorassanica populations, regardless of ploidy levels. These results are in agreement with those reported by Zhen et al. (2010) and Dolatyari et al. (2013) .
The mean 2C DNA amount was 5.91 ± 0.22 pg in diploid and 11.53 ± 0.44 pg in tetraploid populations, verifying intraspecific genome size variation irrespective of ploidy level. On the other hand, the genome size (1C DNA) varied from 2890 to 2998 Mbp (±108 Mbp) in diploids and 2819 to 2927 Mbp (±108 Mbp) in tetraploids. These results are in agreement with previous studies of 67 species of Artemisia, which indicated 2C DNA = 5.33 pg in diploids, 10.07 pg in tetraploids, 15.63 pg in hexaploids, and 23.90 in decaploids as reported by Pellicer et al. (2007) . Likewise, Torrell and Vallès (2001) and Garcia et al. (2004) reported the nuclear DNA content increases with increasing ploidy level, although the monoploid genome size decreased with increased polyploidy in different studies on Artemisia. One of the main evolutionary forces that influence the large variation in nuclear DNA content is polyploidy. It is very prevalent in Artemisia and reflects the high genetic flexibility of this genus, where ploidy levels up to 16x have been reported (Pellicer et al., 2007) . The high percentage of polyploids, the ability of the genus to colonize different ecosystems from sea level to high mountains, and its adaptation to wide and unstable regional situations may be the basic properties that favored its successful expansion across the landscape (Pellicer et al., 2007) . In the present study, there were no significant correlations between 2C DNA amount and environmental conditions (latitude, longitude, altitude, average annual temperature, and rainfall). It is thus concluded that the genome size of A. khorassanica populations is independent of changes in environmental conditions. Karimzadeh et al. (2010) , working on 20 populations of Iranian endemic muskmelon (Cucumis melo var. inodorus), reported no relationship between genome size and altitude and longitude, but a close relationship was detected between latitude and nuclear DNA amount. In another study on many Lathyrus sativus genotypes, Karimzadeh et al. (2011) reported a significant positive linear relationship between nuclear DNA content and longitude. Furthermore, Abedi et al. (2015) reported no relationship between altitude and genome size in 22 Iranian populations of nine different Tulipa species.
In both ploidy levels of A. khorassanica, the FDS and DXR genes were expressed at higher levels than in A. annua, but the reverse was true for the ADS and DBR2 genes. FDP is a common precursor of other sesquiterpenes, as well as of sterols, and may thus be used for the production of other terpenoids than artemisinin.
No significant differences were detected between diploids and tetraploids in terms of artemisinin content (Figure 4) and expression of DXR, HMGR, FDS, and ADS genes (Figure 5). Having different ploidy levels had no eefct on these genes’ expressions since the tetraploid populations were not naturally generated by polyploidy induction. This implies that the most of the genomic amplification likely occurs in the amount of repetitive DNA and not in unique sequences. In some cases, genomic amplification occurs in breeding populations in reaction to environmental or developmental disorders (Cullis, 1987) . Most of these differences occur in the amount of repetitive DNA and not in the unique sequences (Hancock, 2012) . Over time, some of the duplication genes remain functional and may derive new cellular roles, while others move along the road to diploidization (Hancock, 2012) . The DBR2 gene was expressed in very low levels in the diploid A. khorassanica Adams and Wendel (2005) reported that two genes were expressed in diploid Arabidopsis thaliana but silenced in the autotetraploid A. thaliana, and they mentioned that transposition of the sunsfih transposon appears to have occurred in autopolyploid A. thaliana. Regarding the importance of the ADS and DBR2 genes in the production of artemisinin, it might be concluded that the main reason for not producing artemisinin in A. khorassanica is related to the extremely low expression level of the key genes of ADS and DBR2 compared to that in A. annua. Similarly, all previous studies reported that other Artemisia species produced less artemisinin content than A. annua L. (Arab et al., 2006; Hsu, 2006; Zia et al., 2007; Mannan et al., 2010; Ranjbar et al., 2015; Salehi et al., 2018) .
Acknowledgment
The authors gratefully acknowledge the support provided for this survey by Tarbiat Modares University, Tehran, Iran.
References
- Abad MJ , Bedoya LM , Apaza L , Bermejo P ( 2012. ). The Artemisia L. genus: a review of bioactive essential oils . Molecules 17 : 2542 - 2566 . [DOI] [PMC free article] [PubMed] [Google Scholar]
- Abedi R , Babaei A , Karimzadeh G ( 2015. ). Karyological and flow cytometric studies of Tulipa (Liliaceae) species from Iran . Plant Syst Evol 301 : 1473 - 1484 . [Google Scholar]
- Adams KL , Wendel JF ( 2005. ). Novel pattern of gene expression in polyploidy plants . Trends Genet 21 : 539 - 543 . [DOI] [PubMed] [Google Scholar]
- Anjali M , Srivastava AK ( 2012. ). Karyological studies in twelve accessions of Carthamus tinctorius . Caryologia 65 : 1 - 6 . [Google Scholar]
- Arab HA , Rahbari S , Rassouli A , Moslemi MH , Khosravirad F ( 2006. ). Determination of artemisinin in Artemisia sieberi and anticoccidial eefcts of the plant extract in broiler chickens . Trop Anim Health Prod 38 : 497 - 503 . [DOI] [PubMed] [Google Scholar]
- Bora KS , Sharma A ( 2011. ). The genus Artemisia : a comprehensive review . Pharm Biol 49 : 101 - 109 . [DOI] [PubMed] [Google Scholar]
- Cullis CA ( 1987. ). The generation of somatic and heritable variation in response to stress . Am Nat 130 : S62 - S73 . [Google Scholar]
- Dolatyari A , Vaalès J , Naghavi MR , Fazeli SAS ( 2013. ). Karyological data of 47 accessions of 28 Artemisia (Asteraceae, Anthemideae) species from Iran, with first new reports for Iranian populations and first absolute counts in three species . Plant Syst Evol 299 : 1503 - 1518 . [Google Scholar]
- Doležel J , Bartoš J ( 2005. ). Plant DNA flow cytometry and estimation of nuclear genome size . Ann Bot 95 : 99 - 110 . [DOI] [PMC free article] [PubMed] [Google Scholar]
- Doležel J , Bartoš J , Voglmayr H , Greilhuber J ( 2003. ). Nuclear DNA content and genome size of trout and human . Cytometry 51 : 127 - 128 . [DOI] [PubMed] [Google Scholar]
- Doležel J , Greilhuber J , Suda J ( 2007. ). Estimation of nuclear DNA content in plants using flow cytometry . Nat Protoc 2 : 2233 - 2244 . [DOI] [PubMed] [Google Scholar]
- Eefrth T ( 2009. ). Artemisinin: a versatile weapon from traditional Chinese medicine . In: Ramawat KG, editor. Herbal Drugs: Ethnomedicine to Modern Medicine. Berlin, Germany: Springer, pp. 173 - 194 .
- Garcia S , Sanz M , Garnatje T , Kreitschitz A , McArthur ED , Vallès J ( 2004. ). Variation of DNA amount in 47 populations of the subtribe Artemisiinae and related taxa (Asteraceae, Anthemideae): karyological, ecological, and systematic implications . Genome 47 : 1004 - 1014 . [DOI] [PubMed] [Google Scholar]
- Hancock JF ( 2012. ). Plant Evolution and the Origin of Crop Species . East Lansing, MI, USA: Michigan State University.
- Hsu E ( 2006. ). The history of qing hao in the Chinese Trans R Soc Trop Med Hyg 100 : 505 - 508 . [DOI] [PubMed] [Google Scholar]
- Javadian N , Karimzadeh G , Sharifi M , Moieni A , Behmanesh M ( 2017. ). In vitro polyploidy induction: changes in morphology, podophyllotoxin biosynthesis, and expression of the related genes in Linum album (Linaceae) . Planta 245 : 1165 - 1178 . [DOI] [PubMed] [Google Scholar]
- Karimzadeh G , Danesh-Gilevaei M , Aghaalikhani M ( 2011. ). Karyotypic and nuclear DNA variations in Lathyrus sativus (Fabaceae) . Caryologia 64 : 42 - 54 . [Google Scholar]
- Karimzadeh G , Mousavi SH , Jafarkhani-Kermani M , Jalali Javaran M ( 2010. ). Karyological and nuclear DNA variation in Iranian endemic muskmelon (Cucumis melo var . inodorus) . Cytologia 75 : 451 - 461 . [Google Scholar]
- Kim SH , Heo K , Chang YJ , Par SH , Rhee SK , Kim SU ( 2006. ). Cyclization mechanism of amorpha-4 , 11 -diene synthase, a key enzyme in artemisinin biosynthesis . J Nat Prod 69 : 758 - 762 . [DOI] [PubMed] [Google Scholar]
- Komori A , Suzuki M , Seki H , Nishizawa T , Meyer JJM , Shimizu H , Yokoyama S , Muranaka T ( 2013. ). Comparative functional analysis of CYP71AV1 natural variants reveals an important residue for the successive oxidation of amorpha-4,11-diene . FEBS Lett 587 : 278 - 284 . [DOI] [PubMed] [Google Scholar]
- Kurşat M , Civelek Ş , Türkoğlu İ , Tabur S , Gür N ( 2015. ). A new species of subgenus Seriphidium of Artemisia L. (Asteraceae) from Turkey . Turk J Bot 39 : 88 - 95 . [Google Scholar]
- Levan A , Fredga K , Sandberg AA ( 1964. ). Nomenclature for centromeric position on chromosome . Hereditas 52 : 201 - 220 . [Google Scholar]
- Livak KJ , Schmittgen TD ( 2001. ). Analysis of relative gene expression data using real-time quantitative PCR and the 2−ΔΔCT method . Methods 25 : 402 - 408 . [DOI] [PubMed] [Google Scholar]
- Loureiro J , Rodriguez E , Doležel J , Santos C ( 2007. ). Two new nuclear isolation buefrs for plant DNA flow cytometry: a test with 37 species . Ann Bot 100 : 875 - 888 . [DOI] [PMC free article] [PubMed] [Google Scholar]
- Mahdavi S , Karimzadeh G ( 2010. ). Karyological and nuclear DNA content variation in some Iranian Endemic yThmus species (Lamiaceae) . J Agric Sci Technol 12 : 447 - 458 . [Google Scholar]
- Majdi M , Karimzadeh G , Malboobi MA , Omidbaigi R , Mirzaghaderi G ( 2010. ). Induction of tetraploidy to feverfew (Tanacetum parthenium Schulz-Bip.): morphological, physiological, cytological and phytochemical changes . HortScience 45 : 16 - 21 . [Google Scholar]
- Mannan A , Ahmed I , Arshad W , Asim MF , Qureshi RA , Hussain I , Bushra M ( 2010. ). Survey of artemisinin production by diverse Artemisia species in northern Pakistan . Malar J 9 : 310 . [DOI] [PMC free article] [PubMed] [Google Scholar]
- McArthur ED , Sanderson SC ( 1999. ). Cytogeography and chromosome evolution of subgenus Tridentatae of Artemisia (Asteraceae) . Am J Bot 86 : 1754 - 1775 . [PubMed] [Google Scholar]
- Muangphrom P , Suzuki M , Seki H , Fukushima EO , Muranaka T ( 2014. ). Functional analysis of orthologous artemisinic aldehyde D11(13)-reductase reveals potential artemisininproducing activity in non-artemisinin-producing Artemisia absinthium . Plant Biotechnol 31 : 483 - 491 . [Google Scholar]
- Oliva M , Vallès J ( 1994. ). Karyological studies in some taxa of the genus Artemisia (Asteraceae) . Can J Bot 72 : 1126 - 1135 . [Google Scholar]
- Olofsson L , Engström A , Lundgren A , Brodelius PE ( 2011. ). Relative expression of genes of terpene metabolism in different tissues of Artemisia annua L . BMC Plant Biol 11 : 45 - 57 . [DOI] [PMC free article] [PubMed] [Google Scholar]
- Paszko B ( 2006. ). A critical review and a new proposal of karyotype asymmetry indices . Plant Syst Evol 258 : 39 - 48 . [Google Scholar]
- Pellicer J , Garcia S , Garnatje T , Hidalgo O , Korobkov AA , Dariimaa S , Vallès J ( 2007. ). Chromosome counts in Asian Artemisia L. (Asteraceae) species: from diploids to the first report of the highest polyploid in the genus . Bot J Lin Soc 153 : 301 - 310 . [Google Scholar]
- Pellicer J , Garnatje T , Vallès J ( 2011. ). Artemisia (Asteraceae): Understanding its evolution using cytogenetic and molecular systematic tools, with emphasis on subgenus Dracunculus . In: Muñoz-Torrero D , editor. Recent Advances in Pharmaceutical Sciences. Kerala , India: Transworld Research Network, pp. 199 - 222 .
- Ranjbar M , Naghavi MR , Alizadeh H , Soltanloo H ( 2015. ). Expression of artemisinin biosynthesis genes in eight Artemisia species at three developmental stages . Ind Crops Prod 76 : 836 - 843 . [Google Scholar]
- Romero-Zarco C ( 1986. ). A new method for estimating karyotype asymmetry . Taxon 35 : 526 - 530 . [Google Scholar]
- Salehi M , Karimzadeh G , Naghavi MR , Naghdi Badi H , Rashidi Monfared S ( 2018. ). Expression of artemisinin biosynthesis and trichome formation genes in vfie Artemisia species . Ind Crops Prod 112 : 130 - 140 . [Google Scholar]
- Selma T , Civelek Ş , Öney S , Yilmaz ŞB , Kurşat M ( 2011. ). Chromosome numbers and karyotypes of some taxa of genus Artemisia (Asteraceae, Anthemideae) subgenus Dracunculus (Bess .) Rydb. Caryologia 64 : 335 - 342 . [Google Scholar]
- Shariat A , Karimzadeh G , Assareh MH ( 2013. ). Karyology of Iranian endemic Satureja (Lamiaceae) species . Cytologia 78 : 305 - 312 . [Google Scholar]
- Stebbins GL ( 1971. ). Chromosome Evolution in Higher Plants . London, UK: Edward Arnold.
- Swift H ( 1950. ). The constancy of deoxyribose nucleic acid in plant nuclei . P Natl Acad Sci USA 36 : 643 - 654 . [DOI] [PMC free article] [PubMed] [Google Scholar]
- Tarkesh Esfahani S , Karimzadeh G , Naghavi MR ( 2016. ). 2C DNA value of Persian poppy (Papaver bracteatum Lindl.) medicinal plant as revealed by flow cytometry analysis; a quick eefctive criterion for distinguishing unidentified Papaver species . Int J Adv Biotechnol Res 7 : 573 - 578 . [Google Scholar]
- Tavan M , Mirjalili MH , Karimzadeh G ( 2015. ). In vitro polyploidy induction: changes in morphological, anatomical and phytochemical characteristics of yThmus persicus (Lamiaceae) . Plant Cell Tissue Organ Cult 122 : 573 - 583 . [Google Scholar]
- Torrell M , Vallès J ( 2001. ). Genome size in 21 Artemisia L. species (Asteraceae, Anthemideae): systematic, evolutionary and ecological implications . Genome 44 : 231 - 238 . [PubMed] [Google Scholar]
- Vallès J , Garcia S , Hidalgo O , Martín J , Pellicer J , Sanz M , Garnatje T ( 2011. ). Biology, genome evolution, biotechnological issues, and research including applied perspectives in Artemisia (Asteraceae) . Adv Bot Res 60 : 349 - 419 . [Google Scholar]
- Vallès J , Siljak-Yakovlev S ( 1997. ). Cytogenetic studies in the genus Artemisia L.: uflorochrome banded karyotypes of vfie taxa including the Iberian endemic species Artemisia barrelieri Besser . Can J Bot 75 : 595 - 606 . [Google Scholar]
- Vranová E , Coman D , Gruissem W ( 2013. ). Network analysis of the MVA and MEP pathways for isoprenoid synthesis . Annu Rev Plant Biol 64 : 665 - 700 . [DOI] [PubMed] [Google Scholar]
- Wiens D , Richter JA ( 1966. ). Artemisia pattersonii: A 14-chromosome species of alpine sage . Am J Bot 53 : 981 - 986 . [Google Scholar]
- Willcox M ( 2009. ). Artemisia species: from traditional medicines to modern antimalarials-and back again . J Altern Complement Med 15 : 101 - 109 . [DOI] [PubMed] [Google Scholar]
- Zare Mehrjerdi M , Bihamta MR , Omidi M , Naghavi MR , Soltanloo H ( 2013. ). Study on Artemisia annua and Arabidopsis thaliana trichome genes in response to methyl jasmonate and salicylic acid elicitors . Turk J Bot 37 : 499 - 505 . [Google Scholar]
- Zhen L , Chen S , Chen F , Fang W , Li J , Wang H ( 2010. ). Karyotype and meiotic analysis of vfie species in the genus Artemisia . Caryologia 63 : 382 - 390 . [Google Scholar]
- Zia M , Mannan A , Chaudhary MF ( 2007. ). Eefct of growth regulators and amino acids on artemisinin production in the callus of Artemisia absinthium . Pakistan J Bot 39 : 799 - 805 . [Google Scholar]