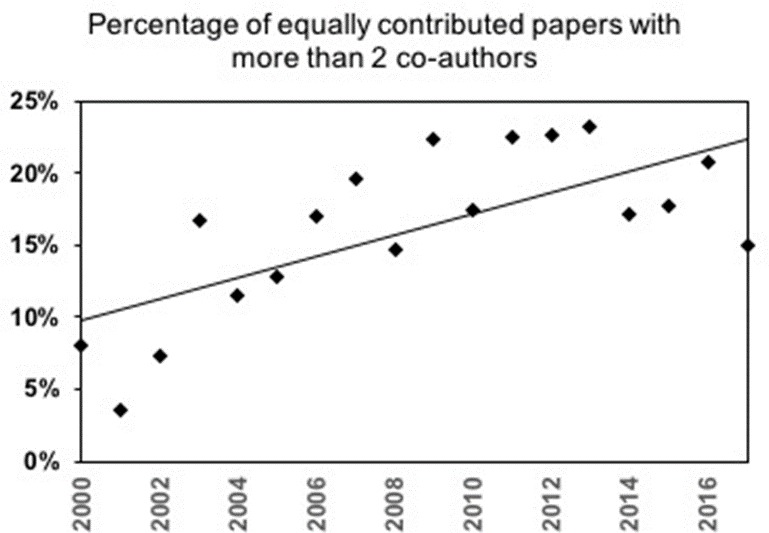
Figure 3. Percentage of papers with two or more authors contributing equally as a function of time.

Points denote the percentage of papers with where more than two authors claimed equal contribution. Trendline R2 value as 0.4857.

Points denote the percentage of papers with where more than two authors claimed equal contribution. Trendline R2 value as 0.4857.