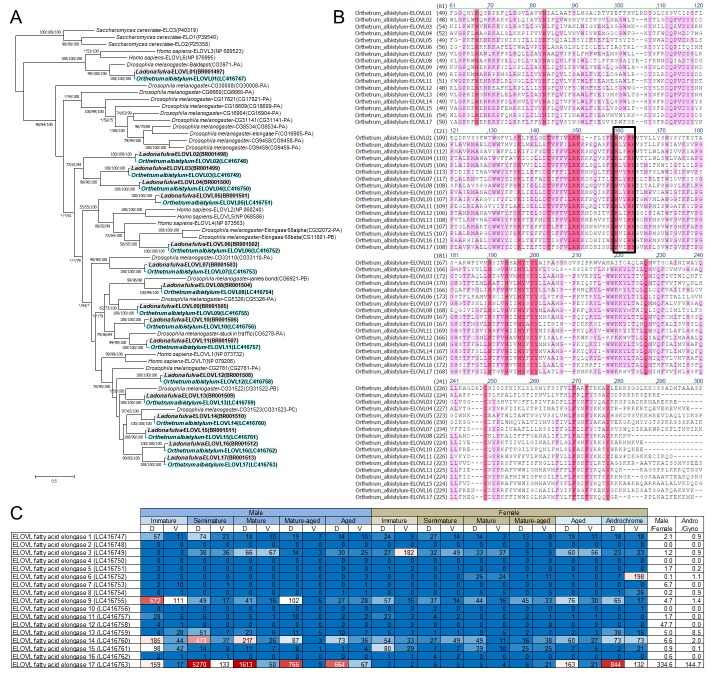
Figure 11. Identification of 17 ELOVL genes in dragonflies.
(A) Phylogenetic tree of ELOVL family genes produced on the basis of their amino-acid sequences. A maximum likelihood phylogeny is shown, but neighbor-joining and Bayesian phylogenies exhibit substantially the same topologies. Statistical supporting values are indicated for each node (shown as (bootstrap value of neighbor-joining)/(bootstrap value of maximum likelihood)/(posterior probability of Bayesian)). Asterisks indicate support values < 50%. Blue and gray shading indicates O. albistylum and L. fulva genes, respectively. Accession numbers or annotation identities are shown in parentheses. (B) Alignment of 17 ELOVL genes of O. albistylum. The conserved histidine motif is boxed. (C) Gene expression levels of 17 ELOVL genes in O. albistylum. The numbers indicate FPKM values. Red and blue shading indicates high and low expression levels, respectively. D and V indicate the dorsal and ventral abdominal regions, respectively.

