. 2019 Jan 15;8:e43045. doi: 10.7554/eLife.43045

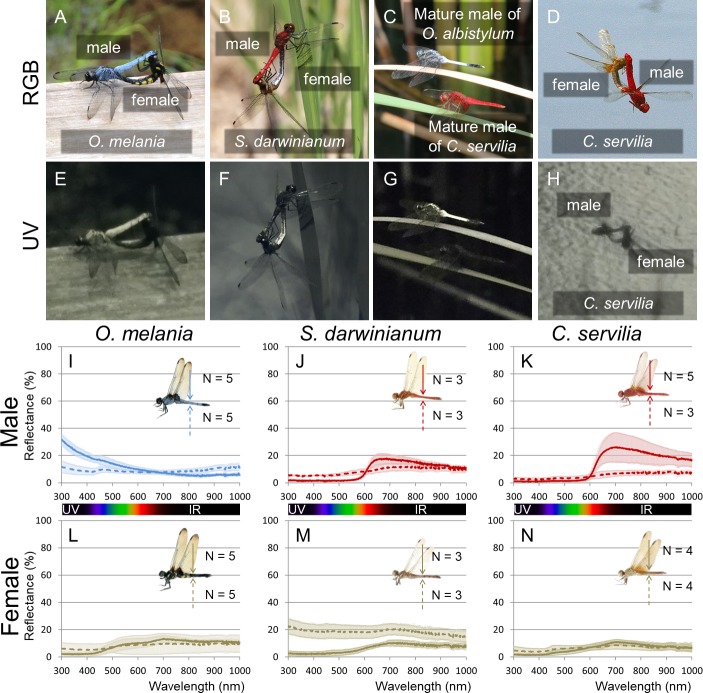
Figure 7. UV reflection patterns in O. melania, S. darwinianum and C. servilia.

(A, E) Mating pair of O. melania. (B, F) Mating pair of S. darwinianum. (C, G) Mature male of C. servilia with mature male of O. albistylum. (D, H) Mating pair of C. servilia. Each image photographed normally (RGB) (A–D) or through a UV filter (E–H) in the field. (I–N) Spectrometry of a round area (6 mm in diameter) on the 5th abdominal segment of O. melania (I, L), S. darwinianum (J, M), and C. servilia (K, N). (I–K) Male. (L–N) Female. Solid and dotted lines indicate averaged UV reflectance on the dorsal and ventral sides of the abdomen, respectively. The standard deviation is shaded.

Figure 7—source data 1. Spectrometry of a round area (6 mm in diameter) of O. melania.
elife-43045-fig7-data1.xlsx (364.1KB, xlsx)
DOI: 10.7554/eLife.43045.023
Figure 7—source data 2. Spectrometry of a round area (6 mm in diameter) of S. darwinianum.
elife-43045-fig7-data2.xlsx (468.4KB, xlsx)
DOI: 10.7554/eLife.43045.024
Figure 7—source data 3. Spectrometry of a round area (6 mm in diameter) of C. servilia.
elife-43045-fig7-data3.xlsx (301.4KB, xlsx)
DOI: 10.7554/eLife.43045.025
Figure 7—source data 4. Micro-spectrometry of O. melania.
elife-43045-fig7-data4.xlsx (305.5KB, xlsx)
DOI: 10.7554/eLife.43045.026
Figure 7—source data 5. Micro-spectrometry of S. darwinianum.
elife-43045-fig7-data5.xlsx (324.5KB, xlsx)
DOI: 10.7554/eLife.43045.027
Figure 7—source data 6. Micro-spectrometry of C. servilia.
elife-43045-fig7-data6.xlsx (281.9KB, xlsx)
DOI: 10.7554/eLife.43045.028

Figure 7.

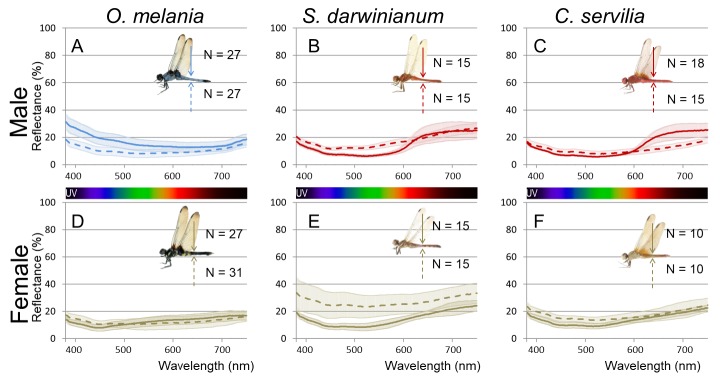
Figure 7—figure supplement 1. Micro-spectrometry (of a 10 × 10 µm micro-area) of O. melania (A, D), S. darwinianum (B, E), and C. servilia (C, F).

Figure 7—figure supplement 1.

(A–C) Male. (D–F) Female. Five to ten micro-areas were measured for each individual.