Abstract
Bicelles are used in many membrane protein studies because they are thought to be more bilayer-like than micelles. We investigated the properties of “isotropic” bicelles by small-angle neutron scattering, small-angle X-ray scattering, fluorescence anisotropy, and molecular dynamics. All data suggest that bicelles with a q value below 1 deviate from the classic bicelle that contains lipids in the core and detergent in the rim. Thus not all isotropic bicelles are bilayer-like.
Graphical Abstract
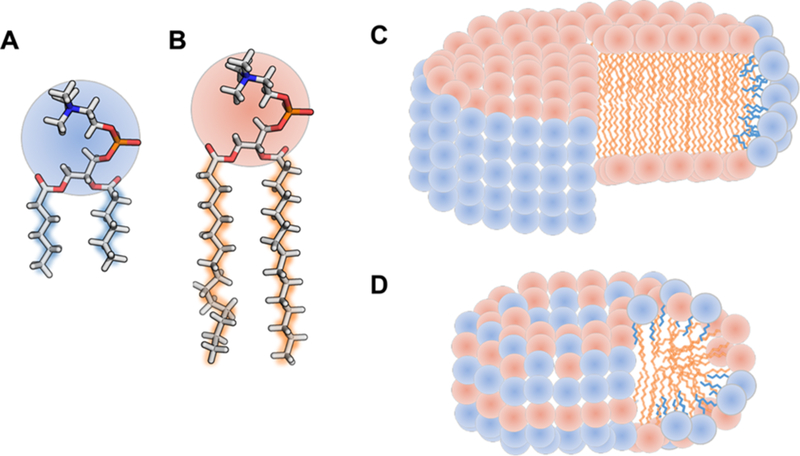
For nearly two decades, bicelles have had a wide variety of applications, most commonly as bilayer mimics for structural1−14 and functional15−20 investigations of membrane-associated proteins. A bicelle is a bilayer micelle, a disc-shape aggregate typically formed by a mixture of detergents (Figure 1A) and lipids (Figure 1B). Bicelle self-assembly was first determined in 1984,21,22 and since then, bicelles have been characterized using many methods such as small-angle neutron scattering (SANS)23,24 and nuclear magnetic resonance (NMR).25−31 The classically described (“ideal”) bicelle contains a central disk-shaped lipid bilayer encircled by a rim of detergents that screen the hydrophobic lipid tails from water (Figure 1C).32,33 Thus, in the “ideal” bicelle, the lipid and detergent molecules are segregated spatially. Bicelles vary in size and shape depending on the ratio of lipid to detergent (known as the q value),34 the structure of the lipid and detergent monomers,25 total concentration of amphiphiles,35,36 and temperature.29,30 For solution NMR structural studies, bicelles with low q values (<0.7; also known as fast-tumbling “isotropic” bicelles) have demonstrated some utility for polytopic integral membrane proteins.24,31,37,38 Several of these studies suggest that the stabilization of membrane protein fold is due to the more “bilayer” nature of bicelles compared with micelles. That is, the segregated lipid core in bicelles is more similar in structure to the native membrane.
Figure 1.
Structures of detergent (A), lipid (B), and cartoons of idealized bicelles (C) and mixed micelles (D).
However, recent studies of binary mixtures of detergents of different alkyl chain lengths and head groups indicated that these compositions are fully mixed (Figure 1D).39,40 This observation led to a hypothesis that bicelles with q values below 1, for which the detergent concentration is higher than the lipid concentration, may not have segregated lipid cores, as previously suggested.36 Here we investigate the structure and segregation of bicelles with q values < 1 formed by dihexanoylphosphatidylcholine (DHPC; Figure 1A) and dimyristoylphosphatidylcholine (DMPC; Figure 1B), which have been studied for almost 30 years.41−44 Several measurable structural and physical properties allow the mixing of lipids and detergents to be tested. As with mixed micelles, the characteristic headgroup−headgroup distance (L) is expected to vary with concentration in mixed bicelles and can be determined via small-angle X-ray scattering (SAXS), a model-free measurement.39,40 Because the two components of the bicelle have different scattering length densities, SANS can determine their degree of mixing. The gel-to-liquid phase transition temperature (Tm), measured using the fluorescence anisotropy of diphenylhexatriene (DPH), is an independent measurement of the extent of bilayer formation. Finally, the shape, size, and lipid-detergent mixing can be quantified directly using molecular dynamics (MD) simulations.
For an ideal bicelle with a fully segregated core, the average headgroup-to-headgroup distance (L) equals twice the length of DMPC tails plus a headgroup (one-half on each side) (~ 43 Å; Figure 1C), but if the detergent and lipid components mix, then the parameter L will be less and decrease linearly with the concentration of DHPC in the core.39,40 This structural feature can be determined with SAXS, SANS, and MD simulations.
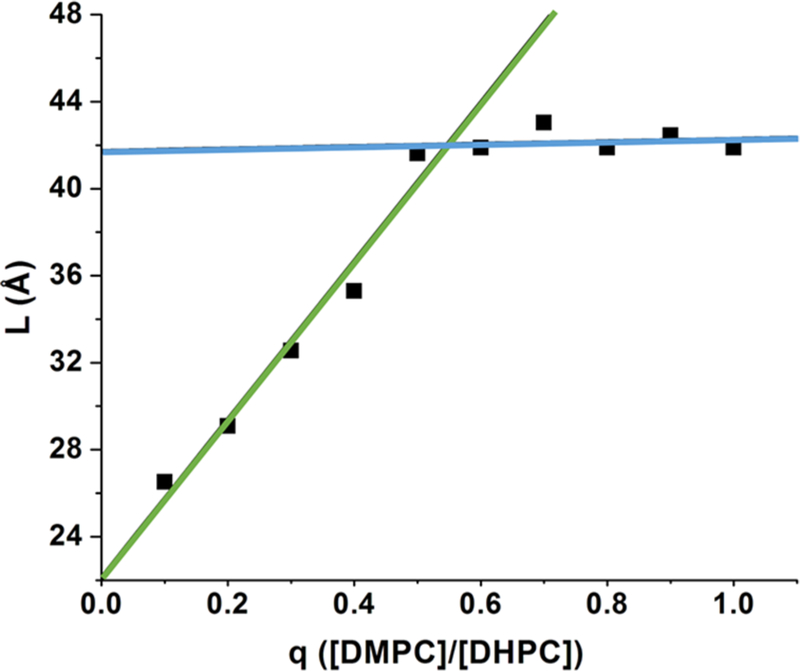
In the SAXS scattering profile, the second maximum (Qmax) corresponds to the distance between opposing electron rich head groups, L.45 Our data show that at q values from 0.5 to 1, the model-free dimension L remains constant at 42 Å (Figure 2 and Figure S1), suggesting a segregated bicelle (core). However, below q = 0.5, L varies linearly with q values (Figure 2), indicative of mixing of lipid and detergent in the core. A linear fit produces a y intercept of 22 Å, the approximate L of pure DHPC.40,46
Figure 2.
Bicelle dimensions vary with q values between 0 and 0.5. The L values are measured directly from the SAXS profiles (L; L = 2π/Qmax ≈ 2 (1.5 + 1.265nc) + t, where nc is the number of carbons in the alkyl chain and t is the headgroup thickness) for bicelles with varying q (6% (w/w) amphiphile). Linear fits to the data points for q ≤ 0.5 (green) and data points for q ≥ 0.5 (blue) are shown.
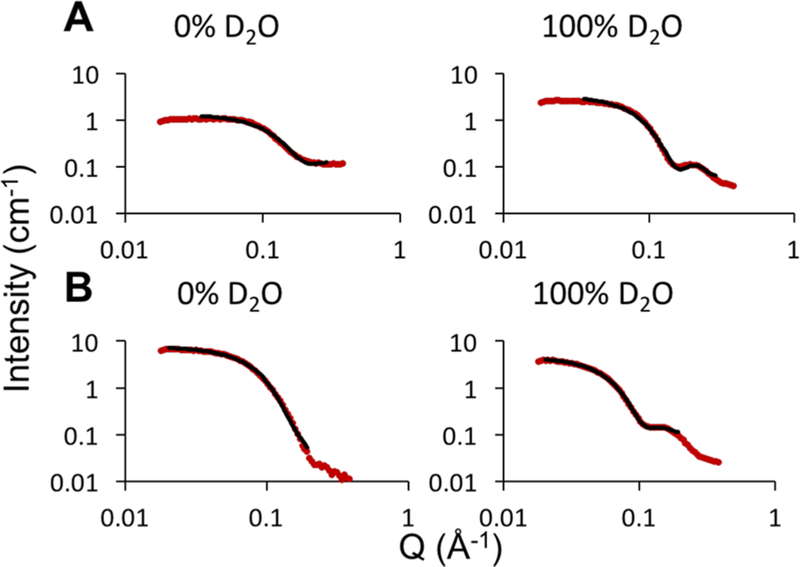
To further investigate the structure of bicelles, SANS experiments were conducted on bicelles with q values of 0.3 and 0.7 (see the SI for methods) with different solvent scattering length densities (varied percentages of D2O in H2O). Each scattering profile (Figure 3, Figures S2 and S3) was fit to the core−shell bicelle model (Figure S4). The obtained dimensions (Tables S1, S2, and S5) agree with the SAXS data (Table 1) and provide additional information about the shape. Higher detergent concentrations reduce the size and result in a more spherical shaped bicelle.
Figure 3.
Examples of model fits to SANS scattering profiles of bicelles with q = 0.3 (A) and q = 0.7 (B) (6% (w/w) amphiphile). The scattering profiles of bicelles with varying percentages of D2O (red) and the fits using the core−shell bicelle model (black; parameters listed in Tables S1, S2, and S5, all fits shown in Figures S3 and S4) are shown. Scattering profiles with D2O concentrations ±20% the match points were not included in the fits.
Table 1.
Comparison of Experimental and MD-Derived Radii and DHPC Concentration for q = 0.7 and 0.3 Bicellesa
| radius (Å) | DHPC | |||||
|---|---|---|---|---|---|---|
| q | 1 | 2 | expected (%)b | observed (%) | ratioc | |
| 0.7 | SAXS | - | 21 | 56 | - | - |
| SANS | 32 | 22 | 45/5ld | 0.8/0.9 | ||
| MD | 40 | 27 | 49 | 0.9 | ||
| 0.3 | SAXS | - | 16 | 76 | - | - |
| SANS | 22 | 17 | 60/87d | 0.8/1.1 | ||
| MD | 24 | 19 | 76 | 1 | ||
Dash indicates that the parameter is not determined. See the Supporting Information for calculations.
If fully mixed.
Ratio of expected to observed DHPC.
Average values for the core/rim are given.
We also investigated the bicelle properties using all-atom MD simulations (see the SI for details) for q < 1 bicelles. The simulation results support the SANS and SAXS analysis. At higher q, bicelles become less spherical compared to lower q, as evident from the principal radii of an ellipsoid fitted to the aggregate shape (Table 1, Table S6). This trend is observed in the SANS models; however, the average radii from the SANS models are slightly smaller than the MD models. Some discrepancies are expected due to the differences in the methods related to ensemble properties (multiple bicelles in experiments with a certain degree of polydispersity vs a single bicelle in the simulation box). However, the MD dimensions are within the ranges obtained from the SANS fits (Tables S1, S2, and S6). The small radius is comparable to half the SAXS-derived L dimension. (The SAXS value is smaller by half of a headgroup because L is the distance measured from the middle of each headgroup.) Furthermore, L values derived from the simulated SAXS data (from the MD obtained bicelle structures) are equal to the SAXS values for q = 0.7 (42 Å) but are somewhat larger than those for q = 0.3 bicelles (Figure 2, Table S6). Altogether, the difference in the radii between q = 0.3 and 0.7 bicelles is indicative of a structural change in isotropic bicelles above and below q ≈ 0.5. The linear changes in L observed in SAXS experiments and the overall geometry determined by all three methods suggest that the bicelles with q < 0.5 do not have fully segregated lipid cores. We therefore investigated bicelle detergent−lipid mixing.
The classical bicelle model predicts that the concentration of lipids and detergents in the core and rim will deviate from their bulk concentration. The bilayer forming lipid DMPC is expected to preferentially partition to the core, whereas the detergent DHPC preferentially partitions to the rim. We used SANS, MD, and fluorescence anisotropy to investigate the extent of mixing in bicelles with q values of 0.3 and 0.7.
In SANS experiments, bicelles formed by DHPC with protonated alkyl chains and DMPC with deuterated alkyl chains were used to distinguish a segregated versus a mixed bicelle.47 Deviations from the DHPC or DMPC alkyl-chain scattering length density (SLD; Table S3) in the “rim” and “core”, respectively, indicate lipid/detergent mixing because of the SLD contrast between DHPC and DMPC (Table S3; see the Supporting Information for calculations). To verify the SLD values and the effective q values of the bicelle, the theoretical match points and the experimental match points were compared and are in good agreement (Table S4). The SLD values from the core−shell bicelle fits to the SANS data (Tables S1 and S2 and Figures S2 and S3) indicate that the core composition is 38−77% DHPC and 23−62% DMPC in q = 0.3 bicelles and the core composition is 37−49% DHPC and 51−63% in q = 0.7 bicelles. Although a broad range of DHPC is observed for the q = 0.3 bicelles, fully mixed values (76%) are observed (Table 1).
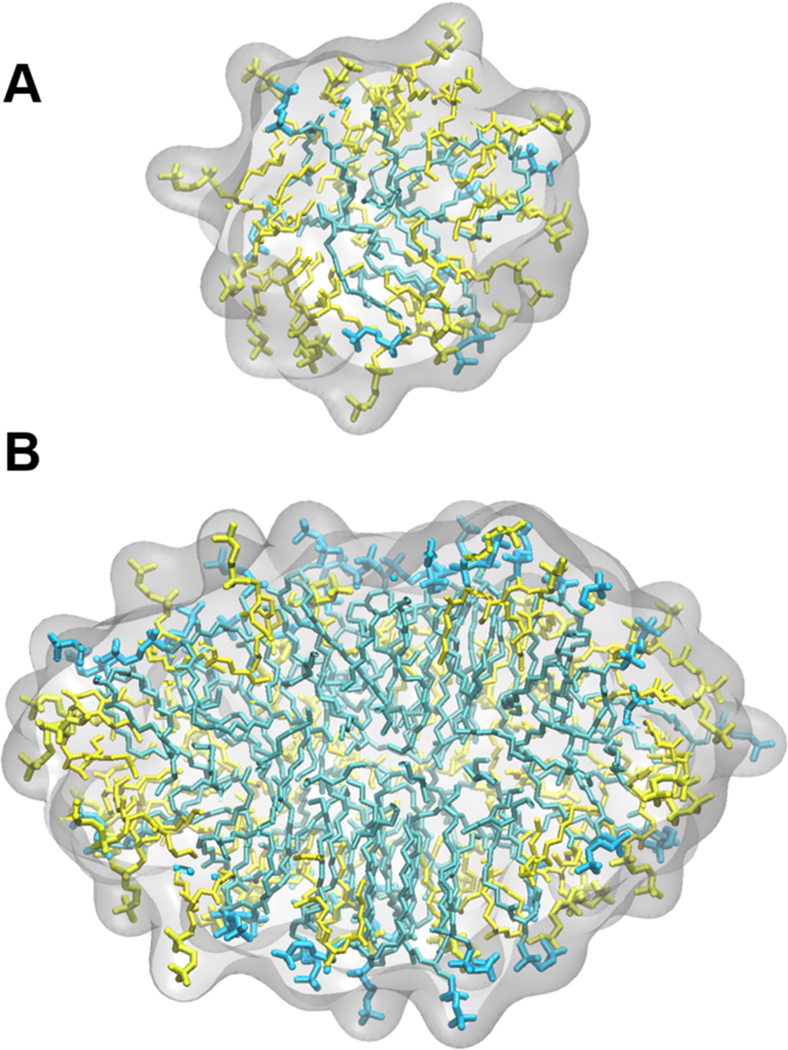
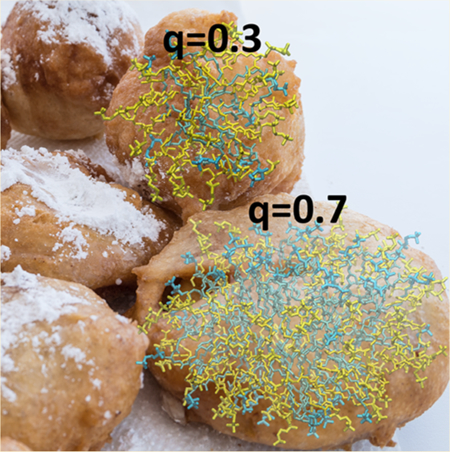
In MD simulations, the segregation of lipids and detergents can be quantified by comparing the local concentration of DHPC around DMPC (see the SI for details). There is on average 76% DHPC around DMPC in q = 0.3 bicelles and 49% in 0.7 bicelles. It is interesting to note that full segregation was not observed in either case, indicating a certain degree of mixing even in isotropic bicelles with q > 0.5. Thus mixed nearly spherical micelles were observed for q ≈ 0.3 and partially segregated ellipsoid bicelles were observed for q ≈ 0.7 (representative structures are shown in Figure 4; the observed characteristics of q = 0.3 bicelles are similar to previously reported simulations).36
Figure 4.
Snapshots from MD simulations of (A) q = 0.3 and (B) q = 0.7 bicelles (9% (w/w) amphiphile). DHPC and DMPC are rendered as sticks and colored yellow and blue, respectively.48 The surface is shown as transparent gray and a portion of the bicelle is removed to view the interior distribution of the DMPC and DHPC tails.
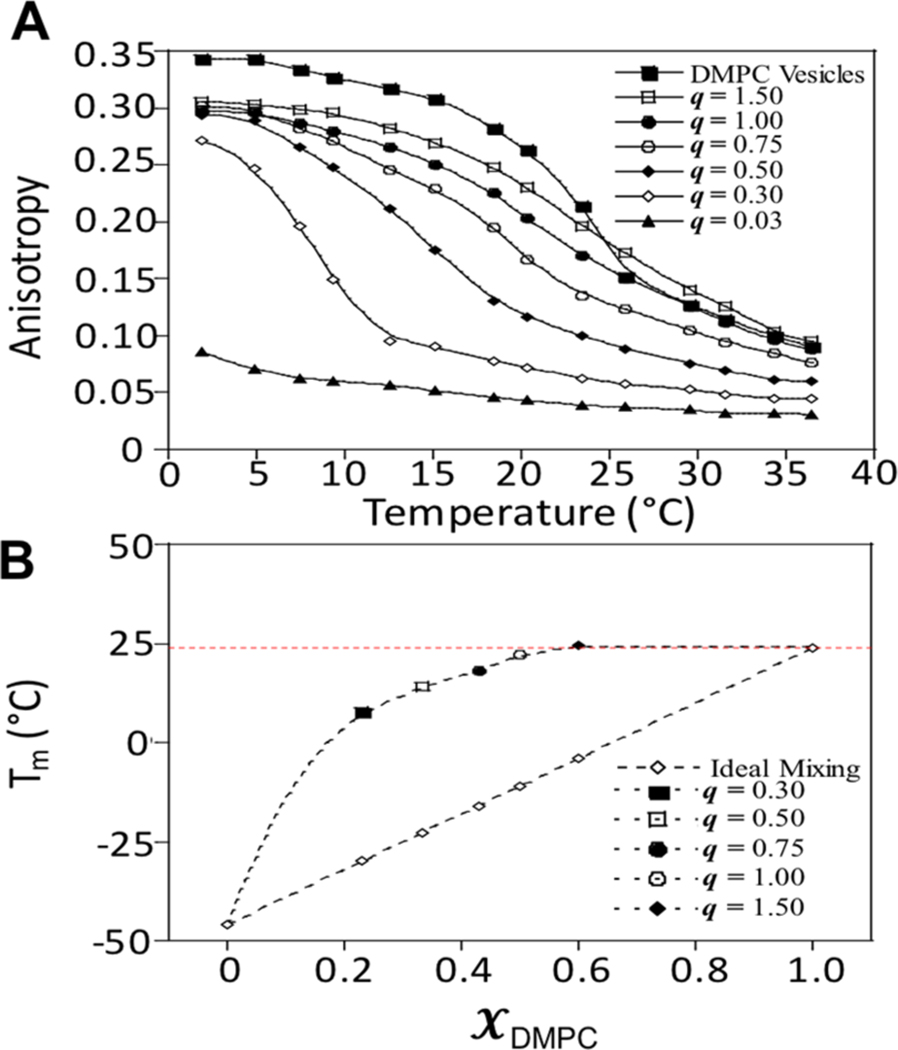
The fluorescence anisotropy of DPH detects changes in the fluidity of lipid bilayers as a function of temperature, from which the main phase-transition temperature (Tm) of a lipid bilayer can be determined.49−51 To benchmark this technique, the Tm of pure DMPC vesicles was measured to be 23.1 ± 0.4 °C, consistent with other methods (Figure 5A).36 The Tm of bicelles is expected to be identical to that of DMPC vesicles if DPH partitions into a region composed purely of DMPC. However, if significant mixing between DMPC and DHPC occurs, then a decrease in Tm compared with DMPC vesicles will be observed, as DHPC disrupts acyl chain packing between DMPC molecules.
Figure 5.
(A) Temperature dependence of the anisotropy value for DPH fluorescence reconstituted into bicelles with varying q values (2.3% (w/w) amphiphile). The inflection point of each melting curve was taken as the Tm. (B) Experimentally determined and calculated Tm values for bicellar solutions as a function of mole fraction of DMPC. The linear black dashed line represents Tm values for ideal mixing (Tm = χDHPC × Tm(DHPC) + χDMPC × Tm(DMPC)). The horizontal dotted line shows the Tm of pure DMPC bilayers (23.1 °C). Errors in each Tm measurement were approximately ±0.2 to 0.4 °C.
The analysis of the melting curves (Figure 5A) yielded the Tm for each q value. Comparison of the Tm values obtained from the anisotropy measurements to Tm values for ideally mixed DHPC/DMPC vesicles indicates significant differences at all q values <1.0, suggesting that these bicelles do not fit a fully mixed bicelle model (Figure 5B).36 These data agree with previously reported Tm values derived from FTIR spectroscopy of various q-value bicelles;36 however, they do not support recent NMR data indicating similar lipid/detergent mixing in low- and high-q bicelles.52 As the q value increased, the Tm asymptotically approached the melting temperature of a pure DMPC bilayer. Only for q ≥ 1.0, a Tm close to that of a pure DMPC bilayer is obtained (±1 °C) in agreement with FTIR measurements. (Figure 5B).36 This suggests a variation in the lipid/detergent mixing at q values below 1.0, in agreement with the geometrical changes determined with SAXS (Figure 2), and the geometrical and lipid-detergent mixing observed in MD and SANS studies (Table 1 and Figure 4).
We have shown using four independent methods, SAXS, SANS, MD, and fluorescence, that bicelle properties vary with the lipid-to-detergent ratio. The data suggest that at q values below 1, lipid and detergent molecules partially mix, and the bicelle structure deviates from the ideal bicelle model. With increasing q values, the lipid−detergent aggregates transition from a spherical mixed micelle through an ellipsoidal micelle to a disc-like bicelle.
These results suggest that care should be taken in interpreting membrane protein structural changes in micelles and bicelles. Isotropic bicelles with q values <0.5 likely present a micellar environment, and bicelles with q values <1 may not fully capture bilayer properties. A recent NMR study inferred similar bicelle differences based on protein positioning using PRE experiments.38 Changes in protein structure in a low-q micelle/bicelle may be related to the micelle shape, size, and fluidity, or specific interactions with the lipids rather than the claimed “more bilayer-like” feature. It is interesting to note that segregation of lipids in low-q bicelles may be protein-mediated if the lipid interactions are preformed.53,54
Supplementary Material
ACKNOWLEDGMENTS
This work was funded by the National Science Foundation (MCB 0845668, L.C.), by the National Institute of Health under Grant (2R01GM087828–06, L.C.), Grant (R01 GM093258–03, J.G.), and Training Grant (5T32GM080186–07 T.A.C.), the Research Corporation for Scientific Advancement (L.C.), the Natural Sciences and Engineering Research Council of Canada (D.P.T.), the Canada Research Chairs Program (D.P.T.), Alberta Innovates Technology Futures through the Strategic Chair in (Bio)Molecular Simulation (D.P.T.), and Compute Canada for computational resources for the simulations (S.B., DPT). Neutron scattering studies at the CG-3 Bio-SANS instrument at the High-Flux Isotope Reactor of Oak Ridge National Laboratory were sponsored by the Office of Biological and Environmental Research and by the Scientific User Facilities Division, Office of Basic Energy Sciences, U.S. Department of Energy. This work benefited from the use of the SasView application, originally developed under NSF award DMR-0520547. SasView contains code developed with funding from the European Union’s Horizon 2020 research and innovation programmer under the SINE2020 project, grant agreement no. 654000.
Footnotes
The authors declare no competing financial interest.
Supporting Information
The Supporting Information is available free of charge on the ACS Publications website at DOI: 10.1021/acs.jpclett.8b02079.
Experimental procedures and supporting figures and tables (PDF)
REFERENCES
- (1).Dürr UHN; Soong R; Ramamoorthy A When Detergent Meets Bilayer: Birth and Coming of Age of Lipid Bicelles. Prog. Nucl. Magn. Reson. Spectrosc 2013, 69, 1–22. [DOI] [PMC free article] [PubMed] [Google Scholar]
- (2).Marcotte I; Auger M l. Bicelles as Model Membranes for Solid- and Solution-State NMR Studies of Membrane Peptides and Proteins. Concepts Magn. Reson., Part A 2005, 24A, 17–37. [Google Scholar]
- (3).Warschawski DE; Arnold AA; Beaugrand M; Gravel A; Chartrand É; Marcotte I Choosing Membrane Mimetics for NMR Structural Studies of Transmembrane Proteins. Biochim. Biophys. Acta, Biomembr 2011, 1808, 1957–1974. [DOI] [PubMed] [Google Scholar]
- (4).Faham S; Ujwal R; Abramson J; Bowie JU Chapter 5 Practical Aspects of Membrane Proteins Crystallization in Bicelles. Curr. Top. Membr 2009, 63, 109–125. [Google Scholar]
- (5).Seddon AM; Curnow P; Booth PJ Membrane Proteins, Lipids and Detergents: Not Just a Soap Opera. Biochim. Biophys. Acta, Biomembr 2004, 1666, 105–117. [DOI] [PubMed] [Google Scholar]
- (6).Poulos S; Morgan JL; Zimmer J; Faham S Bicelles Coming of Age: An Empirical Approach to Bicelle Crystallization. Methods Enzymol 2015, 557, 393–416. [DOI] [PubMed] [Google Scholar]
- (7).Deshmukh MV; John M; Coles M; Peters J; Baumeister W; Kessler H Inter-Domain Orientation and Motions in Vat-N Explored by Residual Dipolar Couplings and 15N Backbone Relaxation. Magn. Reson. Chem 2006, 44, S89–S100. [DOI] [PubMed] [Google Scholar]
- (8).Gruss F; Hiller S; Maier T Purification and Bicelle Crystallization for Structure Determination of the E. Coli Outer Membrane Protein Tama. Methods Mol. Biol 2015, 1329, 259–270. [DOI] [PubMed] [Google Scholar]
- (9).Ujwal R; Abramson J High-Throughput Crystallization of Membrane Proteins Using the Lipidic Bicelle Method. J. Visualized Exp 2012, e3383. [DOI] [PMC free article] [PubMed] [Google Scholar]
- (10).Faham S; Boulting GL; Massey EA; Yohannan S; Yang D; Bowie JU Crystallization of Bacteriorhodopsin from Bicelle Formulations at Room Temperature. Protein Sci 2005, 14, 836–840. [DOI] [PMC free article] [PubMed] [Google Scholar]
- (11).Faham S; Bowie JU Bicelle Crystallization: A New Method for Crystallizing Membrane Proteins Yields a Monomeric Bacteriorhodopsin Structure. J. Mol. Biol 2002, 316, 1–6. [DOI] [PubMed] [Google Scholar]
- (12).McCaffrey JE; James ZM; Thomas DD Optimization of Bicelle Lipid Composition and Temperature for Epr Spectroscopy of Aligned Membranes. J. Magn. Reson 2015, 250, 71–75. [DOI] [PMC free article] [PubMed] [Google Scholar]
- (13).Duc NM; Du Y; Thorsen TS; Lee SY; Zhang C; Kato H; Kobilka BK; Chung KY Effective Application of Bicelles for Conformational Analysis of G Protein-Coupled Receptors by Hydrogen/Deuterium Exchange Mass Spectrometry. J. Am. Soc. Mass Spectrom 2015, 26, 808–817. [DOI] [PMC free article] [PubMed] [Google Scholar]
- (14).Yamamoto K; Pearcy P; Lee DK; Yu C; Im SC; Waskell L; Ramamoorthy A Temperature-Resistant Bicelles for Structural Studies by Solid-State NMR Spectroscopy. Langmuir 2015, 31, 1496–1504. [DOI] [PubMed] [Google Scholar]
- (15).Kaya AI; Iverson TM; Hamm HE Functional Stability of Rhodopsin in a Bicelle System: Evaluating G Protein Activation by Rhodopsin in Bicelles. Methods Mol. Biol 2015, 1271, 67–76. [DOI] [PubMed] [Google Scholar]
- (16).Mercredi PY; Bucca N; Loeliger B; Gaines CR; Mehta M; Bhargava P; Tedbury PR; Charlier L; Floquet N; Muriaux D Structural and Molecular Determinants of Membrane Binding by the Hiv-1 Matrix Protein. J. Mol. Biol 2016, 428, 1637–1655. [DOI] [PMC free article] [PubMed] [Google Scholar]
- (17).Musatov A; Siposova K; Kubovcikova M; Lysakova V; Varhac R Functional and Structural Evaluation of Bovine Heart Cytochrome C Oxidase Incorporated into Bicelles. Biochimie 2016, 121, 21–28. [DOI] [PMC free article] [PubMed] [Google Scholar]
- (18).Tian H; Naganathan S; Kazmi MA; Schwartz TW; Sakmar TP; Huber T Bioorthogonal Fluorescent Labeling of Functional G-Protein-Coupled Receptors. ChemBioChem 2014, 15, 1820–1829. [DOI] [PMC free article] [PubMed] [Google Scholar]
- (19).Whiles JA; Deems R; Vold RR; Dennis EA Bicelles in Structure-Function Studies of Membrane-Associated Proteins. Bioorg. Chem 2002, 30, 431–442. [DOI] [PubMed] [Google Scholar]
- (20).Luhrs T; Zahn R; Wuthrich K Amyloid Formation by Recombinant Full-Length Prion Proteins in Phospholipid Bicelle Solutions. J. Mol. Biol 2006, 357, 833–841. [DOI] [PubMed] [Google Scholar]
- (21).Gabriel NE; Roberts MF Spontaneous Formation of Stable Unilamellar Vesicles. Biochemistry 1984, 23, 4011–4015. [DOI] [PubMed] [Google Scholar]
- (22).Gabriel NE; Roberts MF Interaction of Short-Chain Lecithin with Long-Chain Phospholipids: Characterization of Vesicles That Form Spontaneously. Biochemistry 1986, 25, 2812–2821. [DOI] [PubMed] [Google Scholar]
- (23).Lin TL; Liu CC; Roberts MF; Chen SH Structure of Mixed Short-Chain Lecithin Long-Chain Lecithin Aggregates Studied by Small-Angle Neutron-Scattering. J. Phys. Chem 1991, 95, 6020–6027. [Google Scholar]
- (24).Luchette PA; Vetman TN; Prosser RS; Hancock REW; Nieh M-P; Glinka CJ; Krueger S; Katsaras J Morphology of Fast-Tumbling Bicelles: A Small Angle Neutron Scattering and NMR Study. Biochim. Biophys. Acta, Biomembr 2001, 1513, 83–94. [DOI] [PubMed] [Google Scholar]
- (25).Mineev KS; Nadezhdin KD; Goncharuk SA; Arseniev AS Characterization of Small Isotropic Bicelles with Various Compositions. Langmuir 2016, 32, 6624–6637. [DOI] [PubMed] [Google Scholar]
- (26).Ram P; Prestegard JH Magnetic Field Induced Ordering of Bile Salt/Phospholipid Micelles: New Media for NMR Structural Investigations. Biochim. Biophys. Acta, Biomembr 1988, 940, 289–294. [DOI] [PubMed] [Google Scholar]
- (27).Sanders CR 2nd; Prestegard JH Magnetically Orientable Phospholipid Bilayers Containing Small Amounts of a Bile Salt Analogue Chapso. Biophys. J 1990, 58, 447–460. [DOI] [PMC free article] [PubMed] [Google Scholar]
- (28).Sanders CR 2nd; Schwonek JP Characterization of Magnetically Orientable Bilayers in Mixtures of Dihexanoylphosphatidylcholine and Dimyristoylphosphatidylcholine by Solid-State NMR. Biochemistry 1992, 31, 8898–8905. [DOI] [PubMed] [Google Scholar]
- (29).Shintani M; Matubayasi N Morphology Study of Dmpc/Dhpc Mixtures by Solution-State H-1, P-31 NMR, and NOE Measurements. J. Mol. Liq 2016, 217, 62–69. [Google Scholar]
- (30).Triba MN; Warschawski DE; Devaux PF Reinvestigation by Phosphorus NMR of Lipid Distribution in Bicelles. Biophys. J 2005, 88, 1887–1901. [DOI] [PMC free article] [PubMed] [Google Scholar]
- (31).Vold RR; Prosser RS; Deese AJ Isotropic Solutions of Phospholipid Bicelles: A New Membrane Mimetic for High-Resolution NMR Studies of Polypeptides. J. Biomol. NMR 1997, 9, 329–335. [DOI] [PubMed] [Google Scholar]
- (32).Sanders CR; Prestegard JH Magnetically Orientable Phospholipid Bilayers Containing Small Amounts of a Bile Salt Analogue, Chapso. Biophys. J 1990, 58, 447–460. [DOI] [PMC free article] [PubMed] [Google Scholar]
- (33).Sanders CR; Schwonek JP Characterization of Magnetically Orientable Bilayers in Mixtures of Dihexanoylphosphatidylcholine and Dimyristoylphosphatidylcholine by Solid-State NMR. Biochemistry 1992, 31, 8898–8905. [DOI] [PubMed] [Google Scholar]
- (34).Vold RR; Prosser RS Magnetically Oriented Phospholipid Bilayered Micelles for Structural Studies of Polypeptides. Does the Ideal Bicelle Exist? J. Magn. Reson., Ser. B 1996, 113, 267–271. [Google Scholar]
- (35).Glover KJ; Whiles JA; Wu G; Yu N; Deems R; Struppe JO; Stark RE; Komives EA; Vold RR Structural Evaluation of Phospholipid Bicelles for Solution-State Studies of Membrane-Associated Biomolecules. Biophys. J 2001, 81, 2163–2171. [DOI] [PMC free article] [PubMed] [Google Scholar]
- (36).Beaugrand M; Arnold AA; Henin J; Warschawski DE; Williamson PT; Marcotte I Lipid Concentration and Molar Ratio Boundaries for the Use of Isotropic Bicelles. Langmuir 2014, 30, 6162–6170. [DOI] [PMC free article] [PubMed] [Google Scholar]
- (37).Sanders CR; Landis GC Facile Acquisition and Assignment of Oriented Sample NMR Spectra for Bilayer Surface-Associated Proteins. J. Am. Chem. Soc 1994, 116, 6470–6471. [Google Scholar]
- (38).Piai A; Fu Q; Dev J; Chou JJ Optimal Bicelle Size Q for Solution NMR Studies of the Protein Transmembrane Partition. Chem. - Eur. J 2017, 23, 1361–1367. [DOI] [PMC free article] [PubMed] [Google Scholar]
- (39).Oliver RC; Lipfert J; Fox DA; Lo RH; Kim JJ; Doniach S; Columbus L Tuning Micelle Dimensions and Properties with Binary Surfactant Mixtures. Langmuir 2014, 30, 13353–13361. [DOI] [PubMed] [Google Scholar]
- (40).Columbus L; Lipfert J; Jambunathan K; Fox DA; Sim AY; Doniach S; Lesley SA Mixing and Matching Detergents for Membrane Protein NMR Structure Determination. J. Am. Chem. Soc 2009, 131, 7320–7326. [DOI] [PMC free article] [PubMed] [Google Scholar]
- (41).Sanders CR; Prosser RS Bicelles: A Model Membrane System for All Seasons? Structure 1998, 6, 1227–1234. [DOI] [PubMed] [Google Scholar]
- (42).Diller A; Loudet C; Aussenac F; Raffard G; Fournier S; Laguerre M; Grelard A; Opella SJ; Marassi FM; Dufourc EJ Bicelles: A Natural ‘Molecular Goniometer’ for Structural, Dynamical and Topological Studies of Molecules in Membranes. Biochimie 2009, 91, 744–751. [DOI] [PMC free article] [PubMed] [Google Scholar]
- (43).Sanders CR; Hare BJ; Howard KP; Prestegard JH Magnetically-Oriented Phospholipid Micelles as a Tool for the Study of Membrane-Associated Molecules. Prog. Nucl. Magn. Reson. Spectrosc 1994, 26, 421–444. [Google Scholar]
- (44).Ram P; Prestegard JH Magnetic-Field Induced Ordering of Bile-Salt Phospholipid Micelles - New Media for NMR Structural Investigations. Biochim. Biophys. Acta, Biomembr 1988, 940, 289–294. [DOI] [PubMed] [Google Scholar]
- (45).Lipfert J; Columbus L; Chu VB; Lesley SA; Doniach S Size and Shape of Detergent Micelles Determined by Small-Angle X-Ray Scattering. J. Phys. Chem. B 2007, 111, 12427–12438. [DOI] [PubMed] [Google Scholar]
- (46).Lipfert J; Columbus L; Chu VB; Lesley SA; Doniach S Size and Shape of Detergent Micelles Determined by Small-Angle X-Ray Scattering. J. Phys. Chem. B 2007, 111, 12427–12438. [DOI] [PubMed] [Google Scholar]
- (47).SasView http://www.sasview.org/ (accessed May 25, 2018).
- (48).Humphrey W; Dalke A; Schulten K Vmd: Visual Molecular Dynamics. J. Mol. Graphics 1996, 14, 33–38. [DOI] [PubMed] [Google Scholar]
- (49).Macdonald AG; Wahle KW; Cossins AR; Behan ML Temperature, Pressure and Cholesterol Effects on Bilayer Fluidity; a Comparison of Pyrene Excimer/Monomer Ratios with the Steady-State Fluorescence Polarization of Diphenylhexatriene in Liposomes and Microsomes. Biochim. Biophys. Acta, Biomembr 1988, 938, 231–242. [DOI] [PubMed] [Google Scholar]
- (50).Nelson SCN; Neeley SK; Melonakos ED; Bell JD; Busath DD Fluorescence Anisotropy of Diphenylhexatriene and Its Cationic Tri-Methylamino Derivative in Liquid Dipalmitoylphosphatidylcholine Liposomes: Opposing Responses to Isoflurane. BMC Biophys 2012, 5, 5. [DOI] [PMC free article] [PubMed] [Google Scholar]
- (51).Shinitzky M; Barenholz Y Fluidity Parameters of Lipid Regions Determined by Fluorescence Polarization. Biochim. Biophys. Acta, Rev. Biomembr 1978, 515, 367–394. [DOI] [PubMed] [Google Scholar]
- (52).Kot EF; Goncharuk SA; Arseniev AS; Mineev KS Phase Transitions in Small Isotropic Bicelles. Langmuir 2018, 34, 3426–3437. [DOI] [PubMed] [Google Scholar]
- (53).Morrison EA; Henzler-Wildman KA Reconstitution of Integral Membrane Proteins into Isotropic Bicelles with Improved Sample Stability and Expanded Lipid Composition Profile. Biochim. Biophys. Acta, Biomembr 2012, 1818, 814–820. [DOI] [PMC free article] [PubMed] [Google Scholar]
- (54).Laguerre A; Lohr F; Henrich E; Hoffmann B; Abdul-Manan N; Connolly PJ; Perozo E; Moore JM; Bernhard F; Dotsch V From Nanodiscs to Isotropic Bicelles: A Procedure for Solution Nuclear Magnetic Resonance Studies of Detergent-Sensitive Integral Membrane Proteins. Structure 2016, 24, 1830–1841. [DOI] [PMC free article] [PubMed] [Google Scholar]
Associated Data
This section collects any data citations, data availability statements, or supplementary materials included in this article.


