

Abstract
Probiotics are the healthy living bacteria when administered in adequate amounts confers health benefits in the host. The main objective of present study was to screen the bacteria for potential probiotic characters and enzyme production. The probiotic characters like tolerance to low pH, bile salts, antibiotic sensitivity, hydrophobicity and auto-aggregation properties were evaluated. Among all isolates Lactobacillus fermentum and Lactobacillus sp G3_4_1TO2 showed maximum potential probiotic characters and produced amylase enzyme by observing the halo zone around the colonies with the diameter 0.9 mm and 1.23 mm. Lactobacillus sp G3_4_1TO2 produced maximum amylase when compared with Lb. fermentum. The protein yield was 55.4% with the specific activity of 88.9 U/mg and obtained 40.8% purification fold. The molecular weight of amylase enzyme determined by SDS PAGE was 95,000 Da. From the present study it was considered that Lactobacillus sp G3_4_1TO2 was a potential probiotic bacteria producing maximum amylase enzyme.
Keywords: Amylase, Bile salt tolerance, Hydrophobicity, Lb. fermentum, Low pH tolerance, Lactobacillus sp G3_4_1TO2
1. Introduction
Probiotics are defined as the living bacteria that administered in adequate amounts which confers health benefits in the host. A probiotic bacteria should tolerate and survive harsh conditions of the host intestinal tract. It should arrive at the action of site in a viable physiological state and it should protect from pathogens by producing some antimicrobial substances like bacteriocins or by metabolites like organic acids. Lactic acid bacteria are the most prominent probiotic bacteria which exert beneficial effects in the host gastro intestinal tract (GI) [3]. The probiotic Lactobacillus sp includes Lb. acidophilus, Lb. plantarum, Lb. rhamnosus, Lb. paracasei, Lb. casei, Lb. gasseri. More than 50% of lactic acid bacteria are used in food industry in preparation of bakery products. Lactic acid bacteria are utilized in pharma, chemical industry and chemical feed. In cosmetic industry the lactic acid bacteria is used as pH regulator, antimicrobial agent, and skin hydration and lightening [2], [30]. Enzymes such as proteases, peptidases, polysaccharide degrading enzymes, ureases, lipases, amylases, esterases and phenoloxidases are produced by lactic acid bacteria.
Amylases are the enzymes (E.C.3.2.1.1) catalyse the initial hydrolysis of starch into short oligosaccharides through the cleavage of α-D 1, 4 glycosidic bonds [29]. Starch hydrolyzed with amylase overcomes the acidic nature and helps in maintaining high temperature and there by producing fructose syrup. Various sources like plants, animals, bacteria, fungi and yeast secrete amylases as an extracellular enzyme. Present day the commercially available amylases are obtained from microbial sources. The advantage of using microbial amylases in industrial application is that they are more stable than any other source and easy to manipulate to obtain enzyme of desirable characteristics in bulk production and economical [32].
Some lactic acid bacteria produce amylase enzyme. Amylase producing Lactobacillus plays an important role in gastro intestinal tract of chicken and mammals like pig, horse, rabbit and human beings including infants [3]. Now a days amylases are of more interest due to its potential commercial applications like starch liquefaction, brewing, sizing of textile industries, paper and detergent industries. However the application of amylase is expanded to medical, clinical fields and analytical chemistry which is involved in formulation of lotions, ointments, production of biopolymers such as surgical sutures and controlled drug delivery systems [27]. Lactobacillus amylovorus, Lactobacillus plantarum, Lactobacillus manihotivorans, and Lactobacillus fermentum are some of the lactic acid bacteria exhibiting amylolytic activity [19], [23], [13]. The use of amylases produced from Lactobacillus is considered as safe because they are non-pathogenic and the end product of fermentation is lactate which is used as flavoring agent in the food industry [26]. Recently Tevea et al. [34] studied highly thermostable α-amylase enzyme from Lactobacillus fermentum 04BBA19 which was isolated from soil. Fossi et al. [10] studied on microbial interactions for enhancing the production of amylase by using Bacillus amyloliquefaciens 04BBA15, Lactobacillus fermentum 04BBA19 and S. cerevisiae.
In industrial sector starch is an economical raw material as a carbon source. The combination of starch and amylo-lactic acid bacteria enhances the fermentation process and produce lactic acid in single step which reduces the cost of overall fermentation process. The main aim of the present study was isolating and screening of potential probiotic lactic acid bacteria and to detect the ability of amylase production for the industrial application in bioprocessing and fermented foods, hence these lactic acid bacteria are generally regarded as safe (GRAS).
2. Materials and methods
2.1. Isolation and identification of lactic acid bacteria
Lactic acid bacteria (LAB) was isolated from different samples like milk, curd and bovine colostrum by serially diluting and plated on MRS media (de Man Rogosa and Sharpe) and incubated at 37 °C for 48 h. The isolated colonies were purified and cultured for morphological and biochemical identification by bergey’s Manual of Determinative Bacteriology [14], [7]. Two predominant colonies were identified by 16s rRNA sequencing method by extracting genomic DNA from bacteria using genomic DNA isolation kit. Approximately 1.5 kb 16s rDNA fragment was amplified using high –fidelity PCR polymerase in the thermal cycler AB12720. The PCR products were sequenced bi-directionally by using forward and reverse primer sequence 16s forward Primer: 5′-AGGTTGTCTGCTCA-3′ 16s reverse Primer: 5′-TCGGTCCTTGTCGACT. The composition of PCR mixture was: DNA: (1 μl) 16s Forward Primer (400 ng) 16s Reverse Primer (400 ng), dNTPs (2.5 mM each), 10X Taq DNA Polymerase (4 μl), Assay Buffer (10 μl) Taq DNA Polymerase Enzyme (3 U/μl) 1 μl Water X μl. Phylogenetic tree was created with alphabet size 4 and length size 1000 using Weighbor. The sequence similarity was confirmed by Basic Local Alignment Search Tool in the sequence database [36].
2.2. Screening of LAB for potential probiotic characters
2.2.1. Acid and bile salt tolerance
24 h old bacterial isolates were adjusted to 0.2 optical density (OD) and inoculated into tested MRS broth adjusted to different pH 2, 3, 4, 5, 6, 7, 8, 9 & 10 and 0.2, 0.4, 0.6, 0.8, 1, 2 & 3% of bile salts and incubated at 37 °C for 24 h and OD was measured at 600 nm. Cultures grown on MRS broth without bile salts and pH served as controls [33].
2.2.2. Effect of pancreatin and phenol
According to Khagwal et al. [16] 100 µl of 24 h old bacterial culture was inoculated into MRS broth containing 0.5% of pancreatin and incubated at 37 °C for 24 h and OD was measured at 600 nm. Phenol tolerance was determined by inoculating 100 µl of 24 h old culture into MRS broth containing 0.2% and 0.5% of phenol and OD was measured at 600 nm after 24 h of incubation [25].
2.2.3. Hydrophobicity and auto-aggregation property
According to Todorov et al. [33], 24 h old bacterial culture was centrifuged at 6000 rpm for 15 min and the pellet was washed with sterile saline solution (pH 6) and re-suspended into same solution and OD was measured at 580 nm. 1.5 ml of suspension was mixed with n-hexadecane in 1:1 ratio and vortexed for 2 min. Two phases separated after 30 min of incubation and OD was measured at 580 nm. The percentage of hydrophobicity was measured as
where OD0 and OD30 refer to the initial OD and OD measured after 30 min, respectively.
In order to study the auto-aggregation property, the bacterial cells were harvested (6000 rpm, 10 min) and the pellet was washed and suspended in the sterile saline solution and diluted to 0.3 OD600. 1 ml of the suspension was taken and OD was recorded over 60 min at 600 nm. After 60 min the suspension was centrifuged at 300g, 2 min and OD of supernatant was determined at 600 nm. Percentage of auto-aggregation was calculated by
where OD0 and OD60 refer to the initial OD and OD measured after 60 min, respectively.
2.2.4. Antibiotic sensitivity test
The antibiotic sensitivity was determined by inoculating the 1% of (v/v) of inoculum into MRS plates containing different antibiotics (penicillin, gentamycin, chloramphenicol, tetracycline, ampicillin and erythromycin) of the following concentrations 128, 256, 512 & 1024 µg/ml [1].
2.2.5. Haemolytic activity
The haemolytic activity was determined by inoculating the culture on blood agar plates and haemolysis zones were observed [15].
2.3. Enzymatic activity
To detect amylase, protease and lipase activity the culture was inoculated into appropriate media and observed the zone of clearance. For amylase activity the bacterial strains were inoculated into modified MRS media (0.5% peptone, 0.7% yeast extract, 0.2% NaCl, 2% starch, and 1.5% agar) supplemented with 0.25% of starch. After incubation the zone of clearance was observed by adding Gram’s iodine as detecting agent [17].
For detection of protease activity 50 µl of cell free extract was inoculated into skim milk (1%) agar medium and incubated for 48 h. After incubation the zone of clearance was observed and measured [35].
Lipase activity was determined by using olive oil (1%). 50 µl of cell free supernatant was inoculated in MRS broth containing olive oil (1%) and Arabic gum (1%). After 48 h of incubation and observed the zone [18].
2.4. Enzyme purification and assay
The culture supernatant was supplemented with solid ammonium sulphate to 65% (w/v) final concentration, with mechanical stirring at 4 °C. The suspension was retained for 1 h at 4 °C, and centrifuged at 8000 rpm for 30 min at the same temperature. The resultant supernatant was brought to 70% w/v ammonium sulphate saturation at 4 °C. 50–70% (w/v) ammonium sulphate precipitate was recovered, dissolved in 0.1 M phosphate buffer and dialyzed with Spectra/PorR, VWR 2003 dialysis membrane overnight against the same buffer at 4 °C added [11].
To determine the homogeneity and molecular weight, the enzyme preparation was subjected to PAGE-SDS electrophoresis using homogenized 10% (w/v) acrylamide gel. After electrophoresis, the gel was stained for 4 h with 0.25% (w/v) comase blue R250 dye in methanol acetic acid-water solution (50/5/45, by volume), and destained in the methanol acetic-water solution (80/10/10, by volume) without dye. The SDS was then removed by washing the gel successively with distilled water and with 50 mM phosphate buffer (pH 6.0). After washing, the gel was incubated at room temperature in 50 mM phosphate buffer solution pH 6.0 for 24 h, followed by a second incubation at room temperature in 0.5% (w/v) soluble starch solution for 24 h. The amylase activity was revealed by staining in 4% (v/v) diluted iodine solution (I2 1 g/L; KI, 30 g/L).
0.5 ml of purified enzyme preparation was subjected to react with a specific substrate (2 ml of 1 g/L of p-nitrophenyle maltoheptaoside). This substrate known to be hydrolysed only by α-amylase [31] a positive reaction, was characterized by the appearance of yellow compound with maximum absorption at 530 nm. To determine the specific activity and purification fold, protein was estimated following Bradford method [4] with pure casein as the standard.
3. Results and discussion
3.1 Isolation of lactic acid bacteria
From the samples sixteen predominant colonies were isolated. Morphologically the colonies were circle or oval, slightly raised, smooth with entire margin, creamy, slightly translucent. Microscopically the strains were identified as gram positive, rods shaped (Fig. 1). Biochemically strains showed catalase, oxidase, indole, MR-VP negative and positive for glucose, sucrose, fructose, maltose, lactose and dextrose fermentation. Predominant colony was identified by 16s rRNA sequencing method. The culture was 99% similar to Lactobacillus fermentum S2S4L1 (Fig. 2). Lb. fermentum was procured from microbiology lab, Jain University.
Fig. 1.
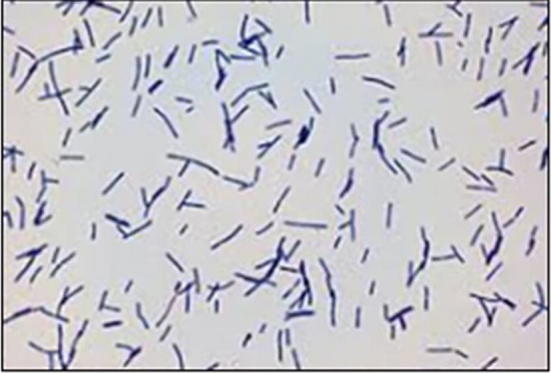
Microscopic view of showed gram positive rod shaped Lactobacillus.
Fig. 2.

Phylogenetic tree of Lactobacillus sp. G3_4_1TO2.
3.2. Screening for potential probiotic characters
To consider a bacteria to be a potential probiotic it should possess several desirable characters, like to overcome the low pH environment in the gastrointestinal tract and has to arrive at the site of action in a viable physiological state. In this study two tested strains exhibited low pH resistance. At pH 4 and 5 maximum growth of the strains was observed. Among all the strains Lactobacillus sp. G3_4_1TO2 and Lactobacillus fermentum exhibited maximum tolerance (Fig. 3). At pH 2 no growth and sparse growth was observed at pH 3. At pH 10 all strains exhibited reduced growth. Similar results were reported by Todorov et al. [33], that maximum growth of Lactobacillus plantarum ST16Pa isolated from papaya was observed at pH 4 & 5. Lb. plantarum, Lb. rhamnosus, Lb. pentosus, Lb. paracasei exhibited suppressed growth at pH 2 & 3. Previous researchers reported that various hydrogen ion concentrations effect the growth of bacteria and suppressed growth. According to Prasad et al. [21] while consumption of probiotic bacteria it will mixed with food and carrier matrix molecules. The probiotic bacteria are not exposed directly to the stomach HCl concentration. Bacterial strains showed maximum growth when the bile salts concentration was 0.8% (Fig. 4). Maximum percentage of growth rate was observed in Lb. fermentum when compared with Lactobacillus sp. G3_4_1TO2. Todorov et al. [33] reported that reduced growth was observed in Lb. plantarum ST194BZ and ST441BZ, Lb. paracasei ST242BZ and ST284BZ at 0.6% concentration of bile salts. The growth rate was reduced with increased concentration of bile salts. Bile plays a fundamental role in specific and nonspecific defense mechanism of the gut and the magnitude of its inhibitory effect is determined primarily by the bile salts concentrations. Therefore, the bile tolerance is considered as an important characteristic of LAB strains, which enables them to survive, grow and exert their action in gastro intestinal transit [1].
Fig. 3.

Low pH tolerance (2–10) showed by Lactobacillus sp. G3_4_1TO2 and Lactobacillus fermentum in MRS broth.
Fig. 4.

Bile salt tolerance showed by Lactobacillus sp. G3_4_1TO2 and Lactobacillus fermentum in MRS broth supplemented with 0.2–3% of bile.
Auto-aggregation and hydrophobicity are the important probiotic properties. In the present study both the strains exhibited auto-aggregation and hydrophobicity characters. Compared with Lactobacillus sp. G3_4_1TO2, Lb. fermentum showed maximum auto-aggregation and hydrophobicity property (Fig. 5). Due presence of hydrophobicity property the bacterial cells strongly adheres to the mucosal cells of host intestine and exerts physiological functions [24]. Auto-aggregation is also an important probiotic character, two cells coexists each other which helps in the formation of biofilms. Zhao et al. [37] reports that the percentage for aggregation of four LAB isolates varied according to the solvent used and hydrophobicity of the same strain for different hydrophobic solvents were not exactly the same. Their results indicated that combined strains with low adherence ability or low and high together might significantly increase the adherence ability.
Fig. 5.

Hydrophobicity and auto-aggregation property exhibited by Lactobacillus sp. G3_4_1TO2 and Lactobacillus fermentum.
Pancreatic enzymes are secreted into the small intestine through the pancreatic duct and they are involved in digestion of proteins, carbohydrates and fats in foods. Ability to tolerate the presence of pancreatic enzymes is another criterion for selection of probiotic bacteria. Lactobacillus sp. G3_4_1TO2 and Lb. fermentum were tolerant to 0.5% concentration of pancreatin with growth rate of 9.52% and 2.08% respectively (Fig. 6). Results were in support by Khagwal et al. [16] reported that NKC903, NKC17 (3b), NKC6L2 & NKC18 (5C) exhibited maximum growth at 0.5% of pancreatin. Phenol tolerance the two tested bacterial strains were resistance at 0.2% of phenol and reduced growth was observed at 0.5% of phenol. For phenol tolerance Lb. fermentum showed maximum percentage of growth rate when compared with Lactobacillus sp. G3_4_1TO2 (Fig. 7). Phenols are the toxic metabolites which are liberated during digestion process, some aromatic amino acids and by endogenous proteins. For a particular probiotic bacteria, it should tolerate the limited amounts of phenols in the gastro intestinal tract [27].
Fig. 6.

Pancreatin tolerance showed by Lactobacillus sp. G3_4_1TO2 and Lactobacillus fermentum in MRS broth supplemented with 0.5% of pancreatin.
Fig. 7.

Phenol tolerance showed by Lactobacillus sp. G3_4_1TO2 and Lactobacillus fermentum in MRS broth supplemented with 0.2 & 0.5% of phenol.
Absence of hemolytic activity is considered as safe prerequisite for the selection of probiotic strain [8]. Haemolysis is a known virulence factor among pathogenic microorganisms. For hemolytic activity the two tested strains showed ɤ-haemolysis. Similar observation was reported by Maragkoudakis et al. [20] in L. paracasei isolated from dairy products which showed ɤ-haemolysis. But few LAB isolates like L. innocua ATCC 33,090 showed positive result [28]. The antibiotic sensitivity test, the two strains showed resistance to different antibiotics with different concentrations and zone of clearance (mm) was observed (Table 1). Fermented foods containing pathogenic microbes transfer their resistant genes to other microbes existing in the gut of human microflora [12]. Zhou et al. [38] reported that Pediococcus, Lueconostoc and Lb. rhamnosus showed resistant to vancomycin, kanamycin and tetracycline. On other hand Charteris et al. [6] reported that antibiotic resistant strains involved in antibiotic induced diarrhea.
Table 1.
Zone of clearance showed by L. fermentum and Lactobacillus sp. G3_4_1TO2 with different antibiotics of different concentrations.
| Organisms | Antibiotics | Zone of clearance (mm) |
|||
|---|---|---|---|---|---|
| 128 µg/ml | 256 µg/ml | 512 µg/ml | 1024 µg/ml | ||
| Lactobacillus sp. G3_4_1TO2 | Penicillin G | 8.1 | 8.9 | 9.9 | 12.6 |
| Chloramphenicol | 4.2 | 4.4 | 5.6 | 5.9 | |
| Ampicillin | 8.3 | 10.0 | 10.5 | 18.0 | |
| Erythromycin | 8.0 | 8.9 | 10.2 | 10.3 | |
| Gentamycin | 4.0 | 4.5 | 4.9 | 6.0 | |
| Lactobacillus fermentum | Penicillin G | 8.1 | 8.9 | 10.2 | 13.0 |
| Chloramphenicol | 3.0 | 4.1 | 4.5 | 5.1 | |
| Ampicillin | 8.5 | 10.3 | 11.2 | 14.8 | |
| Erythromycin | 7.9 | 7.9 | 8.5 | 13.0 | |
| Gentamycin | 4.1 | 4.6 | 5.3 | 5.4 | |
3.3. Enzyme production
The production of different dietary enzymes was tested by inoculating the culture with specific media. Among all three enzymes the extracellular amylase production of two strains was observed by the zone of clearance around the colony, when treated with iodine solution (Fig. 8). Maximum amylase production by observed by Lactobacillus sp. G3_4_1TO2 with average diameter 1.23 mm. Similar results were reported by Bogale and Prapulla, [3] on Lactobacillus plantarum strains and Lactobacillus fermentum. Among all the strains Lactobacillus plantarum KoA1 produced maximum amylase by observing the zone of clearance with 2.1 mm diameter. Fossi and Tavea, [9] reported that production of amylase from Lactobacillus fermentum isolated from soil.
Fig. 8.
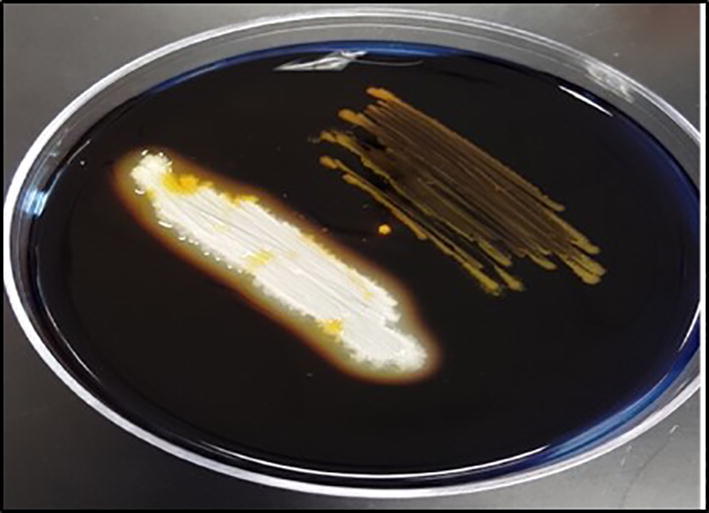
Bacterial strain shown amylase production by formation of clear zone around the colony.
3.4. Enzyme properties
Commercial use of amylase do not require purification process but application of amylase in pharmaceutical and clinical purpose require high purity of enzyme. Depending upon the specific characteristics of target biomolecule, different methods for purification of enzyme have been investigated. The acetone precipitation method and the ammonium sulfate methods followed by the dialysis gave a good yield of the amylase. The protein represented 55.4% of the original enzyme, with the specific activity of 88.9 U/mg and 40.8% purification fold. Similar results were reported by Tavea et al. [34] purified the amylase enzyme produced by Lactobacillus fermentum 04BBA19 isolated from soil. The protein represented 55.4% of original enzyme with 1253.4 U/mg specific activity and 41.2 purification fold. The molecular weight of protein is 95,000 K Da. Burgess-Cassler and Syed [5] reported that 70,000 Da α- amylase protein was obtained from Lactobacillus amylovorus. The purity of enzyme was confirmed by observing the single band on SDS- PAGE analysis. The amylolytic activity of protein was confirmed by incubating the gel in iodine solution, showed a clear zone around the band. The molecular weight of the protein was 95,000 Da when compared with marker (Fig. 9). The majority of a-amylases produced by lactic acid bacteria is near to 100,000 Da. The results were in agreement with Talamond et al. [35] found the value of 106,000 Da for α-amylase obtained from Lb. fermemtum Ogi E1 100,000 Da for α-amylase from Lb. manihotivorans and 99,500 Da for α-amylase from Lb. plantarum. Panda et al. [22] reported that the specific activity of amylase increased after partial purification from 1.411 U/mg/protein to 3126.91 U/mg/protein with 23.3% of yield and 2.2-fold purification.
Fig. 9.

SDS-PAGE showing the single band of purified protein in lane 1.
4. Conclusion
The present study revealed that Lactobacillus sp. G3_4_1TO2 is a potential probiotic bacteria and produced amylase enzyme. Amylolactic acid bacteria can be recommended in the development of cereal based foods, fermented foods such as European sour rye bread, Asian salt bread, sour porridges, dumplings and non-alcoholic beverage production. The combination of starch and amylolactic acid bacteria is a cost effective fermentation process. Further research is needed to study the industrial application of Lactobacillus sp. G3_4_1TO2.
Footnotes
Peer review under responsibility of National Research Center, Egypt.
References
- 1.Argyri A.A., Zoumpopoulou G., Karatzas K.A.G., Tsakalidou E., Nychas G.J.E., Panagou E.Z., Tassou C.C. Food Microbiol. 2013;33:282–291. doi: 10.1016/j.fm.2012.10.005. [DOI] [PubMed] [Google Scholar]
- 2.Alsaheb R., Azzam A., Othman N.Z., Malek R., Leng O.M., Aziz R., Hesham A. J Chem Pharmaceut Res. 2015;7:729–735. [Google Scholar]
- 3.Bogale A.T., Prapulla S.G. Int J Mod Chem Appl Sci. 2015;2(4):211–214. [Google Scholar]
- 4.Bradford M. Anal Biochem. 1976;72:248–254. doi: 10.1006/abio.1976.9999. [DOI] [PubMed] [Google Scholar]
- 5.Burgess-Cassler A., Syed I. Curr Microbiol. 1991;23:207–213. [Google Scholar]
- 6.Charteris W.P., Kelly P.M., Morelli L., Collins J.K. Lett Appl Microbiol. 1998;26:333–337. doi: 10.1046/j.1472-765x.1998.00342.x. [DOI] [PubMed] [Google Scholar]
- 7.Ewing WH. Edwards and Ewing’s identification of Enterobacteriaceae. New York: Elsevier Science Publishing Co Inc; 1986.
- 8.FAO/WHO Working Group Report on Drafting Guidelines for the Evaluation of Probiotics in Food London, Ontario, Canada; April 30 and May 1, 2002.
- 9.Fossi BT, Tavea F. Biochem. Gene. Mol. Bio. book edited by Marcelino Kongo, ISBN 978-953-51-0955-6, Published: January 30; 2013. http://doi.org/10.5772/50456.
- 10.Fossi B.T., Tavea F., Fontem L.A., Robert N., Samuel W. Biotechnol Rep. 2014;4:99–106. doi: 10.1016/j.btre.2014.09.004. [DOI] [PMC free article] [PubMed] [Google Scholar]
- 11.Giraud E., Gosselin L., Marin B., Parada J.L., Raimbault J Appl Microbiol. 1993;75:276–282. [Google Scholar]
- 12.Gunyakti A., Ozusaglam M.A., Mujtaba M. J Microbiol Biotechnol Res. 2017;7:16–24. [Google Scholar]
- 13.Haki G.D., Rakshit S.K. Biores Technol. 2003;89:17–34. doi: 10.1016/s0960-8524(03)00033-6. [DOI] [PubMed] [Google Scholar]
- 14.Holt J.G. Williams and Wilkins; Baltimore: 1984. Bergey’s manual of systematic bacteriology. [Google Scholar]
- 15.Igarashi T., Aritake S., Yasumoto T. Nat Toxins. 1999;7:71–79. doi: 10.1002/(sici)1522-7189(199903/04)7:2<71::aid-nt40>3.0.co;2-0. [DOI] [PubMed] [Google Scholar]
- 16.Khagwal N., Sharma P.K., Sharma D.C. Afr J Microbiol Res. 2014;8:1573–1579. [Google Scholar]
- 17.Kunal M., Satish V., Ritu T. J Pharm Biomed Sci. 2011;12:12. [Google Scholar]
- 18.Kovatcheva-Datchary P., Arora T. Best practice & research clinical. Gastroenterology. 2017;27:59–72. doi: 10.1016/j.bpg.2013.03.017. [DOI] [PubMed] [Google Scholar]
- 19.Morlon-Guyot J., Guyot J.P., Pot B., Jacobe de Haut I., Raimbault M. Int J Syst Bacteriol. 2001;48:1101–1109. doi: 10.1099/00207713-48-4-1101. [DOI] [PubMed] [Google Scholar]
- 20.Maragkoudakis P.A., Zoumpopoulou G., Miaris C., Kalantzopoulos G., Pot B., Tsakalidou E. Int Dairy J. 2006;16:189–199. [Google Scholar]
- 21.Prasad J., Gill H., Smart J., Gopal P.K. Int Dairy J. 1998;8:993–1002. [Google Scholar]
- 22.Panda S.H., Swain M.R., Shakthimay K., Ramesh C.R., Dider M. Polish J Microbiol. 2008;57:149–155. [PubMed] [Google Scholar]
- 23.Rao J.L., Satyanarayna T. Lett Appl Microbiol. 2003;36:191–196. doi: 10.1046/j.1472-765x.2003.01283.x. [DOI] [PubMed] [Google Scholar]
- 24.Rodrigues L.R. Adv Exp Med Biol. 2011;715:351–367. doi: 10.1007/978-94-007-0940-9_22. [DOI] [PubMed] [Google Scholar]
- 25.Shehata M.G., Shaimy S.A., EI-Sahn M.A., Youssef M.M. Ann Agric Sci. 2016 [Google Scholar]
- 26.Singh S.K., Ahmed S.U., Pandey A. Process Biochem. 2006;41(5):991–1000. [Google Scholar]
- 27.Šušković J., Brkić B., Matošić S., Marić V. Milchwissenschaft. 1997;52:430–435. [Google Scholar]
- 28.Sieladie DV, Zambou NF, Kaktcham PM, Cresci A, Fonteh F. 2011; 11: p. 12–28.
- 29.Souza P.M., Magalhães P.O. Brazilian J Microbiol. 2010;41:850–861. [Google Scholar]
- 30.Sundarram A., Murthy T.P.K. J Appl Environ Microbiol. 2014;2:166–175. [Google Scholar]
- 31.Talamond P., Desseaux V., Moreau Y., Santimone M., Marchis-mouren G. Biochem Physiol. 2002;133:351–360. doi: 10.1016/s1096-4959(02)00157-4. [DOI] [PubMed] [Google Scholar]
- 32.Tanyildizi M.S., Ozer D., Elibol M. Process Biochem. 2005;40:2291–2296. [Google Scholar]
- 33.Todorov S.D., LeBlanc J.G., Franco B.D.G.M. World J Microbiol Biotechnol. 2012;28:973–984. doi: 10.1007/s11274-011-0895-z. [DOI] [PubMed] [Google Scholar]
- 34.Tavea F., Fossi B.T., Takop N.G., Robert N. J Microbiol Res. 2016;6:47–54. [Google Scholar]
- 35.Usharani B., Muthiraj M. Afr J Microbiol Res. 2010;4:1057–1063. [Google Scholar]
- 36.William J.Bruno., Nicholas Socci D., Halpern Aaron L. Mol Biol. 2000;17 1–1. [Google Scholar]
- 37.Zhao T., Podtburg T.C., Zhao P., Chen D., Baker D.A., Cords B. J Food Prot. 2013;74:601–607. doi: 10.4315/0362-028X.JFP-12-323. [DOI] [PubMed] [Google Scholar]
- 38.Zhou J.S., Pillidge C.J., Gopal P.K., Gill H.S. Int J Food Microbiol. 2005;98:211–217. doi: 10.1016/j.ijfoodmicro.2004.05.011. [DOI] [PubMed] [Google Scholar]