

Abstract
Inulinase are industrial food enzymes which have gained much attention in recent scenario. In this study, Inulinase producing eight bacterial colonies were isolated and screened from three different plant root tubers soil sample. Among 8 inulinase producing colonies, the higher yielding colony was selected with 25.10 U/mL for further studies. The best inulinase producing colony was identified by partial 16S rRNA gene sequence as Bacillus sp. The crude inulinase was purified by using ammonium sulphate precipitation, dialysis and ion exchange chromatography on DEAE – sephacel and obtained 1.9 purification fold with total activity 293 U. The purified enzyme was subjected to characterization studies and it was found to be stable at 30–60 °C and optimum temperature was at 55 °C. The enzyme was stable at pH 3.0–7.0 and optimum pH was at 6.5. The Km and Vmax value for inulinase was found to be 0.117 mg/mL and 4.45 μmol min mg−1 respectively, demonstrate its greater affinity. Hence, this enzyme can be widely used for the production of fructose, and fructooligosaccharides, which are important ingredients in food and pharmaceutical industry.
Keywords: Inulinase, Bacillus sp., Purification, Characterization, Food industry
1. Introduction
Inulinase are inulin hydrolysing enzyme, which is a natural storage polymer found widely in plants particularly roots and tubers [1]. Inulinase is one among the industrial enzyme, in plants which was first isolated from the root tubers of Helianthus tuberosus which was capable of hydrolysing plant fructans [2]. Also, animal and plant sources cannot be commercially explored due to lesser yields.
The use of microorganisms to produce inulinases will become a viable alternative to obtain this enzyme in larger quantity. Many microorganisms, including fungi, yeast and bacteria have been claimed as inulinase producers [3]. In recent research, Inulinasehas received significant attention as it can be widely applied to hydrolyze inulin for the production of fuel ethanol, fructose, and fructo-oligosaccharides, both of which are important ingredients in food and pharmaceutical industry [1].
Fructose and fructose oligosaccharides were accepted in most countries as food ingredient without restrictions in food formulation. In the U.S., a panel of experts performed a generally accepted as safe (GRAS) Self-Affirmation Evaluation in 1992 and concluded similarly. At high doses, increased flatulence and osmotic pressure can cause intestinal discomfort. Inulinase are being used for production of high fructose syrups, fructo oligosaccharides, ethanol and inulooligosaccharides that are extensively used in pharmaceutical and food industry. Fructose production by enzymatic inulin hydrolysis is more advantageous than conventional process based on starch, which requires the action of amylase; amyloglucosidase and glucose isomerase and yields only 45% of fructose in the final product, due to thermodynamical equilibrium of the reaction [4]. The use of microbial inulinases (EC 3.2.1.7), which yield up to 95% of pure fructose in a single-step enzymatic reaction, therefore a viable alternative for the production of high-fructose syrup [5].
Sucrose has a higher sweetcapacity and it has a beneficial effect in diabetic patients. On the other hand, sucrose cause problems related to carcinogenicity and atherosclerosis so, fructose is being an alternative sugar. It has low calorie than sucrose. In addition, fructose has higher solubility than sucrose and less viscous. Fructooligosaccharides have good functional and nutritional properties such as low calorie diet, Bifidus stimulating factor, and source of dietary fibre in food preparations [6]. These oligosaccharides, therefore, are now widely used to replace sugars in many food applications such as chocolate and dairy products.
There are few studies on inulinase producing bacteria that have already been reported, which includes Bacillus subtilis 430A [7]; Streptomyces sp. [8]; Sphingobacterium sp. GN25 [9]; Sphingomonassp. JB13 [10]; Bacillus sp. SG113, ASN 3 [11]. Therefore, in the present study, we report on partial purification and characterization of exoinulinase from Bacillus sp. Isolated from rhizosphere soil samples for the use of food and pharamaceutical industrial applications.
2. Materials and methods
Different soil samples (Gulmohar, Ghanera, and Garden soil) were collected from Kumaraguru College of Technology, Coimbatore. These rhizosphere soil samples were stored at 4 °C for further use.
2.1. Screening of inulinase producing bacteria
The bacteria enriched culture from 1 g different soil samples were carried out respectively with selecting medium 100 mL (inulin, 20 g/L, yeast extract, 5.0 g/L, (NH4)2SO4, 5.0 g/L, pH 7.0) in 250-ml flask at incubator for 48 h. Clear single colonies were picked after enriched bacteria culture spread and cultivated on selecting agar medium at incubator for 48 h, was used for further identification, and inulinase activity assay.
For confirming, inulinase producing microorganisms containing agar plate with 1% inuline was flooded with 5 mL of 1% Lugol’s iodine and examined for a zone of clearance around the colony which indicated the presence of the inulinase.
2.2. Identification of inulinase producing microorganism
Among eight isolates tested, higher yielding strain was identified by 16SrRNA sequencing. The 16S rDNA gene was amplified by polymerase chain reaction (PCR)(Applied Biosystem- gene amp PCR system 9700, USA) with forward primer 8f (5′-GAGTTTGATCATGGCTCAG-3′) reverse primer 1495r (5′-CTACGGCTACCTTGTTACG-3′). The target fragment separated by 1% agarose electrophoresis and recovered using PCR purification kit. The obtained sample was subjected to partial 16S rDNA gene sequencing (3130xl Genetic Analyser (Applied Biosystems). The sequencing data were analyzed with the BLAST program (The National Centre for Biotechnology Information (NCBI)).
2.3. Production of inulinase from bacterial isolate
The inulinase producing strain was inoculated in the fermentative medium (liquid medium). Bacterial Strain capable of using inulin as carbon source were inoculated in the liquid medium. The constituents of the liquid medium were (g/L): 10 g inulin, 5 g sodium nitrate, 2 g potassium dihydrogen phosphate, 0.5 g MgSO4, and incubated at 37 °C for 48 h. The cultures were centrifuged at 10,000 rpm for 15 min at 4 °C and the supernatants were collected then the enzyme activity was assayed.
2.4. Inulinase assay
The supernatant obtained was used for inulinase estimation using the DNS method. The 3,5-dinitrosalisilic acid (DNS) method was used to identify the released reducing sugar. 0.1 mL of crude enzyme and 0.9 mL of 1% inulin dissolved in 0.2 M phosphate buffer (pH 7). The suspension was incubated at 35 °C for 15 min and then 3 ml of DNS was added to the mixuture. The mixture was kept in boiling water bath (100 °C) for 10 min to inactivate the enzyme and cooled to room temperature. The reaction was measured in a spectrometer at 520 nm and calibrated against a standard fructose. One enzyme unit was defined as the amount of enzyme that liberates 1 µmoL of fructose from inulin [12].
2.5. Protein determination
Protein content was determined by the Bradford method using bovine serum albumin as a standard [13].
2.6. Purification of inulinase from bacterial isolate
All steps were performed at 4 °C using 0.2 M phosphate buffer pH 7.0. The crude enzyme sample was centrifuged at 10,000 rpm for 15 min and the obtained clear supernatant was treated with ammonium sulphate precipitation method (ASP). These crude extract was partially purified by salting out with ammonium sulphate at concentration (40–80%) saturations. The solution was centrifuged at 10,000 rpm for 15 min. The supernatant was discarded. After centrifugation the precipitates were collected. The formed precipitate was dissolved in a small volume of 0.2 M phosphate buffer pH 7 (1:10). The excess salt bound to the protein after the ammonium sulphate precipitation as removed by dialyzing the protein against 0.2 M sodium phosphate buffer, (pH 7.0) [12].
2.6.1. Anion exchange chromatography
The previously prepared dialyzed protein sample was applied to anionic exchange chromatography DEAE-saphacel column. It was Pre equilibrated with 0.2 M sodium phosphate buffer, pH 7.0. The exchange materials were eluted with stepwise gradient concentrations of NaCl ranged from 0.0 to 0.5 M prepared in the same buffer and collected in 3 mL fractions. The fractions showing inulinase activities were pooled in according elution order [14].
2.7. Physico-chemical characterization studies
2.7.1. Effect of different factors on enzyme activity
The activity of an enzyme is affected by its environmental conditions, i.e., temperature, pH, enzyme concentration, substrate concentration and incubation period. These are the factors were investigated and all the experiments were carried out in triplicates for each experimental run [15].
2.7.2. Determination of kinetic parameters
The Km value and maximum reaction velocity (Vmax) for inulin were determined by the method of Line weaver–Burk plots. In order to determine the Km and Vmax, 100 μL of purified inulinase enzyme was added to the test tubes each with 2 mL of 0.1 M acetate buffer pH 6.5 containing various concentration of inulin. The reaction mixture was incubated at 35 °C for 10 min and the enzyme activity was measured at 540 nm [16].
2.8. Analysis of hydrolysis products of inuline by thin layer chromatography (TLC)
The end products of the enzyme catalysed reaction were visualized using thin layer chromatography. The hydrolysis product sample was spotted on pre coated TLC plate. 1% fructose, 1% inulin was used as standards. The solvent system used was n-butanol, isopropanol, acetic acid, and water (7:5:2:4) and iodine was used as developing reagent [17].
3. Results and discussion
In this study, we have investigated the partial purification and characterization of exoinulinase produced from Bacillus sp. which was isolated from rhizosphere soil samples collected from KCT campus, Coimbatore. During the primary screening, among the eight bacterial inulinase producing isolates from various sources (Gulmohar, Ghanera, and Garden), higher yielding strain was chosen based on hydrolytic zone formation and among the eight bacterial isolates strain five showed maximum enzyme activity as depicted in Fig. 1. The inulinase producing strain was identified by partial 16S rRNA gene sequence. The phylogenetic tree analysis of the isolates using the neighbour joining method based on maximum composite likelihood revealed that the isolate clustered into one region with Bacillus sp. and the strain was close relatives of the genus Bacillus (Fig. 2).
Fig. 1.

(a) Zone of maximum inulin hydrolysis on inulin agar plate by strain 3; (b) Selection of higher yielding strain based on enzyme activity (U/mL).
Fig. 2.

Phylogenetic tree showing the position of the isolate based on the partial 16S rRNA sequence comparison, obtained by the neighbor-joining method.
Among the eight inulinase producer the highest activity level of inulinase from Bacillus sp. was recorded in the supernatant of extracellular enzyme (25.10 U/mL). This level was comparable to those reported from the other Bacillus subtilis, Lactobacillus casei, Pseudomonas aeruginosa, and Achromobactersp. The maximum inulinase accumulation (333 U/L) has been observed for the isolate Achromobacter sp. and other three isolates of Bacillus subtilis, Lactobacilluscasei, and Pseudomonas aeroginosa also produced maximum inulinase activities ranging from 221 to 333 U/L in the supernatant [18]. Similar results were also already reported using Xanthomonas oryzae no. 5 by Pessoa and Vitola [19].
The enzyme purification procedure involves three steps in this study, Ammonium Sulphate Precipitation, Dialysis and Anion exchange chromatography. The results of purification of inulinase from Bacillus sp. were shown in Table 1. The crude protein obtained from 60% ammonium sulphate precipitation at 4 °C for an overnight and followed by dialysis, increased in specific activity 14.70 U/mg and its concentration increased up to 1.5-fold. After Ammonium sulphate precipitation and dialysis, the sample was loaded on anion exchange chromatography (AEC) of DEAE Saphacel which result was 1.9-fold with 11.6% yield. The elution profile showed that single active peaks exhibited appeared as shown in Fig. 3. Comparatively the AEC purification fold results higher than crude extract. Similar purification scheme is reported by Meenakshi et al. [20].
Table 1.
Purification scheme of inulinase by Bacillus sp.
| Purification scheme | Volume of the sample (ml) | Total activity (U) | Total protein (mg) | Specific activity (U/mg) | Yield (%) | Purification fold |
|---|---|---|---|---|---|---|
| Crude sample | 100 | 2510 | 263.4 | 9.53 | 100 | 1 |
| Ammonium sulphate precipitation and Dialysis | 50 | 910 | 61.9 | 14.70 | 36.2 | 1.5 |
| Anion exchange chromatography | 25 | 293 | 15.9 | 18.45 | 11.6 | 1.9 |
Fig. 3.

An elution profile for the ion exchange chromatography of Bacillus sp. on DEAE-saphacel column previously equilibrated with 0.2 M sodium phosphate buffer, pH 7.0 at a flow rate of 3 ml/5 min.
The optimum substrate concentrations for inulinase activity were observed by varying concentrations of inulin. The higher inulinase activity was observed at 1% of inulin with 13.1 U/mL and minimal activity was observed at 2% with 4.2 U/mL (Fig. 4). Already it has been reported as one of the best carbon source for the production of inulinases from different microorganisms’ in-cluding KluyveromycesmarxianusYS-1, Kluyveromyces marxianus DSM 70106, Kluyveromyces marxianus var. bulgaricus, Bacillus smithii T7 and Cryptococcus aureus G7a [21], [22], [1], [23].
Fig. 4.
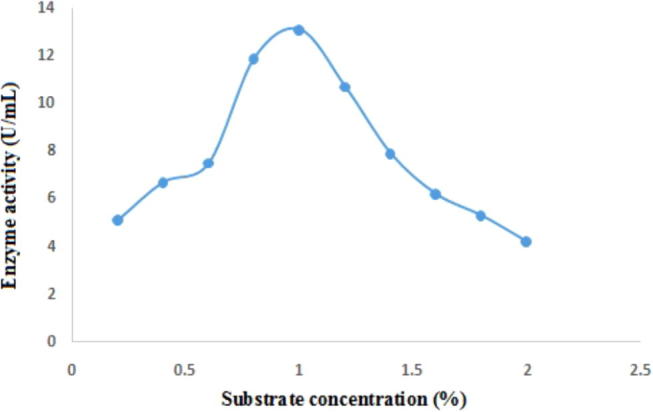
Effect of different concentrations of inulin on inulinase production by Bacillus sp.
The purified inulinase performed with various pH range from 3 to 8. The enzyme was stable at pH 3.0–7.0 and optimum pH was und to be 6.5. The obtained results were closely related to Kang et al. [24], who has reported that the enzyme produced by Arthrobacter sp. exhibited high activity at range of pH 5.0–10.5 and optimum was recorded at pH 7.5, whereas, Haraguchi, 2010 [25] found that the maximum activity of the enzyme produced by Arthrobacter ureafaciens D13-3 was obtained at pH 6.5. Here, the Bacillus sp. producing inulinase optimum pH was found to be 6.5 and stable at pH 3.0–8.0 as shown in Fig. 5. Bacterial inulinases generally have optimum temperature in the range 30–60 °C [26]. The Inulinase enzyme from Bacillus sp. demonstrated optimum activity at 55 °C and it also retains reasonable enzyme activity between 30 °C and 75 °C. Hence, indicating its thermostable nature as shown in Fig. 6. This study was accordance with Aruna and Hati [27]. Similar results were also observed for exoinulinase from the bacterium Geobacillus stearothermophilus KP1289 [28].
Fig. 5.

Effect of pH on inulinase production by Bacillus sp.
Fig. 6.

Effect of temperature on inulinase production by Bacillus sp.
Bacillus sp. showed inulinase production starting from 5th of growth and reached maximum in 15th and then it declined with further increase in duration of incubation (Fig. 7). Similar results were obtained for Bacillus sp. strain LCB41 which requires 11 h for maximum inulinase production [29]. On the other hand, inulinase activity was found to be the highest after 96 h by Marinimicrobium sp. LS-A18 [30]. The purified inulinase showed broad substrate specificity, its Km and Vmax values for inulin were 0.117 mg/ml and 4.45 μmol min−1 mg−1 respectively. It demonstrates its greater affinity for inulin substrate (Fig. 8). Its Km value for inulin was lower compare to Streptomyces sp. CP01 (2.34 mM) [14], Bacillus smithii T7 (4.17 mM) [1] and Kluyveromyces marxianus var. bulgaricus (11.9 mM) [29].
Fig. 7.

Effect of incubation time on inulinase production by Bacillus sp.
Fig. 8.

Lineweaver-Burk curve of inulinase from Bacillus sp.
The TLC analysis of the hydrolysis demonstrated that fructose was the major sugar produced during hydrolysis of inulin (Fig. 9). This techinque was usually applied for the characterization of mode of action of the enzyme, from this analysis it infer that the isolates are exo-acting enzymes.
Fig. 9.

Thin layer chromatography for characterization of inulin hydrolysis products by inulinase. Lane 1 Inulin, Lane 2 Sucrose, Lane 3 Fructose, Lane 4 Inulin hydrolysis with 0.1% sample, Lane 5 Inulin hydrolysis with 0.2% sample, Lane 6 Inulin hydrolysis with 0.3% sample.
4. Conclusion
In this study, the bacterial inulinase produced from Bacillus sp. and crude inulinase was purified to obtain higher purification fold 1.9 with total activity 293 U. The produced inulinase showed thermo-stable in nature, hence it can be used as a potential heat resistant candidate for commercial usage. TLC analysis showed the fructose was found to be the main products of hydrolysis inulin. Hence, preparation of purified inulinase from Bacillus sp. could be used as industrial production of fructo and inulooligosaccharides for food and pharmaceutical applications.
Footnotes
Peer review under responsibility of National Research Center, Egypt.
References
- 1.Gao W., Bao Y., Liu Y., Zhang X., Wang J., An L. Appl Biochem Biotechnol. 2009;157:498–506. doi: 10.1007/s12010-008-8313-1. [DOI] [PubMed] [Google Scholar]
- 2.Edelman J., Bacon J.S.D. Biochem J. 2009;49:529–540. doi: 10.1042/bj0490529. [DOI] [PMC free article] [PubMed] [Google Scholar]
- 3.Chi Z., Zhang T., Liu G., Li J., Wang X. Biotechnol Adv. 2009;27:236–255. doi: 10.1016/j.biotechadv.2009.01.002. [DOI] [PubMed] [Google Scholar]
- 4.Pandey A., Soccol C.R., Selvakumar P., Soccol V.T., Krieger N., Fontana J.D. Appl Biochem Biotechnol. 1999;81:35–52. doi: 10.1385/abab:81:1:35. [DOI] [PubMed] [Google Scholar]
- 5.Gill P., Manhas R., Singh J., Singh P. J Food Eng. 2006;76:369–375. [Google Scholar]
- 6.Belmari M., Sassi A.H., Savart M., Tantaoui-Elaraki A., Cottin P. Lett Appl Microbiol. 1994;19:410–413. [Google Scholar]
- 7.Vullo D.L., Cotto C.E., Sineriz F. Appl Environ Microbiol. 1991;57:2392–2394. doi: 10.1128/aem.57.8.2392-2394.1991. [DOI] [PMC free article] [PubMed] [Google Scholar]
- 8.Sharma A.D., Kainth S., Gill P. J Food Eng. 2006;77:486–491. [Google Scholar]
- 9.Zhou J., Gao Y., Zhang R., Mo M., Tang X., Li J., Xu B., Ding J., Huang Z. Process Biochem. 2014;49:1656–1663. [Google Scholar]
- 10.Zhou J., Peng M., Zhang R.J., Li J., Tang X., Xu B., Ding J., Gao Y., Ren J., Huang Z. Extremophiles. 2015;19:383–393. doi: 10.1007/s00792-014-0724-z. [DOI] [PubMed] [Google Scholar]
- 11.Gavrailov S., Ivanova V. ASN. 2016;3:68–73. [Google Scholar]
- 12.Jing W., Zhengyu J., Bo J., Xueming X. Curr Microbiol. 2003;47:109–112. doi: 10.1007/s00284-002-3917-0. [DOI] [PubMed] [Google Scholar]
- 13.Bradford M. Anal Biochem. 1976;72:248–254. doi: 10.1016/0003-2697(76)90527-3. [DOI] [PubMed] [Google Scholar]
- 14.Laowklom N., Chantanaphan R., Pinphanichakarn P. Nat Resour. 2012;3:137–144. [Google Scholar]
- 15.Nakamura T., Kuramori K., Zaita N., Akimoto H., Ohta K. Bull Fac Agric Miyazaki University. 2001;48:49–58. [Google Scholar]
- 16.Sanal E.F., Ertan F., Aktac T. J Biol Sci. 2005;5:497–505. [Google Scholar]
- 17.Park J.P., Bae J.T., You D.J., Kim B.W., Yun J.W. Biotechnol Lett. 1999;21:1043–1046. [Google Scholar]
- 18.Angel S.A., Kavitha C., Vidyadharani G., Priya R., Dhandapani R. Int J Appl Biol Pharm. 2012;34:320–326. [Google Scholar]
- 19.Pessoa J.R.A., Vitola M. Braz J Chem Eng. 1999;16:345–348. [Google Scholar]
- 20.Meenakshi S, Umayaparvathi S, Manivasagan P, Arumugam M, Balasubramanian T. Indian J Geo-Marine Sci 2013;42:510–5.
- 21.Singh S., Dhaliwal R., Puri M. Process Biochem. 2006;41:1703–1707. [Google Scholar]
- 22.Sheng J., Chi Z.M., Li J., Gao L.M., Gong F. Process Biochem. 2007;42:805–811. [Google Scholar]
- 23.Fawzi E.M. Braz J Microbiol. 2011;42:633–649. doi: 10.1590/S1517-838220110002000028. [DOI] [PMC free article] [PubMed] [Google Scholar]
- 24.Kang S.I., Chang Y.J., Oh S.J., Kim S.I. Biotechnol Letter. 1998;20:983–986. [Google Scholar]
- 25.Haraguchi K. Carbohydr Polym. 2010;82:742–746. [Google Scholar]
- 26.Gill P.K., Sharma A.D., Harchand R.K., Singh P. Bioresour Technol. 2003;87:359–362. doi: 10.1016/s0960-8524(02)00262-6. [DOI] [PubMed] [Google Scholar]
- 27.Aruna K., Hati A. Int J Pure Appl Biosci. 2014;2:161–176. [Google Scholar]
- 28.Kato K., Araki T., Kitamura T., Morita N., Moori M., Suzuki Y. Starch. 1999;51:253–258. [Google Scholar]
- 29.Allais J.J., Lopez G., Baratti J.C. Carbohydr Polym. 1987;7:277–290. [Google Scholar]
- 30.Li A.X., Guo L.Z., Lu W.D. World J Microbiol Biotechnol. 2012;28:81–89. doi: 10.1007/s11274-011-0794-3. [DOI] [PubMed] [Google Scholar]