

Abstract
Triterpenoid saponins are a diverse group of bioactive compounds, which are used for possessing of many biomedical and pharmaceutical products. Generally, squalene synthase (SQS) is defined as an emerging and essential branch point enzyme far from the major pathway of isoprenoids biosynthetic and a latent adjusting point, which manages carbon flux into triterpenes biosynthesis and sterols. The present study deals with the detailed characterization of SQS by bioinformatics approaches to evaluate physicochemical properties, structural characteristics including secondary and 3D structure prediction and functional analysis from eight plants related to Fabaceae family and Arabidopsis thaliana. Bioinformatics analysis revealed that SQS proteins have two transmembrane regions in the C-terminal. The predicted motifs were used to design universal degenerate primers for PCR analysis and other molecular applications. Phylogenetic analysis showed conserved regions at different stretches with maximum homology in amino acid residues within all SQSs. The secondary structure prediction results showed that the amino acid sequence of all squalene synthases had α helix and random coil as the main components. The reliability of the received model was confirmed using the ProSA and RAMPAGE programs. Determining of active site by CASTp proposes the possibility of using this protein as probable medication target. The findings of the present study may be useful for further assessments on characterization and cloning of squalene synthase.
Keywords: Bioinformatics analysis, Fabaceae, Squalene synthase, Triterpenoid biosynthesis
1. Introduction
The Fabaceae family, commonly known as legumes, are one of the most important plant families in both economical and medicine terms. Being the third largest family of angiosperms after Orchidaceae and Asteraceae with 630 genera and over 18,860 species, this family can be found in many climates [1]. Members of the Fabaceae such as Glycine max (soybean), Phaseolus (beans), Pisum sativum (pea), Cicer arietinum (chickpeas) and Medicago sativa (alfalfa) are among the most important crops in the world, by which a widespread range of natural products (e.g., drugs, dyes, flavors and poisons) could be synthesized [2]. Triterpenes are a huge variety of natural products which produced by Legumes [3]. For example, it was possible to retrieve soyasaponins (β-amyrin-derived oleanane-type triterpenoid saponins) from different legumes, including Pisum sativum [4], Glycine max [5] and various types of the genus Medicago [6]. However, this isolation demonstrated the normal presence of soyasaponins in leguminous vegetables. Since ancient times, licorice (stolon and root of glycyrrhzia) has been recognized as one of the legumes with the most basic therapeutic features. Medicinal importance of Licorice is due to the presence of a main active component called Glycyrrhizin , an oleanane-type saponin, in a large amount (2–8% of the dry weight) in the underground parts of plant [7]. Moreover, licorice has been recognized as the most conventional Asiatic folk drugs, which is applied as an agent that reduces inflammation on neutrophil functions, such as generation of reactive oxygen species (ROS) (Rahman and Sultana, 2007). Recognized as blocking agent of lipid peroxidation chain reactions, Glycyrrhizin is a quenching agent of free radicals. Other pharmacological activities of Glycyrrhizin are antiviral against various DNA and RNA viruses including HIV, antioxidative activities, hepatoprotective effect (probably by preventing changes in cell membrane permeability) and immunomodulatory activities [8]. It is also used worldwide as a natural sweetener [9]. Furthermore, Glycyrrhizin normally transpires as potassium and calcium salt in licorice [10]. All these triterpenic compounds are synthesized via the isoprenoid pathway. Isoprenoids are derived from common C5 building blocks namely isopentenyl diphosphate (IPP) and its isomer dimethylallyl diphosphate (DMAPP). Two various pathways, including MEP (2-C-methyl-D-erythritol 4-phosphate), which happens in the plastids, and MVA (mevalonate), which functions in the cytoplasm, are applied to create these practical entities, which work as precursors to all terpenoid structures [11], [12], [13]. Squalene synthase (SQS) is the key enzyme of triterpenoid synthesis pathway. This enzyme is generally defined as an emerging and essential branch point enzyme far from the major pathway of isoprenoids biosynthetic and a latent adjusting point, which manages carbon flux into triterpenes biosynthesis and sterols [14]. The biosynthetic pathway and two-step reaction of reductive dimerization of farnesyl pyrophosphate (FPP) by SQS is shown in Fig. 1.
Fig. 1.

Squalene synthase (SQS) in the triterpenoid biosynthesis pathway. Squalene synthase participates in a two-step reaction in which two identical molecules of FPP are converted into one molecule of squalene with the consumption of NADPH.
In this study, we focused on squalene synthase as an important rate-limiting enzyme at the branch point of metabolic pathway FPP and other metabolic products [15]. Due to the positive relationship between the levels of triterpenes and SQS expression rate [16], [17], [18], [19], we used the bioinformatics methods to analyze the SQS protein in eight plants of Fabaceae family and A. thaliana and designed universal degenerate primers of SQS. These information can be used for gene expression analysis and other molecular applications.
2. Materials and methods
2.1. Retrieval of the sequences and plant materials
The amino acids sequences of SQSs (FASTA format) related to eight plants of Fabaceae family and Arabidopsis thaliana were retrieved from UniProtKB database (http://www.uniprot.org/) and documented in Table 1. As Table 1 shows, two copies of the SQS gene were reported in some studying plants. Plant materials including leaves samples of studying plants were collected from the field of Medicinal Plants and Drugs Research Institute (MPH), Shahid Beheshti University, Tehran, Iran and frozen immediately using liquid nitrogen until RNA extraction.
Table 1.
Squalene synthase protein and cDNA sequences in eight plants of Fabaceae family and A. thaliana.
| Plant | Copy number of the SQS | Protein registry number (UniProtKB) | Encoding amino acids length/aa |
|---|---|---|---|
| Arabidopsis thaliana | SQS1 | P53799 | 410 |
| SQS 2 | O65688 | 413 | |
| Glycyrrhiza eurycarpa | SQS 1 | A4F3P0 | 413 |
| SQS 2 | A4F3P1 | 412 | |
| Glycyrrhiza glabra | SQS 1 | Q42760 | 413 |
| SQS 2 | Q42761 | 412 | |
| Glycyrrhiza uralensis | SQS 1 | A4F3N8 | 413 |
| SQS 2 | A4F3N9 | 412 | |
| Astragalus membranaceus | SQS | A0A0K2DSF0 | 413 |
| Glycin max | SQS | O22107 | 413 |
| Lotus japonicus | SQS | Q84LE3 | 413 |
| Medicago truncatula | SQS | Q8GSL6 | 413 |
| Phaseolus vulgaris | SQS | V5N8M3 | 413 |
2.2. Sequence analysis
The composition and various physical and chemical parameters of squalene synthase cDNA and amino acid sequence including isoelectric point (pI), molecular weight (Mw), instability index (II) [20], aliphatic index (AI) [21] and grand average hydropathy (GRAVY) [22] of the protein were analyzed using ExPasy tool ProtParam online analysis (http://us.expasy.org/tools/protparam.html). Hydrophobic and hydrophilic features and transmembrane structure domain were analyzed using Protscale (http://web.expasy.org/cgi-bin/protscale/protscale.pl) and TMHMM (http://www.cbs.dtu.dk/services/TMHMM/). The SignalP software version 4.1 and SMART online tool were used for the signal peptide prediction of squalene synthase. (http://www.cbs.dtu.dk/services/SignalP/, http://smart.embl-heidelberg.de/). PSORT Prediction [23] can be used in subcellular localization analysis (http://psort.hgc.jp/form.html). One of the most useful tools for analyzing post-translational modifications is PROSITE, a database on the ExPASy site. It contains a list of short sequence motifs (also some named patterns) that experiments have associated with particular biological properties. Many of these patterns are associated with post-translational modifications.
The motifs were identified applying PROSITE database and MOTIF search tool (http://www.genome.jp/tools/motif). Multiple alignments were conducted using T-coffee server using ClustalW method. The universal degenerate primers were designed regarding to conserved motifs and then tested by PCR analysis. Total RNA was extracted using IHTB method [17] from the leaves of the plants, then the first strand cDNA was synthesized from the isolated RNA templates by reverse transcriptase with Oligo-(dT)18 primers according to the instructions of the RevertAidTM H M-MuLV First Stand cDNA Synthesis Kit (Thermo Fisher Scientific, Fermentas). Polymerase chain reaction (PCR) was performed using degenerate primers which designed (forward 5′- GTGGCWGGACTTGTTGG -3′ and reverse 5′- CCARAACATGCGTGACTT -3′). The 25 μl reactions contained 1 μl of the synthesized cDNA, 1 μl of each primer and 12.5 μl 2X PCR master mix (Sinaclon, Iran) and 9.5 μl distilled water. The PCR conditions include initial denaturation at 94 °C for 5 min, followed by 35 cycles [94 °C for 1 min, 50 °C for 1 min, 72 °C for 30 sec] and final extension at 72 °C for 5 min. The amplified product were separated on a 1% agarose gel and visualized by ethidium bromide staining.
Phylogenetic analysis was performed using the Neighbor Joining method through molecular evolution genetics analysis (MEGA) software, version 7 [24]. The evolutionary history of the taxa analyzed was presented taking the bootstrap consensus tree, which is deduced from 5000 replicates. In addition, P-distance technique was applied to calculate the evolutionary distances. Moreover, elimination of all positions, which had missing data and gaps, from the dataset was carried out in the research (full option of omission).
2.3. Secondary and 3D structure prediction
Secondary structure was predicted via SOPMA [25] and the PSIPRED server (PSIPRED V3.3) (http://bioinf cs.ucl.ac.uk/psipred/). Three-dimensional (3D) protein structure of Glycyrrhiza glabra (Q42760) was constructed as a representative of this family using MODELLER 9.18 [26] (https://salilab.org/modeller/), a system that was applied for modeling the 3D form of a protein from its sequence of amino acid applying methods of homology modeling. The sequence homology search was performed using the algorithm of protein-BLAST (blastp) against the protein databank. After that, extraction of template proteins’ 3D structure and sequence from the database of PDB was performed.
After modeling, the models were evaluated by MODELLER’s normalized DOPE (Discrete Optimized Protein Energy) function. Energy minimization or geometry optimization was carried out to determine a stable conformer with Swiss PDB Viewer [27]. Structural evaluation and stereochemical analyses were done with Ramachandran plot analysis by using RAMPAGE [28]. The model having least number of residues in disallowed region was chosen as a best model. Problematic parts of the model were identified by ProSA (Protein Structure Analysis) server (https://prosa.services.came.sbg.ac.at), a tool widely used to check 3D models of protein structures for potential errors [29]. Structure visualization and structural superimposition was performed with chimera1.11.2 [30]. Applying the CASTp (calculated Atlas of surface topography of proteins) server (http://sts.bioengr.uic.edu/castp/index.php), the visualization and anticipated binding GGQS1 sites was assessed [31].
3. Results and discussions
3.1. Physicochemical properties
Table 2 contains the parameters calculated applying Expasy’s ProtParam tool. From the relative molecular analysis, the Q42760 had the largest relative molecular mass, Q42761 had the smallest relative molecular mass, both related to G. glabra (SQS1 & SQS2). Containing a zero net charge of protein, isoelectric point (pI) is the pH at which the amino acid is neutral, which is interpreted as the dominance of the zwitterion form. One of the important features of a protein is its pI, where the protein has the least solubility, making it unsteady. It is noteworthy that the protein is soluble in both above and below the isoelectric point (isoelectric pH). Another benefit of calculation of pI is its use in the development of buffer system in order to carry out purification process using the technique of isoelectric focusing. In an electro-focusing system, mobility is zero at pI. While a pI value below seven (pI < 7) demonstrates the zero net electrical charge of proteins at this pH value, the pI value above seven (pI > 7) indicates the zero net electrical charge at basic value of pH [32], [33] In theoretical isoelectric point value analysis, O22107 was the minimum (6.13), A4F3P1 was the maximum (8.21). Negatively charged residues (D + E) and positively charged residues (R + K), were basically the same range (47–53). This is helpful in determining the topology of protein as stated by Krogh et al [34]. Total atoms of Q42761 (6605) and O65688 (6703) were the minimum and maximum respectively. The amount of light absorbed by protein at a specific wavelength is indicated by the extinction coefficient. Calculation of this coefficient is beneficial to follow a protein with a spectrophotometer during purification. It should be noted that the range of this parameter was 0.9–1.229.
Table 2.
Physical and chemical properties of the amino acid encoding sequence of squalene synthase in eight plants of Fabaceae family and A. thaliana.
| UniProtKB | A | B | C | D | E | F | G | H | I |
|---|---|---|---|---|---|---|---|---|---|
| P53799 | 6.18 | 53 | 49 | 6632 | 1.229 | 30 h | 43.28 | 93.93 | −0.129 |
| O65688 | 8.13 | 50 | 53 | 6703 | 0.987 | 30 h | 35.87 | 101.5 | −0.055 |
| A4F3P0 | 7.93 | 49 | 51 | 6651 | 0.9 | 30 h | 42.69 | 96.13 | −0.085 |
| A4F3P1 | 8.21 | 47 | 50 | 6620 | 1.051 | 30 h | 34.98 | 93.76 | −0.077 |
| Q42760 | 7.56 | 50 | 51 | 6670 | 1.014 | 30 h | 41.48 | 96.13 | −0.086 |
| Q42761 | 6.89 | 49 | 48 | 6605 | 1.052 | 30 h | 37.61 | 94 | −0.071 |
| A4F3N8 | 7.93 | 48 | 50 | 6652 | 1.016 | 30 h | 42.26 | 96.13 | −0.078 |
| A4F3N9 | 7.57 | 49 | 50 | 6625 | 1.051 | 30 h | 36.62 | 95.19 | −0.081 |
| A0A0K2DSF0 | 6.7 | 49 | 47 | 6647 | 1.047 | 30 h | 42.51 | 95.42 | −0.036 |
| O22107 | 6.13 | 53 | 47 | 6627 | 1.049 | 30 h | 42.38 | 93.75 | −0.087 |
| Q84LE3 | 7.95 | 50 | 52 | 6640 | 1.05 | 30 h | 36.79 | 94.94 | −0.089 |
| Q8GSL6 | 7.54 | 51 | 52 | 6625 | 1.05 | 30 h | 38.45 | 91.84 | −0.142 |
| V5N8M3 | 7.17 | 49 | 49 | 6653 | 1.014 | 30 h | 41.43 | 96.56 | −0.015 |
A: Theoretical isoelectric point B: Negatively charged residues (Asp + Glu) C: Positively charged residues (Arg + Lys) D: Total number of atoms E: Extinction coefficient F: Half-life period G: Instability index H: Aliphatic index I: Grand average of hydropathicity (GRAVY).
The half-life period was exactly the same. The exact amount of time required by half of the protein in a cell to vanish after synthesis in the cell is predicted by the half-life. A relationship between a protein’s half-life and identity of its N-terminal residue is established by ProtParam, which depends on the “N-end rule” [35]. According to stability coefficients O65688, A4F3P1, Q42761, A4F3N9, Q84LE3, Q8GSL6 were stable proteins and the remaining were non-stable proteins. This results show that SQS2 is stable-protein in all plants. While a protein with the unsteadiness index of <40 is anticipated to be constant, index higher than 40 anticipates the possibility of instability of the protein. A protein’s aliphatic indicator is described as the comparative capacity filled by aliphatic side chains, including leucine, alanine, isoleucine and valine. This indicator might be considered a positive variable for elevation of globular proteins’ thermos-stability. The formula by Atsushi is applied to compute the aliphatic indicator of protein [21]. For Q8GSL6 and Q65688, this indicator was 91.84 to 101.5, respectively. In addition, Kyte and Doolittle [22] established the scale of hydropathy, where attention is paid to the hydrophobic features of a protein’s amino acid side chains. In a protein separated by its total residue number, estimation of GRAVY score is carried out by considering it as the sum of the hydropathy values for a protein’s amino acids. While positive value demonstrated the bipolar nature of protein, negative GRAVY value indicated that the protein is non-polar. Moreover, the range of −0.142 (Q8GSL6) to -0.015 (V5N8M3) was determined for the GRAVY index. The possibility of improved collaboration with water is demonstrated by this low range.
3.2. Hydropathy plot and transmembrane domain analysis
The hydrophilic or hydrophobic properties of the side-chain of an amino acid are presented by its hydropathy index [22]. A hydrophobicity score within the range of −4.5 to 4.5 is allocated to each amino acid, where the −4.5 score is indicative of most hydrophilic character and 4.5 determines the most hydrophobic feature.
The amino acid sequences of SQSs were analyzed using Kyte-Doolittle Hydropathy plot of Protscale tool at window size 19. In SQSs two transmembrane regions were observed in the C-terminal (Fig. 2a). Presence of transmembrane domains was also predicted on TMHMM server (http://www.cbs.dtu.dk/services/TMHMM/). Two domains were found in all member of Fabaceae family which only is showed for G. glabra in Fig. 2b, the first was from AA282 to AA304 for SQS1 and AA281 to AA304 for SQS2; the second was from AA388 to AA408 for SQS1 and AA385 to AA407 for SQS2, showing that the two transmembrane domains were compose of 20–23 amino acid residues in all members of Fabaceae, which is a binding site of membrane protein and membrane lipids.
Fig. 2.

(a) Hydrophobicity and hydrophilicity of SQS amino acid sequence from G. glabra. (Arrows indicate highly hydrophobic regions). (b) Transmembrane domains of SQS gene from G. glabra.
3.3. Signal peptide and subcellular localization features of squalene synthase
The most significant first part of comprehension of the function of a protein is discovering its subcellular localization. Online tools SignalP and SMART were used to predict amino acid signal peptide in all studying plants. The graphical output from SignalP (Fig. 3a) showed the three different scores, C, S and Y, for each position in the sequence. These indexes of signal peptide were lower than its threshold, indicating that No signal peptides were predicted for all squalene synthase proteins of this family and protein transport regulates by other factor. Recognition and interpretation of domains, that are genetically mobile, and evaluation of their architectures are possible by SMART (a Simple Modular Architecture Research Tool). There are broad explanations for these domains according to their tertiary structures, phyletic distributions, practically significant residues and practical level. The results of SMART tool showed that there were two functional domains in SQS protein that was coincidence with the prediction of transmembrane structure. The results are briefly explained in the SMART diagram presented in Fig. 3b. It is noteworthy that obtaining scores, which were less significant, compared to the determined cut-off point, led to the elimination of some domains from the diagram.
Fig. 3.

(a) Signal peptide prediction in G. glabra SQS protein by SignalP (SQS1: the left & SQS2: the right). (b) Schematic representation of transmembrane regions of G. glabra SQS protein by SMART (SQS1: the left & SQS2: the right).
3.4. Homologous alignment and phylogenetic analysis of SQS:
Multiple Sequence Alignment (MSA) analysis of SQS domain resulted in two conserved motifs. Motif 1 ‘‘YCHYVAGLVGLGLSKL’’ which was 16 residue long and motif 2 ‘‘MGLFLQKTNIIRDYLEDINEIPKSRMFWP’’ which was 29 residue long. These conserved motifs were present in all proteins considered for the study. According to previous reports, these motifs sequences are found in different plants with numerous residues replacement [36], [37], [38], [39]. Regarding the sequence of protein in all Fabaceae plants, there were two ranges of 168–183 and 201–229 for the motifs’ positions in motif 1 and 2, respectively. These positions are the same reported in W. somnifera [38]. These two conserved motifs were considered to design the universal degenerate primers. The efficiency of the designed primers in amplifying fragment of SQS gene was tested using RT-PCR. The fragment of 171 bp of SQS was successfully amplified for all plants (Fig. 4) which indicated the primers worked well and they can be used for molecular applications especially real time PCR.
Fig. 4.
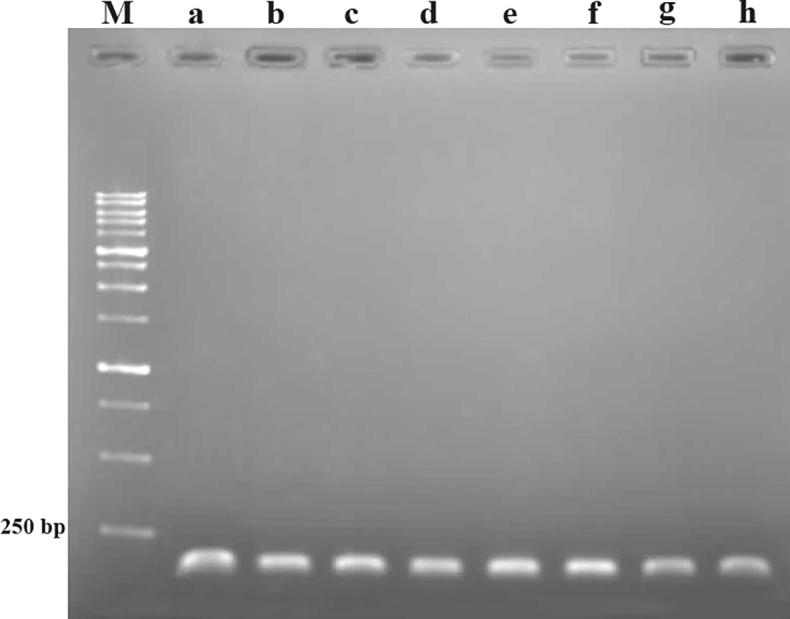
The results of RT-PCR for SQS gene (A), Glycyrrhiza eurycarpa (B), Glycyrrhiza glabra (C), Glycyrrhiza uralensis (D), Astragalus membranaceus (E), Glycin max (F) Lotus japonicus (G) Medicago truncatula (H) Phaseolus vulgaris. Amplification products were separated on a 1% agarose gel.
Phylogenetic tree was constructed for all Fabaceae species and A. thaliana to investigate the evolutionary relations (Fig. 5). According to molecular evidence, in some plants there is only one copy of the SQS gene in the genome, while other plants have multiple copies in their genome. For example, two or three SQS genes were reported in G. glabra, N. tabacum, A. thaliana, and p. genseng [40]. The results indicated that, they can be divided into two groups: SQSs of Fabaceae family were in Group 1; SQS1 and SQS2 of A. thaliana were in Group 2. Based on phylogeny, despite phylogenetic divergences at primary sequence level between Fabaceae species and A. thaliana SQSs, the homology was high within all plants, suggesting SQSs were derived from one ancestor gene and it has similar function in squalene biosynthesis. These data also showed that SQS1s of Fabaceae family were closely related to each other as compared to SQS2s, which showed phylogenetic divergence between SQS1 and SQS2.
Fig. 5.

Phylogenetic relationship of SQS eight plants of Fabaceae family and A.thaliana. Numbers above the branches are the Neighbor Joining bootstrap values. The evolutionary distance is reflected by the numbers below the branches and the branch lengths proportional to the degree of amino acid substitutions.
3.5. The advanced structures of SQS
Online tools SOPMA predicted SQS secondary structure in all studying plants, the results indicated SQS secondary structure is composed of α helix, random coil, the extended strand and Beta turn. Among them, α helix and random coil were the largest structural elements, extension chain and Beta turn scattered distribution in the entire protein.
In this regard, our findings are in line with the results previously reported in SQS of ginseng species [41] and W. somnifera [38] that the distribution of alpha helix and random coils are comparatively higher. The secondary structure of SQS was also predicted by the PSIPRED, Protein Structure Prediction Server (PSIPRED V3.3) which verified SOPMA results. The modeling of the three dimensional structure of the protein was performed by MODELLER for G. glabra (Q42760). We tried to obtain the best model from multiple templates. To select the appropriate templates for our query sequence, Six templates (1EZF, 3LEE, 3VJ8, 3WEK, 3WEJ and 3WEI (chain: A)) having maximum identity and lowest e value, belonging to the crystal structure of human Squalene Synthase with 48% sequence identity were considered as the best hits and ten models were created using this program. But only 4 models were selected based on DOPE score. Before modeling the residues in regions with no homology with the templates and hydrophobic regions were deleted. Ramachandran plot, a special way for plotting protein torsion angles, was used to assess the stereochemical quality of modeled protein structure by Rampage tool. The results revealed that the modeled structures have 96.9%, 2.8% and 0.3% of the residues in favoured, allowed and outlier regions respectively (Fig. 6). Efficient stereochemical accuracy is indicated by this spread of the dihedral angles (ϕ,ψ) in the enzyme residues of the plot.
Fig. 6.

(a) The 3D modelstructure of GgSQS1. Motif 1 and 2 are shown in yellow and pink colour, respectively. (b) 3D model validation of the model by using the Ramachandran plots (GgSQS1).
The total quality of the 3D model was assessed applying ProSA-web (z-score). The method of ProSA can accurately separate the total correct fold and those having incorrect folds [42]. The two significant outputs of this method include a plot of residue energies and Z-score. The ProSA Z-score of a model is the extent of similarity between its structure and sequence. It is preferred for the model to have the Z-score that can be compared to the template’s Z-score. The overall model quality Z-Score from ProSA-web was shown in Fig. 7a and b, where distinguishing colors are used to show the groups containing structures that are explained by NMR or X-ray. In addition, the Z-score of the model was −8.62, which is often observed in the range of scores of native proteins that have the same dimension. ProSA displayed quite similar overall model quality (Z-score) for homology model (−8.62) and template (−9.71). The plot of residue scores was showed in Fig. 7c. The local model quality can be shown by this plot of energy through maneuvering energies as a proposed to sequence position of amino acid. Generally, the inaccurate or problematical sections of the model is corresponded by positive values.
Fig. 7.

(a,b) Z-score of PROSA energy indicating overall model quality and its value displaying in a plot that contained the Z-scores of all experimentally determined protein chains in current PDB (a: homology model of GgSQS1, b: template). (c) PROSA energy plot calculated for GgSQS1 model.
The interaction energy for each residue of the structures was assessed by PROSA energy plot with the application of a distance-based pair potential residue with PROSA energies (negative), which confirmed the reliability of the model. After analyzing the model by PROSA, negative interaction energy of all residues was confirmed, where no residue had positive interaction energy. Finally, the model was also confirmed by superposition and the RMSD found to be 0.394 A0 (Fig. 8).
Fig. 8.
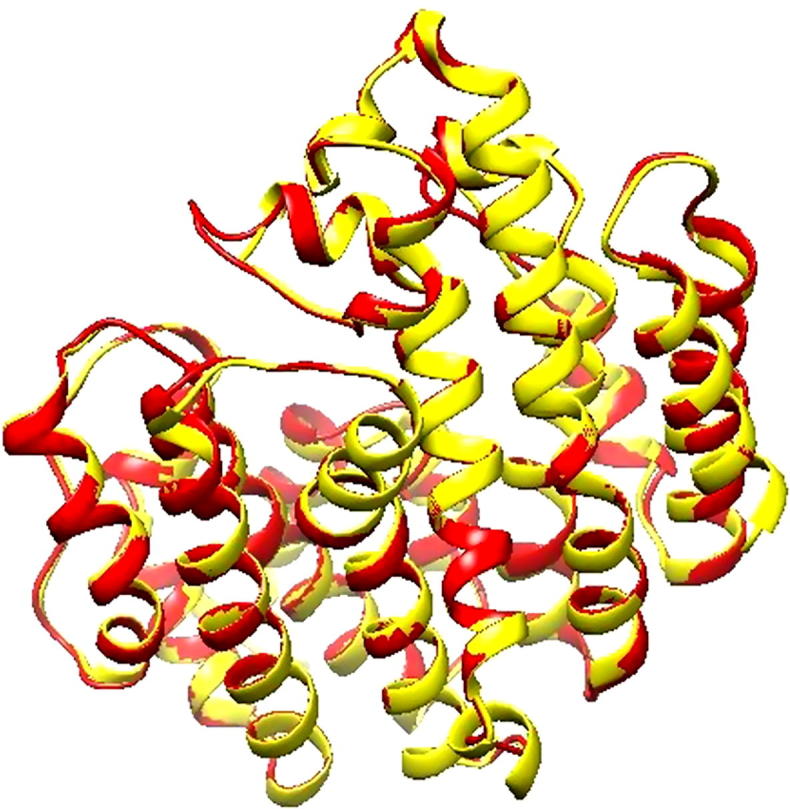
Superposition of optimized homology model (Red) against the structure of selected template (1EZF) (yellow) by using Chimera.
Usually, there are cavities and pockets created by active and bindings sites of proteins. Interior inaccessible cavities and surface accessible pockets for proteins are provided with measurements and recognition via CASTp. Predicted binding sites for GgSQS1 were M43-K46-V47-S48-R49-S50-F51-V54-I55-V66-F69-Y70-L73-R74-D77-T78-E80-D81-D82-T83-I85-A86-T87-K90-T112-K113-E114-T115-V117-L118-M147-M151-F154-I155-N157-E158-V159-T168-V172-A173-A176-G177-L180-S181-F184-S198-M201-G202-L205-Q206-T208-N209-I210-R212-D213-L215-E216-D217-E220-I221-T223-S224-R225-M226-F227-T273-F285-C286-I287-P288-Q289-M291-A292-T296-V306-G309-V310-K312-M313-R314-R315-T318 (Fig. 9).
Fig. 9.

3D structure and predicted binding sites of GgSQS1, predicted by using CASTp servers. Green colors indicate the predicted active site residues of SQS.
4. Conclusion
In the present research, bioinformatics tools were applied to evaluate the SQS proteins from the Fabaceae family. The secondary structure prediction results showed that the amino acid sequence of all studying SQSs had α helix and random coil as the main components. Multiple sequence alignment showed that SQSs had a high identity with each other. The phylogenetic analysis of SQS demonstrated a difference between the sequences of Arabidopsis SQS and other studies Fabaceae species, which might be due to differences in the functions of SQS sequences in triterpenoid saponins or phytosterol pathways. According to the obtained information, SQS proteins were efficiently preserved in the structure and sequence both, which might be due to their biological function. The homology model of GgSQS1 was built using high homologous proteins. The generated model was subjected to various validation methods which proved that it held significant degree of authenticity. The model created with server of CASTp and template were structurally compared, which was followed by searching of the probable binding sites of SQS. In addition, the similar performance of SQS in squalene biosynthesis was proposed as a result of the high preserving of residues (included in the activity and binding for performance of SQS) in most SQSs. Valuable theoretical information can be provided by the physicochemical and structural data anticipated in the presented study in order to functionally assess this protein. Moreover, following biotechnological studies can use the results of the current research in order to manipulate the triterpenoid saponins biosynthesis pathway.
Footnotes
Peer review under responsibility of National Research Center, Egypt.
References
- 1.Judd W.S., Campbell C.S., Kellogg E.A. Plant systematics: a phylogenetic approach. Ecol Mediterr. 1999;25:215. [Google Scholar]
- 2.Patel S.S., Shah D.B. Phylogenetics analysis of some Leguminosae family species based on rbcl sequence data. Int J Adv Biotechnol Res. 2014;1:331–336. [Google Scholar]
- 3.Phillips D.R., Rasbery J.M., Bartel B. Biosynthetic diversity in plant triterpene cyclization. Curr Opin Plant Biol. 2006;9:305–314. doi: 10.1016/j.pbi.2006.03.004. [DOI] [PubMed] [Google Scholar]
- 4.Yokota T., Baba J., Konomi K. Identification of a triterpenoid saponin in etiolated pea shoots as phytochrome killer. Plant Cell Physiol. 1982;23:265–271. [Google Scholar]
- 5.Kitagawa I., Taniyama T., Nagahama Y. Saponin and sapogenol. XLII: Structures of acetyl-soyasaponins A1, A2, and A3, astringent partially acetylated bisdemosides of soyasapogenol A, from American soybean, the seeds of Glycine max MERRILL. Chem Pharm Bull (Tokyo) 1988;36:2819–2828. [Google Scholar]
- 6.Tava A., Avato P. Chemical and biological activity of triterpene saponins from Medicago species. Nat Prod Commun. 2006;1:1159–1180. [Google Scholar]
- 7.Seki H., Ohyama K., Sawai S. Licorice β-amyrin 11-oxidase, a cytochrome P450 with a key role in the biosynthesis of the triterpene sweetener glycyrrhizin. Proc Natl Acad Sci USA. 2008;105:14204–14209. doi: 10.1073/pnas.0803876105. [DOI] [PMC free article] [PubMed] [Google Scholar]
- 8.Asl M.N., Hosseinzadeh H. Review of pharmacological effects of Glycyrrhiza sp. and its bioactive compounds. Phytother Res. 2008;22:709–724. doi: 10.1002/ptr.2362. [DOI] [PMC free article] [PubMed] [Google Scholar]
- 9.Hayashi H., Sudo H. Economic importance of licorice. Plant Biotechnol (Tsukuba) 2009;26:101–104. [Google Scholar]
- 10.Damle M. Glycyrrhiza glabra (Liquorice)-a potent medicinal herb. Int J Herb Med. 2014;2:132–136. [Google Scholar]
- 11.Lodeiro S., Xiong Q., Wilson W.K. An oxidosqualene cyclase makes numerous products by diverse mechanisms: a challenge to prevailing concepts of triterpene biosynthesis. J Am Chem Soc. 2007;129:11213–11222. doi: 10.1021/ja073133u. [DOI] [PubMed] [Google Scholar]
- 12.Lombard J., Moreira D. Origins and early evolution of the mevalonate pathway of isoprenoid biosynthesis in the three domains of life. Mol Biol Evol. 2011;28:87–99. doi: 10.1093/molbev/msq177. [DOI] [PubMed] [Google Scholar]
- 13.Ramawat K.G., Mérillon J.-M. Springer; Berlin, Heidelberg: 2013. Natural Products: Phytochemistry, Botany and Metabolism of Alkaloids, Phenolics and Terpenes. [Google Scholar]
- 14.Huang Z., Jiang K., Pi Y. Molecular cloning and characterization of the yew gene encoding squalene synthase from Taxus cuspidata. J Biochem Mol Bio. 2007;40:625–635. doi: 10.5483/bmbrep.2007.40.5.625. [DOI] [PubMed] [Google Scholar]
- 15.Goldstein J.L., Brown M.S. Regulation of the mevalonate pathway. Nature. 1990;343:425–430. doi: 10.1038/343425a0. [DOI] [PubMed] [Google Scholar]
- 16.Seo J.-W., Jeong J.-H., Shin C.-G. Overexpression of squalene synthase in Eleutherococcus senticosus increases phytosterol and triterpene accumulation. Phytochemistry. 2005;66:869–877. doi: 10.1016/j.phytochem.2005.02.016. [DOI] [PubMed] [Google Scholar]
- 17.Mirjalili M., Moyano E., Bonfill M. Overexpression of the Arabidopsis thaliana squalene synthase gene in Withania coagulans hairy root cultures. Biologia Plantarum. 2011;55:357–360. [Google Scholar]
- 18.Lee M.-H., Jeong J.-H., Seo J.-W. Enhanced triterpene and phytosterol biosynthesis in Panax ginseng overexpressing squalene synthase gene. Plant Cell Physiol. 2004;45:976–984. doi: 10.1093/pcp/pch126. [DOI] [PubMed] [Google Scholar]
- 19.Kim Y.S., Cho J.H., Park S. Gene regulation patterns in triterpene biosynthetic pathway driven by overexpression of squalene synthase and methyl jasmonate elicitation in Bupleurum falcatum. Planta. 2011;233:343–355. doi: 10.1007/s00425-010-1292-9. [DOI] [PubMed] [Google Scholar]
- 20.Guruprasad K., Reddy B.B., Pandit M.W. Correlation between stability of a protein and its dipeptide composition: a novel approach for predicting in vivo stability of a protein from its primary sequence. Protein Eng. 1990;4:155–161. doi: 10.1093/protein/4.2.155. [DOI] [PubMed] [Google Scholar]
- 21.Atsushi I. Thermostability and aliphatic index of globular proteins. J Biochem. 1980;88:1895–1898. [PubMed] [Google Scholar]
- 22.Kyte J., Doolittle R.F. A simple method for displaying the hydropathic character of a protein. J Mol Biol. 1982;157:105–132. doi: 10.1016/0022-2836(82)90515-0. [DOI] [PubMed] [Google Scholar]
- 23.Emanuelsson O., Nielsen H., Brunak S. Predicting subcellular localization of proteins based on their N-terminal amino acid sequence. J Mol Biol. 2000;300:1005–1016. doi: 10.1006/jmbi.2000.3903. [DOI] [PubMed] [Google Scholar]
- 24.Tamura K., Peterson D., Peterson N. MEGA5: molecular evolutionary genetics analysis using maximum likelihood, evolutionary distance, and maximum parsimony methods. Mol Biol Evol. 2011;28:2731–2739. doi: 10.1093/molbev/msr121. [DOI] [PMC free article] [PubMed] [Google Scholar]
- 25.Geourjon C., Deleage G. SOPMA: significant improvements in protein secondary structure prediction by consensus prediction from multiple alignments. Comput Appl Biosci. 1995;11:681–684. doi: 10.1093/bioinformatics/11.6.681. [DOI] [PubMed] [Google Scholar]
- 26.Fiser A., Šali A. Modeller: generation and refinement of homology-based protein structure models. Meth Enzymol. 2003;374:461–491. doi: 10.1016/S0076-6879(03)74020-8. [DOI] [PubMed] [Google Scholar]
- 27.Guex N., Peitsch M.C. SWISS-MODEL and the Swiss-Pdb Viewer: an environment for comparative protein modeling. Electrophoresis. 1997;18:2714–2723. doi: 10.1002/elps.1150181505. [DOI] [PubMed] [Google Scholar]
- 28.Lovell S.C., Davis I.W., Arendall W.B. Structure validation by Cα geometry: ϕ, ψ and Cβ deviation. Proteins. 2003;50:437–450. doi: 10.1002/prot.10286. [DOI] [PubMed] [Google Scholar]
- 29.Wiederstein M., Sippl M.J. ProSA-web: interactive web service for the recognition of errors in three-dimensional structures of proteins. Nucl Acids Res. 2007;35:W407–W410. doi: 10.1093/nar/gkm290. [DOI] [PMC free article] [PubMed] [Google Scholar]
- 30.Pettersen E.F., Goddard T.D., Huang C.C. UCSF Chimera—a visualization system for exploratory research and analysis. J Comput Chem. 2004;25:1605–1612. doi: 10.1002/jcc.20084. [DOI] [PubMed] [Google Scholar]
- 31.Dundas J., Ouyang Z., Tseng J. CASTp: computed atlas of surface topography of proteins with structural and topographical mapping of functionally annotated residues. Nucl Acids Res. 2006;34:W116–W118. doi: 10.1093/nar/gkl282. [DOI] [PMC free article] [PubMed] [Google Scholar]
- 32.Shaw K.L., Grimsley G.R., Yakovlev G.I. The effect of net charge on the solubility, activity, and stability of ribonuclease Sa. Protein Sci. 2001;10:1206–1215. doi: 10.1110/ps.440101. [DOI] [PMC free article] [PubMed] [Google Scholar]
- 33.Kozlowski L.P. IPC–isoelectric point calculator. Biol Direct. 2016;11:55. doi: 10.1186/s13062-016-0159-9. [DOI] [PMC free article] [PubMed] [Google Scholar]
- 34.Krogh A., Larsson B., Von Heijne G. Predicting transmembrane protein topology with a hidden Markov model: application to complete genomes. J Mol Biol. 2001;305:567–580. doi: 10.1006/jmbi.2000.4315. [DOI] [PubMed] [Google Scholar]
- 35.Varshavsky A. The N-end rule pathway of protein degradation. Genes Cells. 1997;2:13–28. doi: 10.1046/j.1365-2443.1997.1020301.x. [DOI] [PubMed] [Google Scholar]
- 36.Filiz E., Ozyigit I.I., Vatansever R. Comparative analyses of squalene synthase (SQS) proteins in poplar and pine by using bioinformatics tools. Tree Genet Genomes. 2016;12:1–11. [Google Scholar]
- 37.Kim T.-D., Han J.-Y., Huh G.H. Expression and functional characterization of three squalene synthase genes associated with saponin biosynthesis in Panax ginseng. Plant Cell Physiol. 2011;52:125–137. doi: 10.1093/pcp/pcq179. [DOI] [PubMed] [Google Scholar]
- 38.Singh G., Sharma A. In silico study of binding motifs in squalene synthase enzyme of secondary metabolic pathway solanaceae family. Mol Biol Rep. 2014;41:7201–7208. doi: 10.1007/s11033-014-3603-x. [DOI] [PubMed] [Google Scholar]
- 39.Uchida H., Yamashita H., Kajikawa M. Cloning and characterization of a squalene synthase gene from a petroleum plant Euphorbia tirucalli L. Planta. 2009;229:1243–1252. doi: 10.1007/s00425-009-0906-6. [DOI] [PubMed] [Google Scholar]
- 40.Young-Jun P., Nemoto K., Minami M. Molecular cloning, expression and characterization of a squalene synthase gene from Grain Amaranth (Amaranthus cruentus L.) Jpn Agric Res Q. 2016;50:307–317. [Google Scholar]
- 41.Ding C., Zhao C.-L., Chen Z.-J. Bioinformatics analysis of the squalene synthase gene and the amino acid sequence in ginseng species. Int J Clin Exp Med. 2015;8:12818. [PMC free article] [PubMed] [Google Scholar]
- 42.Bhattacharya A., Wunderlich Z., Monleon D. Assessing model accuracy using the homology modeling automatically software. Proteins. 2008;70:105–118. doi: 10.1002/prot.21466. [DOI] [PubMed] [Google Scholar]