

Abstract
Spinal cord injury (SCI) leads to reactive inflammation and other harmful events that limit spinal cord regeneration. We propose an approach for studying the mechanisms at the levels of network topology, gene ontology, signaling pathways, and disease inference. We treated inflammatory mediators as toxic chemicals and retrieved the genes and interacting proteins associated with them via a set of biological medical databases and software. We identified >10,000 genes associated with SCI. Tumor necrosis factor (TNF) had the highest scores, and the top 30 were adopted as core data. In the core interacting protein network, TNF and other top 10 nodes were the major hubs. The core members were involved in cellular responses and metabolic processes, as components of the extracellular space and regions, in protein-binding and receptor-binding functions, as well as in the TNF signaling pathway. In addition, both seizures and SCI were highly associated with TNF levels; therefore, for achieving a better curative effect on SCI, TNF and other major hubs should be targeted together according to the theory of network intervention, rather than a single target such as TNF alone. Furthermore, certain drugs used to treat epilepsy could be used to treat SCI as adjuvants.
Introduction
Spinal cord injury (SCI) is followed by a complex cascade of inflammatory events, such as reactive astrocytosis, which upregulates many genes1,2 and forms a glial scar3–5. This typically results in a permanent loss of neurological function below the injury level3,4. Considerable efforts have been made in research involving SCI-induced inflammatory cytokines, such as neurotoxic reactive astrocytes induced by secreting IL-1α, TNF, and C1q that leads to activation of microglia2, and those represent potential therapeutic targets6–10; however, it is largely unclear how the genes associated with SCI (GAS) interact and which among them play key roles. We consider that a network-based integration and bioinformatic analyses of the data available for genes/proteins associated with disease will reveal possible mechanisms for assessing the effects of GAS on SCI, leading to greater clarity. As is known11, biochemical events driven by electrostatic forces and involving hydrophobic effects are the physical contacts with high specificity through which the gene or protein interaction network is established. In a network of biomolecules, the nodes (vertices) indicate genes or proteins, whereas the links (edges) indicate their physical (direct) or functional (indirect) interactions12. Network analysis has demonstrated an efficient approach for modeling biological systems12–14. For example, it could reveal the molecular mechanisms of cancer13–17 and infer the diseases associated with environmental chemicals18,19. During the last decade, with the popularization of RNA sequencing (RNA-seq) technologies and the development of bioinformatics analyses, a wealth of data for constructing a biomolecule network has been available from public databases/resources, such as Online Mendelian Inheritance in Man (OMIM)20, Kyoto Encyclopedia of Genes and Genomes (KEGG)21, Search Tool for the Retrieval of Interacting Genes/Proteins (STRING)22,23, and Comparative Toxicogenomics Database (CTD)24–26. OMIM is an updated catalog of human genes and genetic disorders and traits based on selection and review of the published peer-reviewed biomedical literature and has become one of the databases of the National Center for Biotechnology Information (NCBI)27; KEGG is a collection of databases with genomes, diseases, drugs, and chemicals, featuring the products of relevant pathways in biology; STRING includes experimental data, computational prediction methods and public text collections in biology, and links to numerous sources, and is able to generate known and predicted protein–protein interactions (PPIs); and CTD curates data on chemical–gene/protein interactions, chemical–disease and gene–disease relationships from selected literature sources in a structured format, and controlled vocabularies and inference scores, and integrates these data with those from NCBI, OMIM, KEGG, and 8 other databases, and links all the interactions to the original publications to enable users to access the source data for specific details about corresponding experiments. The inflammatory cytokines associated with SCI are neurotoxins2, and the toxicogenomics approaches can be used to identify them. TNF was first discovered in 1968 as a cytotoxic factor induced by lymphocytes and was referred to as a lymphotoxin (LT)28; therefore, it might be favorable for us to use the CTD database for collecting the SCI-gene data, and the CTD in-house scoring system for screening that data. There are thousands of curated genes associated with SCI in CTD that are available for the required bioinformatics analyses26, such as in this study about the effects of GAS on SCI.
In an effort to assess the effects of GAS on SCI, we designed a network-based integration and bioinformatics analysis approach, incorporating the disease-gene toxicogenomics26, PPI networks22,23, and gene ontology (GO) enrichment analysis29–32 and disease inference26. First, GAS were retrieved from CTD. Subsequently, the protein interactions involved in GASs were integrated from STRING database22,23, and visualized via Cytoscape33–35, a popular, open source bioinformatics software platform for network analysis. Finally, by using the interacting proteins, the functions and pathways associated with SCI were inferred. As a result, the most important as well as the top 30 interacting proteins were singled out; affected functions and pathways were identified; and diseases, including neurological and psychological disorders, were predicted, which provided better insight into the influence of GAS on SCI and related diseases. This analysis approach is also expected to be useful for studying neurotrophic factors and nerve growth factors involved in SCI and its consequences. Using biological data in system-level to study disease-gene associations is able to improve our current knowledge of disease relationships, leading to further improvements in disease diagnosis, prognosis and treatment.
Material and Methods
Genes/proteins associated with SCI (GAS)
GAS data were obtained from CTD26 by searching for genes involved in SCI, resulting in a list of 12,824 GAS or their protein products, which were then sorted by the CTD in-house “inference score” in descending order. The top 30 GAS (GAS30) with high scores (47.84-33.7) were taken as the core data in this study (i.e., in this context, the GAS30 represented the genes that were most closely associated with SCI). Then, Cytoscape (version3.4.0, 2016)34 and STRING (version 10.5)23 were conducted to query the protein-protein interactions of the GAS30. STRING is as an application (App, plugin) installed in Cytoscape. The data in STRING are weighted and integrated and a confidence score is calculated for all protein interactions according to the nature and quality of the supporting evidence. As a result, each of these interactions is assigned a confidence score between zero (no interaction) and one (high-confidence interaction), which indicates the probability that the interaction is authentic, given the available evidence. The default cutoff for confidence interactions is 0.418,19. This study utilized this default value to screen PPIs and only the interactions whose confidence scores were >0.4 were considered for network analysis. Of the established PPI network of the GAS30, all nodes were from CTD and with CTD in-house inference scores of >33, and all edges were from STRING and with STRING in-house confidence scores of >0.4. Furthermore, the plugin NetworkAnalyzer34 in Cytoscape was used to visualize molecular interaction networks and integration with gene expression profiles and other state data.
Enrichment analysis of gene ontology, pathway, and disease
Gene ontology (GO)31,32, a controlled vocabulary describing gene products and a useful resource for studying gene functions36, consists of three domains termed cellular components (CC), molecular functions (MFs), and biological processes (BP). Identifying enriched GO terms from a given gene list enables insight into the over-represented functions of genes29. Enrichment analysis of pathways and diseases is also an approach to the further understanding of the implicated pathways and diseases associated with SCI. Several web services such as the BinGO37 plugin of Cytoscape, OmicsBean38 and Set Analyzer26 of CTD can be employed for studying enriched GO terms, pathways and diseases, respectively. Among these services, the pathway-gene relationships for enrichment analysis are from the KEGG21 and REACTOME39 pathway databases, whereas the MEDIC disease vocabulary24 that combines the Medical Subject Headings (MeSH)40 and OMIM20 databases is used for analysis of enriched diseases. Briefly, we input the gene list of GAS30 respectively into BinGO or OmicsBean for GO term analysis; OmicsBean for pathways analysis; and the set analyzer of CTD for diseases analysis, while using a p-value of <0.05.
Results
PPI network analysis
A total of 12,824 genes were identified as associated with SCI using CTD as of December 12, 2017. Among these, the top 30 genes (GAS30) with CTD inference scores >33 are listed in Table 1. After inputting the GAS30 gene list into Cytoscape, assigning a link to STRING, and assuming that the interactions between the molecules were nondirectional and with interacting confidence scores of >0.4 in STRING, we obtained a PPI network for GAS30. Figure 1A shows a GAS30 PPI network that consists of 30 nodes and 232 edges. A node represents a molecule and an edge represents an interaction between two connected nodes. These two nodes are called neighbors. The fact that no edge is connected to a node such as myeloperoxidase (MPO) indicates that interactions between this node and others do not exist (at least their interacting confidence scores were ≤0.4) and it should be deleted from this network. The number of edges/neighbors related to a node is referred to as the degree of the node35,41,42. A node with a number of edges that greatly exceeds the average is referred to as hub and these play crucial roles in the network43. Therefore, molecules in the GAS30 network could be re-sorted by their node degrees. By use of NetworkAnalyzer34, a Cytoscape plugin for network topology analysis, the degrees of each node in the GAS30 network were calculated and the top 10 are listed in Table 2. Among these, the TNF node exhibited the greatest degree, and is termed a major hub. Furthermore, the top 10 interacting molecules become a sub-network of the GAS30 cohort, and are denoted as GAS10 and shown in Fig. 1B. The sub-network GAS10 comprised 10 nodes and 44 edges, leading to an extremely high clustering coefficient41 of 0.978 and an extremely small diameter44 of 2. That is, the 10 nodes were all major hubs and highly interconnected.
Table 1.
The top 30 genes associated with spinal cord injury (SCI) from the Comparative Toxicogenomics Database (CTD) and genes associated with SCI (GAS30).
| Gene | Gene ID | Inference Score | |
|---|---|---|---|
| 1 | MAPK1 | 5594 | 47.84 |
| 2 | IL6 | 3569 | 47.13 |
| 3 | AGT | 183 | 45.15 |
| 4 | CASP3 | 836 | 45.06 |
| 5 | MAPK3 | 5595 | 44.58 |
| 6 | CCL2 | 6347 | 44 |
| 7 | TGFB1 | 7040 | 43.61 |
| 8 | ITGAM | 3684 | 43.11 |
| 9 | MMP3 | 4314 | 41.76 |
| 10 | EDN1 | 1906 | 41.69 |
| 11 | IL1B | 3553 | 41.52 |
| 12 | FOS | 2353 | 40.79 |
| 13 | TNF | 7124 | 40.13 |
| 14 | TIMP1 | 7076 | 39.27 |
| 15 | CYBA | 1535 | 39 |
| 16 | APP | 351 | 37.77 |
| 17 | ICAM1 | 3383 | 37.76 |
| 18 | NOS2 | 4843 | 37.71 |
| 19 | NOS1 | 4842 | 36.44 |
| 20 | MMP9 | 4318 | 36.37 |
| 21 | MPO | 4353 | 36.37 |
| 22 | XBP1 | 7494 | 36.3 |
| 23 | FN1 | 2335 | 36.23 |
| 24 | IL4 | 3565 | 36.04 |
| 25 | GSK3B | 2932 | 35.3 |
| 26 | PTGS2 | 5743 | 35.1 |
| 27 | RELA | 5970 | 35.05 |
| 28 | STAT1 | 6772 | 34.23 |
| 29 | SOD2 | 6648 | 34.15 |
| 30 | THBS1 | 7057 | 33.7 |
Figure 1.

Protein–protein (PPI) networks. (A) The GAS30 network and (B) and GAS10 sub-network (A) presented in Table 2. Smaller nodes indicate the proteins whose three-dimensional structures were undetermined;larger nodes indicate the determined or predicted proteins. Colors of lines (edges) represent different interaction types.
Table 2.
The top 10 proteins associated with spinal cord injury (SCI) from Comparative Toxicogenomics Database (CTD), and genes associated with SCI (GAS30).
| Node | Full name of the node | Degree* | |
|---|---|---|---|
| 1 | TNF | Tumor necrosis factor | 25 |
| 2 | FOS | FBJ murine osteosarcoma viral oncogene homolog | 24 |
| 3 | IL6 | Interleukin 6 (interferon, beta 2) | 22 |
| 4 | PTGS2 | Prostaglandin-endoperoxide synthase 2 | 22 |
| 5 | TGFB1 | Transforming growth factor, beta 1 | 22 |
| 6 | ICAM1 | Intercellular adhesion molecule 1 | 21 |
| 7 | MMP9 | Matrix metallopeptidase 9 | 20 |
| 8 | STAT1 | Signal transducer and activator of transcription 1 | 20 |
| 9 | AGT | Angiotensinogen | 19 |
| 10 | EDN1 | Endothelin 1 | 19 |
*Node degree was measured for GAS30 network members.
Gene ontology (GO) analysis
GO term enrichment analyses of GAS30 proteins were conducted for biological processes (BPs), cellular components (CCs), and MFs using BinGO37 and OmicsBean38. Considering p < 0.05, there were 3,396, 210, and 251 terms for BPs, CCs, and MFs, respectively, enriched in GAS30. The top 10 terms for BPs, MFs, and CCs are listed in Table 3 and shown in Fig. 2.
Table 3.
Top 10 enriched gene ontology (GO) terms with genes associated with SCI (GAS30) for biological processes (BPs), cellular components (CCs), and molecular functions (MFs).
| GO term name | GO term ID | P-value | Gene number | |
|---|---|---|---|---|
| Biological Process (BP) | ||||
| 1 | Response to lipopolysaccharide | GO:0032496 | 3.36e-29 | 17 |
| 2 | Response to molecule of bacterial origin | GO:0002237 | 1.05e-28 | 17 |
| 3 | Response to oxygen-containing compound | GO:1901700 | 1.39e-28 | 24 |
| 4 | Reactive oxygen species metabolic process | GO:0072593 | 1.21e-27 | 16 |
| 5 | Response to biotic stimulus | GO:0009607 | 2.03e-27 | 21 |
| 6 | Response to bacterium | GO:0009607 | 6.74e-27 | 18 |
| 7 | Response to external biotic stimulus | GO:0043207 | 6.27e-26 | 20 |
| 8 | Response to other organism | GO:0051707 | 6.27e-26 | 20 |
| 9 | Response to oxygen-containing compound | GO:1901701 | 3.35e-25 | 20 |
| 10 | Reactive oxygen species biosynthetic process | GO:1903409 | 6.68e-25 | 12 |
| Cellular Component(CC) | ||||
| 1 | Extracellular space | GO:0005615 | 6.39e-13 | 15 |
| 2 | Secretory granule | GO:0030141 | 1.02e-11 | 9 |
| 3 | Extracellular region part | GO:0044421 | 3.61e-11 | 19 |
| 4 | Membrane-bounded vesicle | GO:0031988 | 1.22e-09 | 17 |
| 5 | Vesicle | GO:0031982 | 2.06e-09 | 17 |
| 6 | Extracellular region | GO:0005576 | 2.37e-09 | 19 |
| 7 | Membrane raft | GO:0045121 | 2.70e-09 | 7 |
| 8 | External side of plasma membrane | GO:0009897 | 4.07e-08 | 6 |
| 9 | Platelet alpha granule lumen | GO:0031093 | 1.76e-06 | 4 |
| 10 | Neuron projection | GO:0043005 | 8.38e-08 | 9 |
| Molecular function (MF) | ||||
| 1 | Receptor binding | GO:0005102 | 2.02e-13 | 16 |
| 2 | Protein binding | GO:0005515 | 4.57e-11 | 28 |
| 3 | Cytokine activity | GO:0005125 | 5.05e-11 | 8 |
| 4 | Cytokine receptor binding | GO:0005126 | 1.81e-10 | 8 |
| 5 | Enzyme binding | GO:0019899 | 1.38e-09 | 13 |
| 6 | Identical protein binding | GO:0042802 | 2.04e-09 | 11 |
| 7 | Heparin binding | GO:0008201 | 5.70e-09 | 6 |
| 8 | Protease binding | GO:0002020 | 2.16e-08 | 5 |
| 9 | Glycosaminoglycan binding | GO:0005539 | 6.15e-08 | 6 |
| 10 | Sulfur compound binding | GO:1901681 | 8.50e-08 | 6 |
Figure 2.

Histogram of top 10 enriched GO terms for GAS30 members.
The enriched BP analysis revealed that GAS30 could interfere with cellular responses and metabolic processes. Specifically, the process of responding to lipopolysaccharide involved 57% of GAS30 members (Fig. 2) and was promoted to the highest GO level in a significant p-value (Table 3). Lipopolysaccharide is a cell wall component of gram-negative bacteria, and is a type of endotoxin45 that is released only when bacterial cells are destroyed or when using an artificial method to kill the microorganisms. Considerable evidence has revealed the influence of lipopolysaccharides on central nervous system (CNS) diseases. For example, lipopolysaccharides can cause learning and memory disorders in rats subsequent to CNS inflammatory responses46,47, which positively supports the outcome of our GO term enrichment analysis for BPs.
The enriched GO terms for CCs of the interacting proteins were mostly related to the extracellular space components, in which the first two (i.e., extracellular space and extracellular region components), exhibited the most significant p-values in CCs (Table 3) and accounted for 50% and 63% of GAS30 members (Fig. 2), respectively. A hierarchical GO tree for CCs enriched in GAS30 is presented in Fig. 3.
Figure 3.

Hierarchical GO tree for cellular components enriched inGAS30. Considering a p-value of <0.05, the circle sizes are proportional to the number of genes included in each. A dark color indicates a highly significant p-value and a high degree of enrichment. White circles represent nonenrichment.
The MFs influenced by the interacting GAS30 proteins were mostly related to the protein-binding and receptor-binding functions, according to the enriched GO terms. Notably, protein binding accounted for the highest percentage (93%) in GAS30 in all enriched GO terms as shown in Fig. 2. Figure 4 shows a hierarchical tree of important GO terms for MFs affected by the interacting GAS30 proteins.
Figure 4.

Hierarchical GO tree for molecular functions enriched in GAS30 members. Considering a p-value of <0.05, the circle sizes are proportional to the number of genes included in each. A dark color indicates a highly significant p-value and a high degree of enrichment. White circles represent nonenrichment.
Pathway enrichment analysis
To further reveal the pathways affected by interacting GAS30 proteins, analyses were performed using OmicsBean38, a web service for processing biological data and with links to KEGG21 and other public databases. Following the instructions of OmicsBean, Table 4 and Fig. 5 were generated. The top 10 with the most significant p-values are listed in Table 4 and shown in Fig. 5. Specifically, the TNF signaling pathway was ranked at the top of the list, which accounted for 47% of GAS30 members.
Table 4.
Top 10 pathways enriched with genes associated with SCI (GAS30).
| Pathway name | Pathway ID | P-value | Gene number | |
|---|---|---|---|---|
| 1 | TNF signaling pathway | 04668 | 2.53e-18 | 14 |
| 2 | Leishmaniasis | 05140 | 1.39e-18 | 13 |
| 3 | AGE-RAGE signaling pathway in diabetic complications | 04933 | 4.69e-17 | 13 |
| 4 | Pertussis | 05133 | 2.51e-13 | 10 |
| 5 | Chagas disease (American trypanosomiasis) | 05142 | 7.32e-12 | 10 |
| 6 | Tuberculosis | 05152 | 7.39e-11 | 11 |
| 7 | Amoebiasis | 05146 | 1.79e-10 | 9 |
| 8 | Hepatitis B | 05161 | 2.22e-10 | 10 |
| 9 | Malaria | 05144 | 8.99e-10 | 7 |
| 10 | Influenza A | 05164 | 1.41e-09 | 10 |
Figure 5.
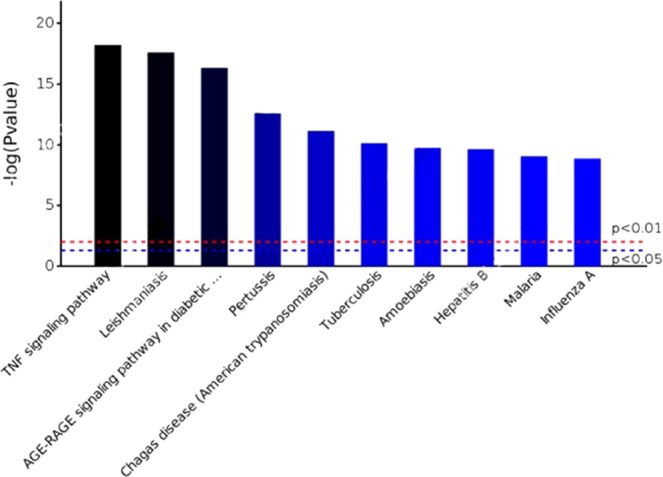
Histogram of the top 10 pathways involving GAS30 members. The horizontal axis indicates pathway names, whereas the vertical coordinates indicate the negative values of the log of the p-values: e.g., the horizontal dashed-lines in red and in blue have p-values equal to 0.01 and 0.05, respectively, and their vertical coordinates are equal to −log(0.01) = 2 and −log(0.05) = 1.3, respectively.
Nervous system diseases involving TNF inferred from CTD
The diseases associated with TNF were inferred using the toxicogenomics analyses of CTD, which yielded 570 nervous system diseases associated with TNF. The top 30 diseases sorted by CTD in-house inference scores are listed in Table 5. Notably, among these, seizures had the highest score (No. 1 in Table 5).
Table 5.
Top nervous system diseases associated with tumor necrosis factor (TNF) from the Comparative Toxicogenomics Database (CTD).
| Disease Name | Disease ID | Inference Score | |
|---|---|---|---|
| 1 | Seizures | MESH:D012640 | 380.98 |
| 2 | Memory disorders | MESH:D008569 | 374.18 |
| 3 | Learning disorders | MESH:D007859 | 334.94 |
| 4 | Hyperalgesia | MESH:D006930 | 334.94 |
| 5 | Nervous system diseases | MESH:D009422 | 279.82 |
| 6 | Muscular Diseases | MESH:D009135 | 250.16 |
| 7 | Neurotoxicity Syndromes | MESH:D020258 | 248.65 |
| 8 | Movement Disorders | MESH:D009069 | 235.38 |
| 9 | Brain Diseases | MESH:D001927 | 234.22 |
| 10 | Peripheral nervous system diseases | MESH:D010523 | 216.00 |
| 11 | Tremor | MESH:D014202 | 205.22 |
| 12 | Neurobehavioral manifestations | MESH:D019954 | 200.11 |
| 13 | Coma | MESH:D003128 | 191.74 |
| 14 | Brain injuries | MESH:D001930 | 188.08 |
| 15 | Muscle Weakness | MESH:D018908 | 181.50 |
| 16 | Vision Disorders | MESH:D014786 | 180.61 |
| 17 | Confusion | MESH:D003221 | 179.57 |
| 18 | Ataxia | MESH:D001259 | 176.91 |
| 19 | Paresthesia | MESH:D010292 | 173.00 |
| 20 | Central Nervous System Diseases | MESH:D002493 | 154.86 |
| 21 | Brain Ischemia | MESH:D002545 | 151.31 |
| 22 | Delirium | MESH:D003693 | 149.89 |
| 23 | Hallucinations | MESH:D006212 | 146.49 |
| 24 | Hyperkinesis | MESH:D006948 | 145.99 |
| 25 | Neural tube defects | MESH:D009436 | 145.79 |
| 26 | Stroke | MESH:D020521 | 143.60 |
| 27 | status epilepticus | MESH:D013226 | 142.91 |
| 28 | Dyskinesia, drug-induced | MESH:D004409 | 141.42 |
| 29 | Catalepsy | MESH:D002375 | 141.34 |
| 30 | Myoclonus | MESH:D009207 | 135.34 |
Discussion
We considered SCI-induced inflammatory mediators as a type of toxin that inhibits the regeneration of injured tissue/cells, and we identified the associated genes and interacting proteins from known biological medical databases, CTD26, STRING23, and others, and chose the top 30 genes/proteins, GAS30, that were useful for studying their effects on SCI at the levels of network topology, GO, signaling pathways, and disease inference to provide a new visual angle for finding potential methods by which SCI intervenes.
According to this study, more than 10,000 genes associated with SCI and TNF achieved the highest score. TNF, FOS, IL6, and seven other of the top 10 nodes (Table 2) were the major hubs and highly interconnected in the GAS30 PPI network that were identified using CTD, STRING, and related databases. From the perspective of network topology48, such a network allows for a fault-tolerant behavior for which, if a hub-failure occurs, the network will generally not lose its connectedness because of the remaining hubs that will rapidly replace the failing hub. This suggests that although TNF negatively affected SCI repair, all other major hubs, such as FOS IL6, should be targeted simultaneously in the future for the development of new therapeutic approaches, rather than aiming at individual specific genes, one at a time, which might achieve better curative effects.
Furthermore, GAS30 members interfered mainly with cellular responses and metabolic processes, extracellular space and extracellular region components, protein-binding and receptor-binding functions, and TNF signaling pathways as identified by GO and pathway enrichment analyses. Notably, the TNF signaling pathways were promoted to the highest enriched level of GAS30 members and had the most significant p-value (Table 4). Although considerable evidence has revealed the influence of TNF as an inducer of inflammatory cytokines after SCI7–9 (e.g., neurotoxic reactive astrocytes induced by activation of microglia through secreting Il-1α, TNF, and C1q2), greater attention should be paid to TNF in the future and consider it to be a major signaling pathway and its use as a crucial and potential therapeutic target for SCI repair.
In addition, seizures were highly associated with TNF by CTD disease inference (Table 5). Clinically, seizures might occur after traumatic brain injury, and interestingly, repeated seizures might develop into post-traumatic epilepsy49–51. Seizures were also observed following SCIs52,53. More interestingly, the antiepileptic drug valproate was used as a supplement in stem cell transplantation for a mouse model of SCI, which dramatically enhanced the restoration of hindlimb function54. These suggest that certain drugs used to treat epilepsy could be employed as adjuvants in SCI treatment; however, these observations and suggestions were not directly linked to TNF by the original researchers, and the mechanisms proposed are unclear. Therefore, TNF, which is the most important hub identified in this study, could be further connected to the aforementioned findings and would be a direction for future SCI studies.
There are other aspects of this study that must be mentioned. In addition to CTD, the genes/proteins associated with SCI or other diseases that were searched to construct the PPI networks and subsequent bioinformatics analyses could be from OMIM20,55 or other publicly available databases56, which would generate similar results because nearly all public databases are interconnected to the Internet; therefore, the primary data mostly overlap with each other. As such, CTD includes OMIM and 10 other databases26. We used CTD in this study for its full name (Comparative Toxicogenomics Database) as well as its functions that matched our requirements for treating inflammatory cytokines in SCI as a type of neurotoxin. In recent years, disease genome sequencing and other high-throughput studies of disease genomes have generated many notable discoveries17. Direct data on disease-genes are commonly derived from RNA-seq because it is superior to other high-throughput technologies, such as microarray in accuracy, dynamic range, and differential expression detection, and has nearly completely replaced microarray for conducting genetic tests. The entries curated in OMIM have referenced57–60 the results from RNA-seq, and NCBI27 online accepts RNA-seq data and shares it with other databases and researchers. In addition, the data in references2,5,8,9,13–17 in this study were primarily from RNA-seq. Furthermore, a combination61 of using RNA-seq approach with PPI network analysis generated that TNF had the largest number of connected edges in the PPI network for contusive SCI in a mouse model, and the top ranked genes in the SCI gene list overlapped considerable with ours, supporting our current study; however, our present method hardly describes the dynamic effects of GAS on SCI. On the other hand, notably, because of its pleiotropic role, TNF shows, for example, a positive effect on regulatory T cells62 and prevents neurons from death/apoptosis by activating NF-κB63,64; therefore, suppressing TNF overexpression might not be a desirable intervention for SCI therapy, and this needs to be observed further.
Furthermore, to more effectively predict the SCI drug targets, the patient-specific signaling networks for reactive inflammation from SCI could be constructed using the concept of “SCI hallmarks” based on individual genomic data and on regulatory functions, just as the signaling networks of “cancer hallmarks”13–17 have been developed and substantially used for revealing molecular mechanisms of cancers and drug targets. This proposed approach to analyses is also expected to be useful for studying neurotrophic factors and nerve growth factors after SCIs.
With a constantly expanding repertoire of techniques, including RNA-seq, together with new information on genes and proteins, the current results will have more possibilities for examination and modification and will advance the current approaches to SCI analysis.
Acknowledgements
This work was supported by the National Natural Sciences Foundation of China Grant No. 31370940.
Author Contributions
Conceptualization: W.Z., X.C. Formal analysis: W.Z., X.C. Investigation: W.Z., X.C., L.N., K.J. Methodology: W.Z., X.C., K.J. Project administration: W.Z. Writing – original draft: W.Z., X.C., L.N., K.J.
Data Availability
All data generated or analyzed during this study are included in this published article.
Competing Interests
The authors declare no competing interests.
Footnotes
Publisher’s note: Springer Nature remains neutral with regard to jurisdictional claims in published maps and institutional affiliations.
References
- 1.Zamanian JL, et al. Genomic analysis of reactive astrogliosis. J. Neurosci. 2012;32:6391–6410. doi: 10.1523/JNEUROSCI.6221-11.2012. [DOI] [PMC free article] [PubMed] [Google Scholar]
- 2.Liddelow SA, et al. Neurotoxic reactive astrocytes are induced by activated microglia. Nature. 2017;541:481–487. doi: 10.1038/nature21029. [DOI] [PMC free article] [PubMed] [Google Scholar]
- 3.Fawcett JW, Asher RA. The glial scar and central nervous system repair. Brain Res. Bull. 1999;49:77–391. doi: 10.1016/S0361-9230(99)00072-6. [DOI] [PubMed] [Google Scholar]
- 4.Silver J, Miller JH. Regeneration beyond the glial scar. Nat. Rev. Neurosci. 2004;5:146–156. doi: 10.1038/nrn1326. [DOI] [PubMed] [Google Scholar]
- 5.Anderson MA, et al. Astrocyte scar formation aids central nervous system axon regeneration. Nature. 2016;532:195–200. doi: 10.1038/nature17623. [DOI] [PMC free article] [PubMed] [Google Scholar]
- 6.Alizadeh A, Dyck SM, Kataria H. Neuregulin-1 positively modulates glial response and improves neurological recovery following traumatic spinal cord injury. GLIA. 2017;65:1152–1175. doi: 10.1002/glia.23150. [DOI] [PubMed] [Google Scholar]
- 7.Wu X, et al. RhoA/Rho Kinase mediates neuronal death through regulating cPLA2 activation. Mol. Neurobiol. 2017;54:6885–6895. doi: 10.1007/s12035-016-0187-6. [DOI] [PMC free article] [PubMed] [Google Scholar]
- 8.Liu G, et al. FK506 attenuates the inflammation in rat spinal cord injury by inhibiting the activation of NF-kappa B in microglia cells. Cell Mol. Neurobiol. 2017;37:843–855. doi: 10.1007/s10571-016-0422-8. [DOI] [PMC free article] [PubMed] [Google Scholar]
- 9.Shao A, et al. Hydrogen-rich saline attenuated subarachnoid hemorrhage-induced early brain injury in rats by suppressing inflammatory response: possible involvement of NF-kappa B pathway and NLRP3 inflammasome. Mol. Neurobiol. 2016;53:3462–3476. doi: 10.1007/s12035-015-9242-y. [DOI] [PubMed] [Google Scholar]
- 10.Zhong L, et al. Quantitative proteomics study of the neuroprotective effects of B12 on hydrogen peroxide-induced apoptosis in SH-SY5Y cells. Sci. Rep.-UK. 2016;6:22635. doi: 10.1038/srep22635. [DOI] [PMC free article] [PubMed] [Google Scholar]
- 11.D L Rivas J, Fontanillo C. Protein-protein interactions essentials: key concepts to building and analyzing interactome networks. PLoSComput. Biol. 2010;6:e1000807. doi: 10.1371/journal.pcbi.1000807. [DOI] [PMC free article] [PubMed] [Google Scholar]
- 12.Barabási AL, Oltvai ZN. Network biology: understanding the cell’s functional organization. Nat. Rev. Genet. 2004;5:101–113. doi: 10.1038/nrg1272. [DOI] [PubMed] [Google Scholar]
- 13.Han P, Gopalakrishnan C, Yu H, Wang E. Gene regulatory network rewiring in the immune cells associated with cancer. Genes. 2017;2017(8):308. doi: 10.3390/genes8110308. [DOI] [PMC free article] [PubMed] [Google Scholar]
- 14.McGee SR, Tibiche C, Mark Trifiro M, Wang E. Network analysis reveals a signaling regulatory loop in PIK3CA-mutated breast cancer predicting survival outcome. Genomics Proteomics & Bioinformatics. 2017;15:121–129. doi: 10.1016/j.gpb.2017.02.002. [DOI] [PMC free article] [PubMed] [Google Scholar]
- 15.Wang E, et al. Predictive genomics: A cancer hallmark network framework for predicting tumor clinical phenotypes using genome sequencing data. Semin. Cancer Biol. 2015;30:4–12. doi: 10.1016/j.semcancer.2014.04.002. [DOI] [PubMed] [Google Scholar]
- 16.Zaman N, et al. Signaling network assessment of mutations and copy number variations predict breast cancer subtype-specific drug targets. Cell Rep. 2013;5:216–223. doi: 10.1016/j.celrep.2013.08.028. [DOI] [PubMed] [Google Scholar]
- 17.Wang E. Understanding genomic alterations in cancer genomes using an integrative network approach. Cancer Lett. 2013;340:261–269. doi: 10.1016/j.canlet.2012.11.050. [DOI] [PubMed] [Google Scholar]
- 18.Singh S, Li SS. Phthalates: toxicogenomics and inferred human diseases. Genomics. 2011;97:148–157. doi: 10.1016/j.ygeno.2010.11.008. [DOI] [PubMed] [Google Scholar]
- 19.Lin YC, Wang CC, Tung CW. An in silicotoxicogenomics approach for inferring potential diseases associated with maleic acid. Chem. Biol. Interact. 2014;223:38–44. doi: 10.1016/j.cbi.2014.09.004. [DOI] [PubMed] [Google Scholar]
- 20.Amberger JS, Bocchini CA, Schiettecatte F, Scott AF, Hamosh A. OMIM.org: Online Mendelian Inheritance in Man (OMIM®), an online catalog of human genes and genetic disorders. Nucleic Acids Res. 2015;43(Database issue):D789–798. doi: 10.1093/nar/gku1205. [DOI] [PMC free article] [PubMed] [Google Scholar]
- 21.Kanehisa M, et al. KEGG for linking genomes to life and the environment. Nucleic Acids Res. 2008;36:D480–484. doi: 10.1093/nar/gkm882. [DOI] [PMC free article] [PubMed] [Google Scholar]
- 22.Szklarczyk D, et al. STRING v10: protein-protein interaction networks, integrated over the tree of life. Nucleic Acids Res. 2015;43(Database issue):D447–452. doi: 10.1093/nar/gku1003. [DOI] [PMC free article] [PubMed] [Google Scholar]
- 23.STRING database homepage, https://string-db.org/ (2017).
- 24.Davis AP, Wiegers TC, Rosenstein MC, Mattingly CJ. MEDIC: a practical disease vocabulary used at the Comparative Toxicogenomics Database. Database. 2012;2012:1–9. doi: 10.1093/database/bar065. [DOI] [PMC free article] [PubMed] [Google Scholar]
- 25.Davis AP, et al. The comparative toxicogenomics database: update 2013. Nucleic Acids Res. 2013;41:D1104–1114. doi: 10.1093/nar/gks994. [DOI] [PMC free article] [PubMed] [Google Scholar]
- 26.Comparative Toxicogenomics Database homepage, http://ctdbase.org/ (2017).
- 27.National Center for Biotechnology Information homepage. https://www.ncbi.nlm.nih.gov (2018).
- 28.Kolb WP, Granger GA. Lymphocyte in vitro cytotoxicity: characterization of human lymphotoxin. Proc. Natl. Acad. Sci. USA. 1968;61(4):1250–1255. doi: 10.1073/pnas.61.4.1250. [DOI] [PMC free article] [PubMed] [Google Scholar]
- 29.Subramanian A, et al. Gene set enrichment analysis: A knowledge-based approach for interpreting genome-wide expression profiles. PNAS. 2005;102:15545–15550. doi: 10.1073/pnas.0506580102. [DOI] [PMC free article] [PubMed] [Google Scholar]
- 30.Pathan M, et al. Funrich: An open access standalone functional enrichment and interaction network analysis tool. Proteomics. 2015;15:2597–601. doi: 10.1002/pmic.201400515. [DOI] [PubMed] [Google Scholar]
- 31.Ashburner M, et al. Gene ontology: tool for the unification of biology. The Gene Ontology Consortium. Nat. Genet. 2000;25:25–29. doi: 10.1038/75556. [DOI] [PMC free article] [PubMed] [Google Scholar]
- 32.Gene ontology homepage, http://www.geneontology.org/
- 33.Shannon P, Markiel A, Ozier O. Cytoscape: A Software environment for integrated models of biomolecular interaction networks. Genome Res. 2003;13:2498–2504. doi: 10.1101/gr.1239303. [DOI] [PMC free article] [PubMed] [Google Scholar]
- 34.Cytoscape homepage. http://www.cytoscape.org/ (2017).
- 35.Doncheva NT, Assenov Y, Domingues FS, Albrecht M. Topological analysis and interactive visualization of biological networks and protein structures. Nat. Protoc. 2012;7:670–685. doi: 10.1038/nprot.2012.004. [DOI] [PubMed] [Google Scholar]
- 36.Tung CW. PupDB: a database of pupylated proteins. BMC Bioinformatics. 2012;13:40. doi: 10.1186/1471-2105-13-40. [DOI] [PMC free article] [PubMed] [Google Scholar]
- 37.Maere S, Heymans K, Kuiper M. Bioinformatics. 2005. BiNGO: a Cytoscape plugin to assess over representation of Gene Ontology categories in biological networks; pp. 3448–3449. [DOI] [PubMed] [Google Scholar]
- 38.Omicsbean Platform, http://www.omicsbean.com:88/ (2017).
- 39.Croft D, et al. Reactome: a database of reactions, pathways and biological processes. Nucleic Acids Res. 2011;39:D691–697. doi: 10.1093/nar/gkq1018. [DOI] [PMC free article] [PubMed] [Google Scholar]
- 40.Coletti MH, Bleich HL. Medical subject headings used to search the biomedical literature. J. Am. Med. Inform. Assoc. 2001;8:317–323. doi: 10.1136/jamia.2001.0080317. [DOI] [PMC free article] [PubMed] [Google Scholar]
- 41.Albert R, Barabási AL. Statistical mechanics of complex networks. Rev. Mod. Phys. 2002;74:47–97. doi: 10.1103/RevModPhys.74.47. [DOI] [Google Scholar]
- 42.Assenov Y, Ramirez F, Schelhorn SE, Lengauer T, Albrecht M. Computing topological parameters of biological networks. Bioinformatics. 2008;24:282–284. doi: 10.1093/bioinformatics/btm554. [DOI] [PubMed] [Google Scholar]
- 43.Zotenko E, Mestre J, O’Leary DP, Przytycka TM. Why do hubs in the yeast protein interaction network tend to be essential: reexamining the connection between the network topology and essentiality. Plos Comput. Biol. 2008;4:e1000140. doi: 10.1371/journal.pcbi.1000140. [DOI] [PMC free article] [PubMed] [Google Scholar]
- 44.Cohen R, Havlin S. Scale-free networks are ultrasmall. Phys. Rev. Lett. 2003;90:058701. doi: 10.1103/PhysRevLett.90.058701. [DOI] [PubMed] [Google Scholar]
- 45.Kulp A, Kuehn MJ. Biological functions and biogenesis of secreted bacterial outer membrane vesicles. Annu. Rev. Microbiol. 2010;64:163–184. doi: 10.1146/annurev.micro.091208.073413. [DOI] [PMC free article] [PubMed] [Google Scholar]
- 46.Zarifkar A, et al. Agmatine prevents LPS-induced spatial memory impairment and hippocampal apoptosis. Eur. J. Pharmacol. 2010;634:84–88. doi: 10.1016/j.ejphar.2010.02.029. [DOI] [PubMed] [Google Scholar]
- 47.Hauss-Wegrzyniak B, Lynch MA, Vraniak PD, Wenk GL. Chronic brain inflammation results in cell loss in the entorhinal cortex and impaired LTP in perforant path-granule cell synapses. Exp. Neurol. 2002;176:336–341. doi: 10.1006/exnr.2002.7966. [DOI] [PubMed] [Google Scholar]
- 48.Zoraghi R, Reiner NE. Protein interaction networks as starting points to identify novel antimicrobial drug targets. Curr.Opin.Microbiol. 2013;16:566–572. doi: 10.1016/j.mib.2013.07.010. [DOI] [PubMed] [Google Scholar]
- 49.Pagni CA, Zenga. F. Posttraumatic epilepsy with special emphasis on prophylaxis and prevention. ActaNeurochir.Supplementum. 2005;93:27–34. doi: 10.1007/3-211-27577-0_3. [DOI] [PubMed] [Google Scholar]
- 50.Garga N, Lowenstein DH. Posttraumatic Epilepsy: A Major problem in desperate need of major advances. Epilepsy Curr. 2006;6:1–5. doi: 10.1111/j.1535-7511.2005.00083.x. [DOI] [PMC free article] [PubMed] [Google Scholar]
- 51.Pitkänen A, Kharatishvili I, Karhunen H. Epileptogenesis in experimental models. Epilepsia. 2007;48(Supplement 2):13–20. doi: 10.1111/j.1528-1167.2007.01063.x. [DOI] [PubMed] [Google Scholar]
- 52.Clancy RR, Sladky JT, Rorke LB. Hypoxic-ischemic spinal cord injury following perinatal asphyxia. Ann. Neurol. 1989;25:185–189. doi: 10.1002/ana.410250213. [DOI] [PubMed] [Google Scholar]
- 53.De Louw AJA, et al. Apoptosis in the rat spinal cord during postnatal development; the effect of perinatal asphyxia on programmed cell death. Neuroscience. 2002;112:751–758. doi: 10.1016/S0306-4522(02)00134-3. [DOI] [PubMed] [Google Scholar]
- 54.Abematsu M, et al. Neurons derived from transplanted neural stem cells restore disrupted neuronal circuitry in a mouse model of spinal cord injury. J. Clin. Invest. 2010;120:3255–3266. doi: 10.1172/JCI42957. [DOI] [PMC free article] [PubMed] [Google Scholar]
- 55.Amberger J, Bocchini C, Hamosh A. A new face and new challenges for Online Mendelian Inheritance in Man (OMIM®) Hum. Mutat. 2011;32:564–567. doi: 10.1002/humu.21466. [DOI] [PubMed] [Google Scholar]
- 56.Sun, K., Goncalves, J. P., Larminie, C. & Pržulj, N. Predicting disease associations via biological network analysis. BMC Bioinformatics15, 304, http://www.biomedcentral.com/1471-2105/15/304 (2014). [DOI] [PMC free article] [PubMed]
- 57.Zhang L, et al. Microenvironment-induced PTEN loss by exosomal microRNA primes brain metastasis outgrowth. Nature. 2015;527:100–104. doi: 10.1038/nature15376. [DOI] [PMC free article] [PubMed] [Google Scholar]
- 58.Zhao D, et al. Synthetic essentiality of chromatin remodelling factor CHD1 in PTEN-deficient cancer. Nature. 2017;542:484–488. doi: 10.1038/nature21357. [DOI] [PMC free article] [PubMed] [Google Scholar]
- 59.Kuchay S, et al. PTEN counteracts FBXL2 to promote IP3R3- and Ca(2+)-mediated apoptosis limiting tumour growth. Nature. 2017;546:554–558. doi: 10.1038/nature22965. [DOI] [PMC free article] [PubMed] [Google Scholar]
- 60.Poliseno L, et al. A coding-independent function of gene and pseudogene mRNAs regulates tumour biology. Nature. 2010;465:1033–1038. doi: 10.1038/nature09144. [DOI] [PMC free article] [PubMed] [Google Scholar]
- 61.Chen K, et al. RNA-Seq characterization of spinal cord injury transcriptome in acute/subacute phases: a resource for understanding the pathology at the systems level. Plos One. 2013;8:e72567. doi: 10.1371/journal.pone.0072567. [DOI] [PMC free article] [PubMed] [Google Scholar]
- 62.Salomon BL, et al. Tumor Necrosis Factor α and Regulatory T Cells in Oncoimmunology. Front. Immunol. 2018;9:444. doi: 10.3389/fimmu.2018.00444. [DOI] [PMC free article] [PubMed] [Google Scholar]
- 63.Barger SW, et al. Tumor necrosis factors alpha and beta protect neurons against amyloid beta-peptide toxicity: evidence for involvement of a kappa B-binding factor and attenuation of peroxide and Ca2+ accumulation. Proc. Natl. Acad. Sci. USA. 1995;92:9328–9332. doi: 10.1073/pnas.92.20.9328. [DOI] [PMC free article] [PubMed] [Google Scholar]
- 64.Mattson MP, Meffert MK. Roles for NF-κB in nerve cell survival, plasticity, and disease. Cell Death Differ. 2006;13:852–860. doi: 10.1038/sj.cdd.4401837. [DOI] [PubMed] [Google Scholar]
Associated Data
This section collects any data citations, data availability statements, or supplementary materials included in this article.
Data Availability Statement
All data generated or analyzed during this study are included in this published article.