Abstract
Tau PET imaging has potential for elucidating changes in the deposition of neuropathological tau aggregates that are occurring during the progression of Alzheimer disease (AD). This work investigates in vivo kinetics, quantification strategies, and imaging characteristics of a novel tau PET radioligand 18F-MK-6240 in humans. Methods: Fifty-one individuals ranging from cognitively normal young controls to persons with dementia underwent T1-weighted MRI as well as 11C-PiB and 18F-MK-6240 PET imaging. PET data were coregistered to the MRI, and time–activity curves were extracted from regions of interest to assess 18F-MK-6240 kinetics. The pons and inferior cerebellum were investigated as potential reference regions. Reference tissue methods (Logan graphical analysis [LGA] and multilinear reference tissue method [MRTM2]) were investigated for quantification of 18F-MK-6240 distribution volume ratios (DVRs) in a subset of 19 participants. Stability of DVR methods was evaluated using truncated scan durations. SUV ratio (SUVR) estimates were compared with DVR estimates to determine the optimal timing window for SUVR analysis. Parametric SUVR images were used to identify regions of potential off-target binding and to compare binding patterns with neurofibrillary tau staging established in neuropathology literature. Results: SUVs in the pons and the inferior cerebellum indicated consistent clearance across all 51 subjects. LGA and MRTM2 DVR estimates were similar, with LGA slightly underestimating DVR compared with MRTM2. DVR estimates remained stable when truncating the scan duration to 60 min. SUVR determined 70–90 min after injection of 18F-MK-6240 indicated linearity near unity when compared with DVR estimates and minimized potential spill-in from uptake outside the brain. 18F-MK-6240 binding patterns in target regions were consistent with neuropathological neurofibrillary tau staging. Off-target binding regions included the ethmoid sinus, clivus, meninges, substantia nigra, but not the basal ganglia or choroid plexus. Conclusion: 18F-MK-6240 is a promising PET radioligand for in vivo imaging of neurofibrillary tau aggregates in AD with minimal off-target binding in the human brain.
Keywords: tau, positron emission tomography, Alzheimer’s disease, quantification, MK-6240
Neurofibrillary tau tangles (NFTs) and β-amyloid (Aβ) plaques are neuropathological hallmarks of AD that accumulate decades before neurodegeneration and symptomatic onset of disease (1–3). Neuropathological staging of NFTs and Aβ plaques suggests that these protein aggregates follow hierarchical spatiotemporal patterns during the AD progression that are indicative of disease severity. Specific to tau, neuropathological staining in predetermined slices indicates NFTs are first observed in the transentorhinal cortex (Braak stage I), followed by the hippocampus (stage II), and then spread laterally to the inferior temporal cortex (stage III) and subsequently spread throughout the neocortex in an ordered pattern (stages IV–VI) (4). In vivo biomarker studies evaluating Aβ and tau are mostly consistent with postmortem findings and suggest a temporal biomarker cascade that putatively begins with detectable Aβ accumulation, followed by tau aggregation and ultimately neurodegeneration and deficits in cognition (5–7). Recently, cross-sectional analyses of Aβ and tau PET imaging have indicated these biomarkers follow hierarchical patterns that may be useful for in vivo disease staging (7,8). Characterization of the temporal sequencing of the biomarker cascade shows promise for predicting future cognitive decline, particularly at the patient level, which could dramatically improve late-life planning and outcomes of clinical prevention trials (9).
Starting in 2013 PET ligands for detecting NFTs have undergone rapid development (10). Initial tau PET imaging studies have indicated approximate concordance between in vivo imaging (11–13) and hierarchical patterns observed in neuropathological staging of NFTs. These studies also demonstrate relationships between tracer-specific binding and various measures of cognition, neurodegeneration, and delineation of clinical groups. These early results suggest tau PET imaging will play a critical role in disentangling the complex interactions between Aβ, neurofibrillary tau, neurodegeneration, and their impact on cognition and late-stage disease outcomes (14). Although these studies highlight the promise for tau imaging, they primarily focus on comparing clinically impaired individuals with cognitively healthy controls and do not address the potential of these ligands for identifying tau in early-stage disease where disease intervention is likely to be more effective. Additionally, some tau PET ligands have suffered from lack of specificity for tau (THK series) (15,16), nonpolar radiometabolites (PBB3) (17), and off-target binding that interferes with regions of interest for monitoring early-stage tau deposition such as the hippocampus (AV-1451 and THK series) (12). Recently, 18F-MK-6240 has shown high in vitro affinity for NFTs and no in vivo off-target binding in the basal ganglia in nonhuman primates (18). These preclinical results indicate 18F-MK-6240 has potential for selective imaging of AD tau aggregates in humans and may be more sensitive for detecting tau in regions associated with early NFT deposition (i.e., early Braak regions). The central aims of this work were to evaluate the in vivo pharmacokinetics, investigate dynamic and static reference tissue methods for quantification of specific binding, characterize the in vivo spatial distribution of binding related to tau, and identify regions of potential off-target binding of 18F-MK-6240 in humans ranging from cognitively unimpaired young adults to clinically diagnosed probable AD.
MATERIALS AND METHODS
Participants and Recruitment
Participants (n = 51) were recruited from the University of Wisconsin–Madison Alzheimer’s Disease Research Center and its affiliated clinics or the Wisconsin Registry for Alzheimer’s Prevention (19), a longitudinal study following late-middle-aged individuals enriched for AD risk. AD dementia individuals were determined on the basis of clinical diagnosis of probable AD (diagnosis was not informed by AD biomarkers). All other participants were grouped as young controls (27–45 y), older controls, cognitive decliners, and mild cognitive impairment (MCI). The latter 3 diagnoses were based on longitudinal neuropsychological evaluation and consensus diagnosis (19). Descriptive statistics for the groups are summarized in Table 1. Written informed consent was obtained from all individuals before participation. This study was conducted under the University of Wisconsin–Madison Institutional Review Board and the Federal Drug Administration Investigational New Drug mechanism for 18F-MK-6240 and 11C-PiB PET studies. No adverse events were reported for administration of 18F-MK-6240.
TABLE 1.
Descriptive Statistics for Study Participants
| Group | Age (y) | Sex | APOE-ε4 carriers | MMSE/MoCA | PiB(+) | Clinical disease duration (mo) |
| Young controls (n = 3) | 35 ± 9, 27–45 | 1 F, 2 M | NA | NA | NA | |
| Older controls (n = 33) | 67 ± 5, 56–77 | 20 F, 13 M | 14 | 29 ± 0.8 | 7 | |
| Cognitive decliners (n = 6) | 65 ± 2, 61–68 | 4 F, 2 M | 4 | 28 ± 1 | 3 | |
| MCI (n = 2) | 69 ± 10 | 1 F, 1 M | 2 | 26 ± 2 | 1 | 39 ± 52 |
| Probable AD (n = 7) | 73 ± 3, 67–79 | 2 F, 5 M | 2 (2 NA) | 17 ± 2 | 5 | 53 ± 35 |
| Total (n = 51) | 66 ± 10, 27–79 | 28 F, 23 M | 22 (5 NA) | 16 (3 NA) |
NA = not available.
MMSE = Mini–Mental State Examination; MoCA = Montreal Cognitive Assessment; F = females; M = males.
Data are reported as the mean ± SD and additionally with the range for age.
MRI and Anatomic Delineation
All participants underwent a T1-weighted 3-dimensional inversion recovery fast spoiled gradient-echo sequence on a 3T MRI scanner (Signa 750; GE Healthcare) with a 32-channel head coil (inversion time, 450 ms; repetition time, 8.1 ms; echo time, 3.2 ms; flip angle, 12°; matrix, 256 × 256 × 156; voxel dimensions, 1 × 1 × 1 mm; field of view, 256 mm; slice thickness, 1.0 mm). The T1-weighted image was corrected for magnetic field inhomogeneity (SPM12) and tissue class segmented for white matter, gray matter (GM), and cerebrospinal fluid. The deformation field obtained from the tissue-class segmentation was used to inverse warp regions of interest (ROIs) from MNI template space to native MRI space.
Radiochemical Synthesis
11C-PiB
Radiochemical synthesis of 11C-PiB was performed as previously described (20), yielding a specific activity of 650 ± 161 MBq/nmol (mean ± SD, n = 48).
18F-MK-6240
18F-MK-6240 was synthesized in a manner similar to previously reported methods (18) with modifications to improve 18F-MK-6240 radiochemical yield and automated using a Sofie ELIXYS (21) and a computer-controlled fraction collection, solid-phase extraction, and formulation module previously validated for human use (22). 18F-Fluoride was isolated from bulk target 18O-water (98% enrichment) after cyclotron irradiation (∼20 μA⋅h) using an anion exchange column (QMA Accell Plus Light) eluted with 0.8 mL 80/20 acetonitrile/water with 5.6 mg 4,7,13,16,21,24-hex-aoxa-1,10-diazabicyclo[8.8.8]hexacosane (Kryptofix 222) and 1.7 mg potassium carbonate and rinsed with 0.8 mL anhydrous acetonitrile. After 3 times azeotropic distillation of the 18F-KF solution (110°C), 1.0 mg MK-6420 precursor dissolved in 650 μL anhydrous dimethyl sulfoxide was added and heated at 140°C for 10 min. Reaction product was hydrolyzed (3N HCl, 8 min at 90°C) and neutralized with 2.85 mL sodium hydroxide and underwent solid-phase extraction (diluted with 2 mL deionized water, tC18 Sep-Pak Plus Light, rinsed with 6 mL deionized water, eluted with 1.15 mL ethanol). The eluate from solid-phase extraction was diluted in 1.15 mL 10 mM sodium acetate and was purified via semipreparative high-performance liquid chromatography (Gemini 5 μm C6-phenyl 110 Å 250 × 10 mm, 45/55 ethanol/10 mM sodium acetate, 3–4 mL/min). The 18F-MK-6240 fraction was collected in a bottle containing 35 mL sterile water for injection, USP, and underwent solid-phase extraction (tC18 Sep-Pak Plus Short, rinsed with 15 mL sterile water for injection, USP, eluted with 1 mL dehydrated ethanol). The eluate was diluted in 9 mL bacteriostatic 0.9% sodium chloride for injection, USP, and was 0.22 μm filtered and collected in a vented 10-mL sterile empty vial. A summary of radiochemistry results for 18F-MK-6240 syntheses can be found in Table 2.
TABLE 2.
Summary Statistics for 18F-MK-6240 Radiochemical Syntheses and PET Radiotracer Injection
| Metric (n = 51) | Mean ± SD |
| Specific activity (MBq/nmol) | 852 ± 375 |
| NDC yield (%) | 12.5 ± 4.0 |
| Synthesis time (min) | 101 ± 13 |
| Injected activity (MBq) | 393 ± 7 |
| Injected mass (nmol) | 0.69 ± 0.28 (range, 0.25–1.59) |
NDC = non–decay corrected.
PET Imaging
PET scans were acquired using a Siemens ECAT EXACT HR+ tomograph.
11C-PiB
Dynamic 11C-PiB scans were acquired from 0 to 70 min after a nominal 555-MBq injection for all participants except young controls, who were assumed to be devoid of Aβ pathology based on their age (3). DVRs (LGA, cerebellar GM reference region) were estimated (20), and a global DVR threshold (23) was used to ascertain PiB status (PiB-positive [PiB(+)] or PiB-negative [PiB(−)]) for descriptive purposes.
18F-MK-6240
A total of 51 participants underwent 18F-MK-6240 PET scans after a nominal 370-MBq injection. A subset of 19 participants (3 young controls, 6 older controls, 2 cognitive decliners, 1 MCI, 7 probable AD) were scanned dynamically from bolus tracer injection for a total duration of either 90, 105, or 120 min. The remaining 32 participants were scanned for 60 min after a 60-min uptake period. 18F-MK-6240 PET images were reconstructed using optimized subset expectation maximization (ECAT, version 7.2.2; 4 iterations; 16 subset; brain mode on; ramp filter; voxel size, 2.57 × 2.57 × 2.425 mm; matrix size, 128 × 128 × 63; corrections applied: segmented attenuation, detector deadtime, scatter, detector normalization and radioisotope decay).
Data Extraction, Quantification, and Analysis of Simplified Methods
The reconstructed 18F-MK-6240 PET time series was interframe realigned and coregistered to T1-weighted MRI (SPM12). HighlY constrained backPRojection–Local Reconstruction denoising (24) was applied in native PET space to the realigned PET scans with full dynamic data used for DVR analysis. Parametric 18F-MK-6240 SUV ratio (SUVR = C(t)/Cref(t)) images were generated using data from 70 to 90 min after injection (Cref, inferior cerebellar GM reference region). 18F-MK-6240 time–activity curves were extracted from the coregistered PET time series in native T1 space. Pons and off-target ROIs were delineated in Montreal Neurological Institute (MNI) space on the basis of an in-depth imaging review of 18F-MK-6240 parametric SUVR images in individual cases and SUVR images averaged across control subjects. Additionally, an inferior cerebellar ROI was generated for reference region analysis by combining Automated Anatomic Labeling (AAL, Neurodegenerative Diseases Institute, Université de Bordeaux) ROIs (93,94,101–104) in native T1 space and eroding the mask to limit spill-in from adjacent white matter and cerebral spinal fluid. The inferior cerebellum (henceforth referred to as “cerebellum”) was used, as opposed to the entire cerebellar GM, because of focal binding observed in the superior cerebellum and the adjacent tentorium cerebelli, and to avoid contamination from occipital cortex spillover observed in AD participants with high occipital retention. Brain penetrance and evaluation of reference regions (cerebellum and pons) was performed by comparing the SUV (SUV = CPET/ID × mass) across all subjects. DVRs were determined at the ROI level using reference tissue LGA (25) and MRTM2 (26) for all participants with full dynamic acquisitions (n = 19). LGA and MRTM2 were chosen as they are amenable to generation of parametric images for voxelwise analyses. LGA and MRTM2 fitting times (t*) were determined by comparing DVR estimates using stepwise t* values (Bland–Altman plots). The stability of the DVR as a function of scan duration was evaluated within each method by regressing DVR estimates derived from truncated data (i.e., shorter scans) onto DVRs derived from full-length scans. SUVRs derived from stepwise 20-min windows starting 40 min after injection were regressed onto LGA and MRTM2 DVR to assess the quantitative accuracy of SUVR.
ROIs consisted of the AAL atlas, which was restricted to voxels with GM probabilities greater than 30 percent, and manually segmented ROIs drawn in MNI space in regions with apparent off-target binding. Regions for regression analyses included all AAL ROIs (n = 90) except cerebellar regions and also did not include the manually segmented off-target ROIs. This was done to capture the full range of binding observed in this study throughout the entire brain.
18F-MK-6240 Image Review
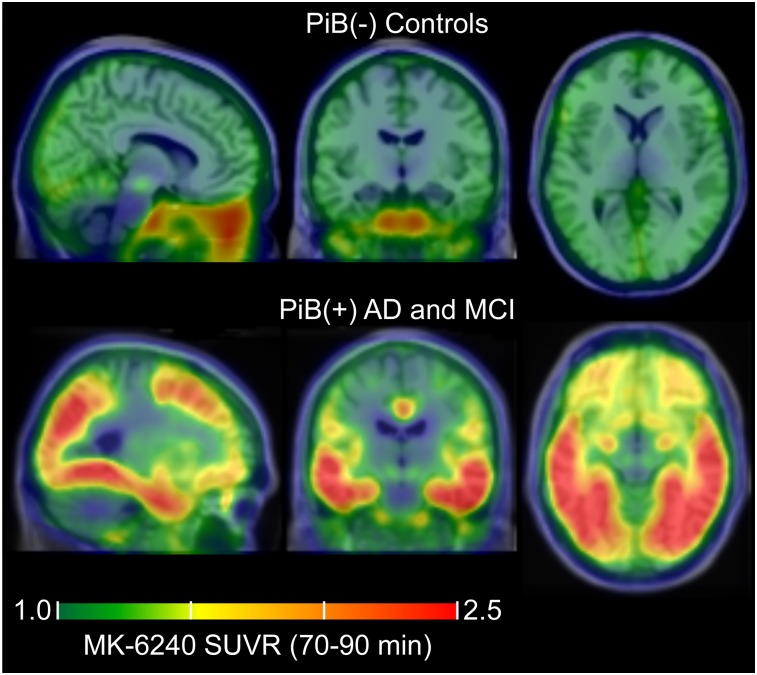
Individual parametric 18F-MK-6240 SUVR images were reviewed to identify regions of potential off-target binding (not consistent with neuropathology literature) and tau-specific binding (consistent with neuropathology literature) by consensus of a neuroradiologist and experienced neuroimagers blinded to amyloid imaging, cognitive trajectory, and clinical group. Additionally, 18F-MK-6240 parametric images normalized to MNI space were averaged for PiB(−) controls and PiB(+) AD and MCI cases to aid in the identification of common off-target binding regions and off-target ROI delineation.
RESULTS
Reference Region Evaluation
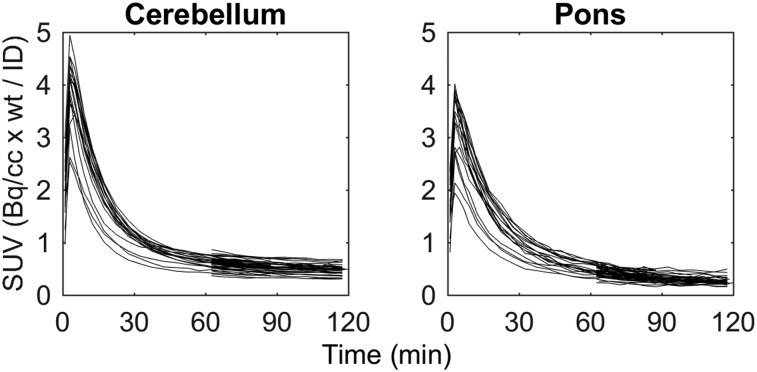
SUV time–activity curves indicated consistent washout across all 51 subjects in the cerebellum and the pons (Fig. 1) and brain penetrance similar to other PET radioligands (peak SUV, ∼2.5–5). The cerebellum was used as reference region for the remainder of the analyses because of the larger ROI volume (17.1 ± 3.8 vs. 2.2 ± 0.4 cm3) and previous validation with other tau PET radioligands (27,28).
FIGURE 1.
18F-MK-6240 SUV time–activity curves of all 51 participants in the cerebellum (left) and the pons (right). No individuals had evidence of specific binding in either ROI.
Pharmacokinetic Evaluation of 18F-MK-6240
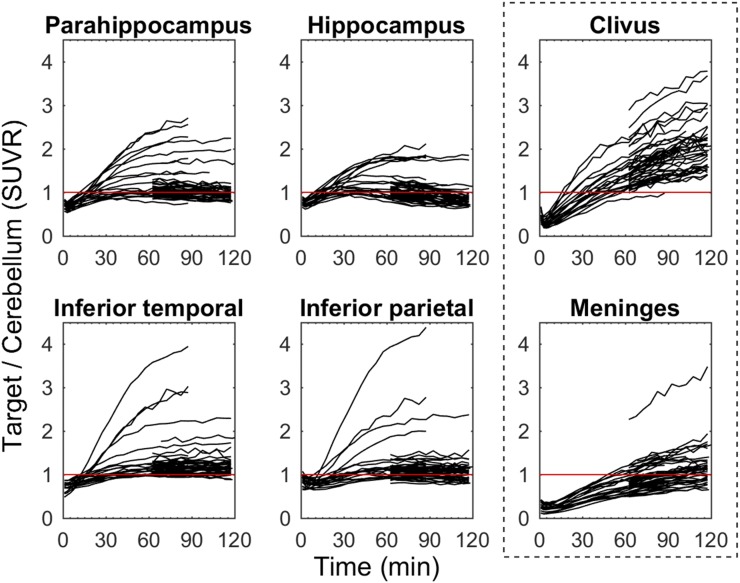
Target-to-cerebellum time–activity curves (Fig. 2) plateaued around 70 min after injection for moderate-binding subjects and regions, but were still increasing at 90 min in neocortical regions of the highest binding AD subjects (SUVR > 3). Time–activity curves relative to cerebellum in off-target regions that included bone marrow (ethmoid sinus, clivus, sphenotemporal buttress) were increasing throughout the entire 120-min scan duration (Fig. 2) and had SUVRs similar to the parahippocampus and the inferior temporal gyrus of PiB(+) AD and MCI individuals around 90 min. Similarly, time–activity curves in the meninges relative to cerebellum were increasing throughout the entire 120-min scan and varied considerably in magnitude across subjects (SUVR, 0.5–3.5 at 120 min). High meninges binding was more frequent in individuals who did not exhibit specific binding in NFT-associated regions.
FIGURE 2.
18F-MK-6240 target-to-cerebellum ratio time–activity curves for regions associated with tau pathology (left 2 columns) and regions with off-target binding (outlined right column) for all 51 participants. Red line indicates an SUVR = 1.
Quantification of 18F-MK-6240 Specific Binding
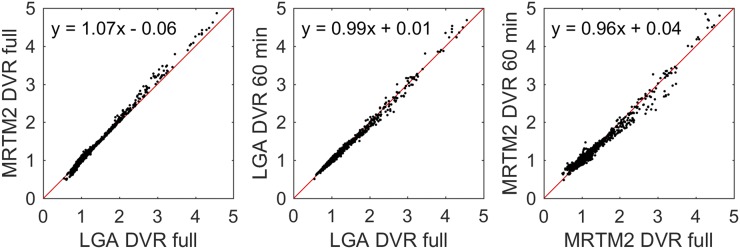
The initial fitting times (t*) for LGA (k2 = 0.04 min−1, based on median MRTM2 estimates) and MRTM2 were 35 and 30 min, respectively. Regression (Table 3) of MRTM2 onto LGA DVR using the full dynamic scan duration was near unity (Fig. 3), with LGA slightly underestimating MRTM2 DVR. Regression outcomes were similar when regions with DVR values less than 1.3 were removed from the regression analysis. When the dynamic scan duration was shortened, DVR estimates remained stable down to 60 min for LGA and 70 min for MRTM2, with lower intramethod variability for LGA than for MRTM2 for the same scan durations.
TABLE 3.
Summary of Regression Statistics for Comparisons of DVR Methods (Top Row), DVR Using Shortened Scan Durations (Rows 2–9), and DVR with Stepwise SUVR (Rows 10–17)
| Regression | Coefficient | β− (SE) | 95% confidence interval | R2 |
| MRTM2 vs. LGA DVR | Slope | 1.066 (0.002) | 1.062 to 1.069 | 0.995 |
| Intercept | −0.060 (0.002) | −0.064 to −0.055 | ||
| LGA DVR (50 min vs. full) | Slope | 0.976 (0.003) | 0.970 to 0.983 | 0.981 |
| Intercept | 0.019 (0.004) | 0.012 to 0.028 | ||
| LGA DVR (60 min vs. full) | Slope | 0.986 (0.002) | 0.982 to 0.990 | 0.992 |
| Intercept | 0.010 (0.003) | 0.005 to 0.016 | ||
| LGA DVR (70 min vs. full) | Slope | 0.987 (0.001) | 0.984 to 0.989 | 0.997 |
| Intercept | 0.010 (0.002) | 0.007 to 0.013 | ||
| LGA DVR (80 min vs. full) | Slope | 0.991 (0.001) | 0.990 to 0.992 | 0.999 |
| Intercept | 0.008 (0.001) | 0.007 to 0.010 | ||
| MRTM2 DVR (50 min vs. full) | Slope | 0.841 (0.004) | 0.834 to 0.848 | 0.966 |
| Intercept | 0.147 (0.005) | 0.138 to 0.157 | ||
| MRTM2 DVR (60 min vs. full) | Slope | 0.958 (0.004) | 0.951 to 0.966 | 0.974 |
| Intercept | 0.040 (0.005) | 0.031 to 0.050 | ||
| MRTM2 DVR (70 min vs. full) | Slope | 0.951 (0.002) | 0.947 to 0.955 | 0.993 |
| Intercept | 0.051 (0.002) | 0.046 to 0.056 | ||
| MRTM2 DVR (80 min vs. full) | Slope | 0.964 (0.002) | 0.959 to 0.968 | 0.991 |
| Intercept | 0.040 (0.003) | 0.034 to 0.045 | ||
| SUVR (40–60) vs. LGA (full) | Slope | 0.814 (0.004) | 0.806 to 0.822 | 0.96 |
| Intercept | 0.245 (0.005) | 0.235 to 0.255 | ||
| SUVR (50–70) vs. LGA (full) | Slope | 0.934 (0.004) | 0.926 to 0.941 | 0.971 |
| Intercept | 0.131 (0.005) | 0.122 to 0.141 | ||
| SUVR (60–80) vs. LGA (full) | Slope | 1.014 (0.004) | 1.006 to 1.022 | 0.972 |
| Intercept | 0.048 (0.005) | 0.038 to 0.058 | ||
| SUVR (70–90) vs. LGA (full) | Slope | 1.073 (0.005) | 1.064 to 1.082 | 0.970 |
| Intercept | −0.015 (0.006) | −0.026 to −0.004 | ||
| SUVR (40–60) vs. MRTM2 (full) | Slope | 0.757 (0.004) | 0.748 to 0.766 | 0.947 |
| Intercept | 0.299 (0.006) | 0.288 to 0.310 | ||
| SUVR (50–70) vs. MRTM2 (full) | Slope | 0.869 (0.004) | 0.861 to 0.878 | 0.960 |
| Intercept | 0.192 (0.006) | 0.181 to 0.203 | ||
| SUVR (60–80) vs. MRTM2 (full) | Slope | 0.945 (0.004) | 0.937 to 0.954 | 0.964 |
| Intercept | 0.112 (0.006) | 0.101 to 0.123 | ||
| SUVR (70–90) vs. MRTM2 (full) | Slope | 1.002 (0.005) | 0.993 to 1.011 | 0.964 |
| Intercept | 0.052 (0.006) | 0.040 to 0.063 |
Regressions included all noncerebellar AAL regions of interest (n = 90) and all participants with full dynamic data available (n = 19). Full indicates that entire dynamic scan duration (90, 105, or 120 min) was used for DVR estimation.
FIGURE 3.
Comparison of 18F-MK-6240 DVR estimates using MRTM2 and LGA (left) using full dynamic time series (90, 105, or 120 min), and LGA (middle) and MRTM2 (right) DVR estimates using shortened 60-min dynamic scans compared with their corresponding full dynamic estimates. Red lines indicate unity (slope = 1, intercept = 0).
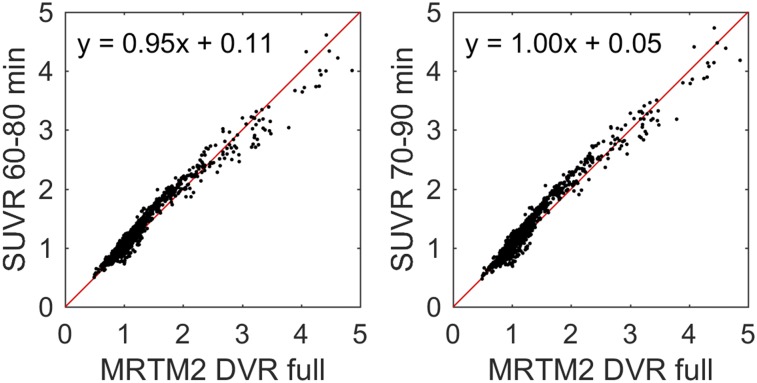
Regression of SUVR onto DVR for 20-min scans beginning 60 or 70 min after injection (Fig. 4) indicated regression outcomes near unity (Table 3) with SUVR underestimating DVR (LGA and MRTM2) for 20-min windows starting earlier than 60 min. Plots of SUVR onto DVR appeared bilinear, with values around 1 having a different slope than values above approximately 1.5 DVR. Fitting parameters closest to unity between SUVR and MRTM2 were chosen as the criteria for the timing window (70–90 min) used for parametric SUVR image generation.
FIGURE 4.
Comparison of SUVR with MRTM2 DVR for SUVR determined from 60 to 80 (left) and 70 to 90 (right) min after 18F-MK-6240 injection. Red line indicates unity.
18F-MK-6240 Imaging Features
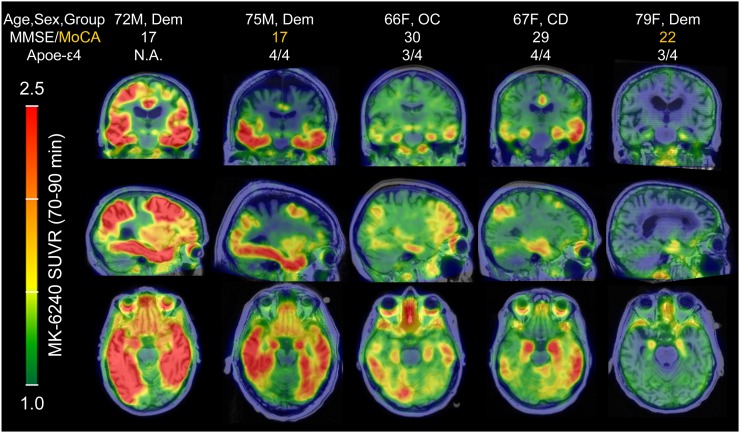
Regions of potential off-target binding identified using mean SUVR images of controls and individual cases included the ethmoid sinus, clivus, sphenotemporal buttress, pineal gland, substantia nigra, superior anterior vermis, superior cerebellum, and meninges and varied in magnitude and spatial extent across all subjects (Fig. 5). In some extreme cases (6/51), meninges binding was observed to spill into adjacent cortical areas. In 2 cases, focal binding was observed in benign calvarial lesions. Elevated binding was generally not observed in the basal ganglia, choroid plexus (except 1 moderate case), or other regions of the brain that could preclude binding quantification in NFT-associated regions. All individuals who were PiB(+) and indicated visually elevated binding in pathological tau-associated regions followed patterns consistent with neuropathological NFT staging (Fig. 6).
FIGURE 5.
Mean parametric 18F-MK-6240 SUVR(70–90 min) images taken across controls (top, n = 29) and PiB(+) AD and MCI individuals (bottom, n = 6) in MNI template space demonstrating common off-target and on-target binding.
FIGURE 6.
18F-MK-6240 parametric SUVR(70–90 min) images in PiB(+) individuals organized by image-based Braak stages. 18F-MK-6240 spatial binding patterns in PiB(+) individuals recapitulated patterns consistent with neuropathological staging of AD, including in the hippocampus. The PiB(+) dementia patient in far-right column was clinically diagnosed with probable AD dementia (not informed by biomarkers), but exhibited only circumscribed 18F-MK-6240 signal in the entorhinal region. MoCA = Montreal Cognitive Assessment.
DISCUSSION
PET radiopharmaceuticals for detecting NFTs in AD require a high selectivity over other amyloids (e.g., Aβ), high in vivo affinity to tau to improve sensitivity for detecting early and longitudinal changes, low off-target binding near regions of interest, and pharmacokinetic properties that enable timely PET acquisition. The kinetics properties of 18F-MK-6240 were favorable for PET imaging and comparable to 18F-AV-1451 (29), a widely used tau PET radiotracer. 18F-MK-6240 DVR values in AD participants were high (DVR > 4), suggesting a combination of high in vivo affinity to tau and low nondisplaceable signal. Unlike 18F-AV-1451 and 18F-THK-5351 (12,16), 18F-MK-6240 does not appear to have any substantial binding in regions of the brain that would preclude detection of NFTs (e.g., basal ganglia, choroid plexus), particularly in medial temporal regions (e.g., the entorhinal cortex and hippocampus) where tau pathology is implicated relatively early in the disease process (4). In addition, among the individuals who were identified as being amyloid positive, 18F-MK-6240 binding patterns recapitulated neuropathological staging of NFTs, including Braak I and II regions, which supports the sensitivity of the ligand to detect and characterize tau aggregates during early-stage disease. Notably, the lack of off-target binding near the hippocampus (e.g., choroid plexus), a region associated with learning and memory, may allow 18F-MK-6240 to differentiate relationships between tau and other features of AD (e.g., β-amyloid, atrophy, and glucose hypometabolism) and their impact on declining cognition.
When evaluating quantification methods for tau PET imaging within the context of clinical research, it is desirable to reduce the PET scan duration to accommodate aging and symptomatic individuals who can experience discomfort and to maximize the efficiency of the tomograph usage in multitracer studies. Although DVR estimates were stable using as little as 60 min of dynamic data, SUVR quantification with static imaging may be more practical for persons with AD because the overall emission scan duration can be reduced to 20 min and still achieve binding estimates comparable to DVR methods.
The selection of the scan duration for SUVR estimation with 18F-MK-6240 involves a trade-off between unwanted off-target spill-in from sites outside the brain with the accuracy of quantification. In particular, regions that could potentially influence cortical binding estimates (ethmoid, clivus, and meninges) had SUVRs that were increasing through 120 min. Notably, signal in the ethmoid sinus was observed to spill into the orbitofrontal cortex, which could limit quantification of tau-related signal. In contrast, SUVRs in target regions were in agreement with DVR estimates when data from 70 to 90 min were used, although SUVRs in target regions were still increasing in higher binding AD subjects during this window. Taken together, this suggests that the 70 to 90 min acquisition window will produce accurate binding estimates while reducing potential contamination from off-target binding. This may need to be reevaluated in studies looking to characterize changes (longitudinal and therapeutic intervention) in SUVR in high-binding AD subjects.
A limitation of this study was the absence of arterial blood sampling, which would have provided the gold standard comparison for the DVR and SUVR estimates and could elucidate the source of the discrepancy between LGA and MRTM2 methods. However, because there has been extensive evaluation of the cerebellum as a reference region with other tau tracers (27–30), the cerebellum is used in large-scale tau PET neuroimaging studies (12,13,31), and previous preclinical work did not observe nonpolar radiometabolites (18), we believe the results presented in this work will accurately represent comparisons with arterial-derived specific binding estimates, but this must be confirmed. Additionally, the mechanism of tracer accumulation in non-NFT target regions is unknown and should be further investigated. Lastly, this study sample was selected to encompass a wide range of disease states, but further investigation of associations between MK-6240 and other disease biomarkers and cognition in a larger cohort is needed.
CONCLUSION
In a sample of individuals ranging from young cognitively unimpaired controls to individuals with AD dementia, 18F-MK-6240 had favorable kinetics for DVR and SUVR quantification by 90 min after injection, low off-target binding in the brain, and binding patterns consistent with neuropathological staging of neurofibrillary tau. These characteristics indicate that 18F-MK-6240 PET imaging will play a critical role in advancing the understanding of the role of tau pathology in AD.
DISCLOSURE
Funding for this work was provided by NIH T32CA009206, NIH R01AG021155, NIH R01AG027161, NIH P50AG033512, and NICHD U54HD090256. 18F-MK-6240 precursor and MK-6240 reference standard were provided by Cerveau Technologies. No other potential conflict of interest relevant to this article was reported.
Acknowledgments
We acknowledge the University of Wisconsin–Madison Cyclotron Group, the Wisconsin Alzheimer’s Disease Research Center, and the Waisman Center faculty and staff for their contributions to this work and the study participants for their participation and dedication. We also thank Rachel Mulligan of Austin Health for contributing the improved 18F-MK-6240 hydrolysis conditions and Cerveau Technologies for providing the MK-6240 precursor and reference standards.
REFERENCES
- 1.Braak H, Braak E. Neuropathological stageing of Alzheimer-related changes. Acta Neuropathol (Berl). 1991;82:239–259. [DOI] [PubMed] [Google Scholar]
- 2.Thal DR, Rüb U, Orantes M, Braak H. Phases of Aβ-deposition in the human brain and its relevance for the development of AD. Neurology. 2002;58:1791–1800. [DOI] [PubMed] [Google Scholar]
- 3.Nelson PT, Alafuzoff I, Bigio EH, et al. Correlation of Alzheimer disease neuropathologic changes with cognitive status: a review of the literature. J Neuropathol Exp Neurol. 2012;71:362–381. [DOI] [PMC free article] [PubMed] [Google Scholar]
- 4.Braak H, Thal DR, Ghebremedhin E, Del Tredici K. Stages of the pathologic process in Alzheimer disease: age categories from 1 to 100 years. J Neuropathol Exp Neurol. 2011;70:960–969. [DOI] [PubMed] [Google Scholar]
- 5.Jack CR, Knopman DS, Jagust WJ, et al. Tracking pathophysiological processes in Alzheimer’s disease: an updated hypothetical model of dynamic biomarkers. Lancet Neurol. 2013;12:207–216. [DOI] [PMC free article] [PubMed] [Google Scholar]
- 6.Jack CR, Jr, Wiste HJ, Weigand SD, et al. Defining imaging biomarker cut points for brain aging and Alzheimer’s disease. Alzheimers Dement. 2017;13:205–216. [DOI] [PMC free article] [PubMed] [Google Scholar]
- 7.Schwarz AJ, Yu P, Miller BB, et al. Regional profiles of the candidate tau PET ligand 18F-AV-1451 recapitulate key features of Braak histopathological stages. Brain. 2016;139:1539–1550. [DOI] [PubMed] [Google Scholar]
- 8.Grothe MJ, Barthel H, Sepulcre J, et al. In vivo staging of regional amyloid deposition. Neurology. 2017;89:2031–2038. [DOI] [PMC free article] [PubMed] [Google Scholar]
- 9.van Maurik IS, Zwan MD, Tijms BM, et al. Interpreting biomarker results in individual patients with mild cognitive impairment in the Alzheimer’s biomarkers in daily practice (ABIDE) project. JAMA Neurol. 2017;74:1481–1491. [DOI] [PMC free article] [PubMed] [Google Scholar]
- 10.Mathis CA, Lopresti BJ, Ikonomovic MD, Klunk WE. Small-molecule PET tracers for imaging proteinopathies. Semin Nucl Med. 2017;47:553–575. [DOI] [PMC free article] [PubMed] [Google Scholar]
- 11.Brier MR, Gordon B, Friedrichsen K, et al. Tau and Aβ imaging, CSF measures, and cognition in Alzheimer’s disease. Sci Transl Med. 2016;8:338ra66. [DOI] [PMC free article] [PubMed] [Google Scholar]
- 12.Johnson KA, Schultz A, Betensky RA, et al. Tau positron emission tomographic imaging in aging and early Alzheimer disease. Ann Neurol. 2016;79:110–119. [DOI] [PMC free article] [PubMed] [Google Scholar]
- 13.Lowe VJ, Wiste HJ, Senjem ML, et al. Widespread brain tau and its association with ageing, Braak stage and Alzheimer’s dementia. Brain. 2018;141:271–287. [DOI] [PMC free article] [PubMed] [Google Scholar]
- 14.Villemagne VL, Dore V, Bourgeat P, et al. Abeta-amyloid and tau imaging in dementia. Semin Nucl Med. 2017;47:75–88. [DOI] [PubMed] [Google Scholar]
- 15.Shoghi-Jadid K, Small GW, Agdeppa ED, et al. Localization of neurofibrillary tangles and beta-amyloid plaques in the brains of living patients with Alzheimer disease. Am J Geriatr Psychiatry. 2002;10:24–35. [PubMed] [Google Scholar]
- 16.Ng KP, Pascoal TA, Mathotaarachchi S, et al. Monoamine oxidase B inhibitor, selegiline, reduces 18F-THK5351 uptake in the human brain. Alzheimers Res Ther. 2017;9:25. [DOI] [PMC free article] [PubMed] [Google Scholar]
- 17.Hashimoto H, Kawamura K, Takei M, et al. Identification of a major radiometabolite of [11C]PBB3. Nucl Med Biol. 2015;42:905–910. [DOI] [PubMed] [Google Scholar]
- 18.Hostetler ED, Walji AM, Zeng Z, et al. Preclinical characterization of 18F-MK-6240, a promising PET tracer for in vivo quantification of human neurofibrillary tangles. J Nucl Med. 2016;57:1599–1606. [DOI] [PubMed] [Google Scholar]
- 19.Johnson SC, Koscik RL, Jonaitis EM, et al. The Wisconsin Registry for Alzheimer’s Prevention: a review of findings and current directions. Alzheimers Dement (Amst). 2017;10:130–142. [DOI] [PMC free article] [PubMed] [Google Scholar]
- 20.Johnson SC, Christian BT, Okonkwo OC, et al. Amyloid burden and neural function in people at risk for Alzheimer’s Disease. Neurobiol Aging. 2014;35:576–584. [DOI] [PMC free article] [PubMed] [Google Scholar]
- 21.Lazari M, Quinn KM, Claggett SB, et al. ELIXYS: a fully automated, three-reactor high-pressure radiosynthesizer for development and routine production of diverse PET tracers. EJNMMI Res. 2013;3:52. [DOI] [PMC free article] [PubMed] [Google Scholar]
- 22.Betthauser TJ, Ellison PA, Murali D, et al. Characterization of the radiosynthesis and purification of [18F]THK-5351, a PET ligand for neurofibrillary tau. Appl Radiat Isot. 2017;130:230–237. [DOI] [PMC free article] [PubMed] [Google Scholar]
- 23.Racine AM, Clark LR, Berman SE, et al. Associations between performance on an abbreviated CogState battery, other measures of cognitive function, and biomarkers in people at risk for Alzheimer’s disease. J Alzheimers Dis. 2016;54:1395–1408. [DOI] [PMC free article] [PubMed] [Google Scholar]
- 24.Christian BT, Vandehey NT, Floberg JM, Mistretta CA. Dynamic PET denoising with HYPR processing. J Nucl Med. 2010;51:1147–1154. [DOI] [PMC free article] [PubMed] [Google Scholar]
- 25.Logan J, Fowler JS, Volkow ND, Wang G-J, Ding Y-S, Alexoff DL. Distribution volume ratios without blood sampling from graphical analysis of PET data. J Cereb Blood Flow Metab. 1996;16:834–840. [DOI] [PubMed] [Google Scholar]
- 26.Ichise M, Liow JS, Lu JQ, et al. Linearized reference tissue parametric imaging methods: application to [11C]DASB positron emission tomography studies of the serotonin transporter in human brain. J Cereb Blood Flow Metab. 2003;23:1096–1112. [DOI] [PubMed] [Google Scholar]
- 27.Lemoine L, Saint-Aubert L, Marutle A, et al. Visualization of regional tau deposits using 3H-THK5117 in Alzheimer brain tissue. Acta Neuropathol Commun. 2015;3:40. [DOI] [PMC free article] [PubMed] [Google Scholar]
- 28.Marquié M, Normandin MD, Vanderburg CR, et al. Validating novel tau positron emission tomography tracer [F-18]-AV-1451 (T807) on postmortem brain tissue. Ann Neurol. 2015;78:787–800. [DOI] [PMC free article] [PubMed] [Google Scholar]
- 29.Wooten DW, Guehl NJ, Verwer EE, et al. Pharmacokinetic evaluation of the tau PET radiotracer 18F-T807 (18F-AV-1451) in human subjects. J Nucl Med. 2017;58:484–491. [DOI] [PMC free article] [PubMed] [Google Scholar]
- 30.Jonasson M, Wall A, Chiotis K, et al. Tracer kinetic analysis of (S)-18F-THK5117 as a PET tracer for assessing tau pathology. J Nucl Med. 2016;57:574–581. [DOI] [PubMed] [Google Scholar]
- 31.Gordon BA, Friedrichsen K, Brier M, et al. The relationship between cerebrospinal fluid markers of Alzheimer pathology and positron emission tomography tau imaging. Brain. 2016;139:2249–2260. [DOI] [PMC free article] [PubMed] [Google Scholar]


