Abstract
Background
The zebrafish (Danio rerio) has recently been shown to be an ideal model to study bone disease including osteoporosis. The zebrafish osteoporosis model could be induced by glucocorticoid treatment with chemical staining for reflecting the level of bone mineralization. However, this methodology was unstable. Here, we developed a novel methodology to directly evaluate the bone mass and density.
Methods
We generated and used the bone of transgenic zebrafish Tg (ola.sp7:nlsGFP) to evaluate the bone mass and density by measuring the areal extent and the integrated optical density (IOD) of enhanced green fluorescent protein (eGFP). This methodology was further compared with the traditional chemically stained method showing the bone mineralization. Furthermore, genes related to zebrafish osteoporosis were analyzed by quantitative reverse transcription‐polymerase chain reaction (qRT‐PCR).
Results
Our results of new methods were consistent with those from chemically stained fish, following glucocorticoid‐induction or epimedium flavonoid (FE)‐rescue treatments. qRT‐PCR analyses on mRNA levels revealed that glucocorticoid induces osteoporosis by downregulating the expression of osteoblast‐related factors osterix, osteocalcin, and osteopontin, and upregulating the expression of osteoclast‐related factor tartrate‐resistant acid phosphatase. In FE‐rescued fish, the expression of osteogenic factors osterix, osteocalcin, and osteopontin were increased.
Conclusion
Compared to the traditional chemical staining methods, the new osteoporosis model using Tg(ola.sp7:nlsGFP) is more convenient and efficient for studying osteoporosis in vivo, and especially for high‐throughput anti‐osteoporosis drug screening.
Keywords: drug screening, osteoporosis, transgenic, zebrafish
1. INTRODUCTION
Osteoporosis (OP) is a degenerative bone disease characterized by decreased bone mass, microstructural bone degradation, and increased fracture risk. The pathogenesis of OP is associated with an imbalance in bone metabolism, including disruptions to bone formation and bone resorption processes, regulated by osteoclasts and osteoblasts, respectively. OP takes hold when the rate of bone formation is lower than that of bone resorption. Drugs for treating OP include bone resorption inhibitors and bone formation enhancers. Bone resorption inhibitors represent the largest drug class and include bisphosphonates, hormone replacement therapy (HRT), selective estrogen receptor modulators (SERMs), calcitonin, and rank ligand inhibitors.1 These treatments increase bone mineral density (BMD) through the inhibition of bone resorption. Bone formation enhancers directly stimulate bone formation, and promote the production of collagen and bone matrix by osteoblasts. Many traditional Chinese medicines or compounds have been shown to have some efficacy in these processes, in vitro studies and live rats, including the so‐called Liuwei Dihuang,2 epimedium,3 salvia miltiorrhizae,4 and fructus cnidii.5
Disease models are very important for drug research and development. However, cell models are overly simplistic and cannot accurately reflect overall physiology or provide much information on drug metabolism in vivo. Animal models such as mice have cost and time disadvantages that limit their application in high‐throughput screening. By comparison, zebrafish have several advantages that include their rapid development and their small, transparent bodies. Moreover, developmental signaling pathways and related genes are highly conserved between zebrafish and mammals. The bone development mechanisms are evolutionarily conserved in vertebrates. Major pathways related to osteoblast development include Wnt/β‐catenin, TGF‐β, and Hedgehog signaling.6 Broadly similar to mammals, bone formation in lower vertebrates also features endochondral and intramembranous ossification controlled by a series of transcription factors and hormones. Key regulators involved in zebrafish bone formation include osterix, runx2a/b, col10a1, and osteonectin,7 which are homologous to human bone formation regulators. Overall, these common developmental features provide a rationale for using zebrafish as a research model for diseases of the maturing skeleton, and, arguably, of the adult skeleton.8, 9, 10 Transgenic technology, which uses reporter genes inserted downstream of a tissue‐specific promoter, can be used to produce fluorescence in specific organs. This technology has been used in zebrafish to enable the studies of gene function at the molecular level as well as for drug screening. The transgenic zebrafish line Tg(ola.sp7:nlsGFP) that expresses enhanced green fluorescent protein (eGFP) in bone has already been used by researchers to study the development of axial skeleton.11
Patients treated with various glucocorticoids sometimes develop OP as a side effect.12, 13 In most vertebrates, including mammals, the glucocorticoid system is highly conserved. Similar symptoms can be induced in mice.14 Glucocorticoids have also been used in zebrafish to induce OP‐like symptoms and create a model of OP.15, 16 Chemical staining using calcein, quercetin, and alizarin red is a much‐used method in bone research.17 Staining using alizarin red which can chelate with calcium ions is the most commonly used visualization method for bone mineralization in zebrafish.8, 15, 16, 18 However, this method has disadvantages, including tedious technical procedures (requiring dyeing and use of many reagents), time consumption (lengthy dyeing and bleaching processes), unstable dye labeling (alizarin red is not always able to spread as required throughout the fish). In this study, we sought to generate a glucocorticoid‐induced OP (GIOP) model and to establish its evaluation protocols using bone transgenic zebrafish Tg(ola.sp7:nlsGFP). The eGFP signal area and integral optical density (IOD) were measured to reflect the bone mineralization area and BMD, respectively. This novel method has the advantages of improved convenience, efficiency, and stability, and provides a powerful tool for high‐throughput screening of anti‐OP drugs.
2. MATERIALS AND METHODS
2.1. Zebrafish husbandry
Adult zebrafish (Danio rerio) were maintained according to standard laboratory procedures.19 Embryos and larvae were raised in embryo water (5 mM NaCl, 0.17 mM KCl, 0.33 mM CaCl2, 0.33 mM MgSO4) in an incubator at 28.5°C. The zebrafish were handled in accordance with Guangdong state regulations on laboratory animal management and the study was approved by the Ethics Committee of the Affiliated Hospital of Guangdong Medical University.
2.2. Generating transgenic zebrafish using gateway transposon system
Tg(ola.sp7:nlsGFP) transgenic zebrafish were generated using the Tol2 transposon system as previously described.20 pDestTol2CG2‐osterix‐nlseGFP‐pA plasmid was kindly provided by the laboratory of Schulte‐Merker. Adult founder fish were identified by out‐crossing them to wild‐type zebrafish and screening the F1 generation for eGFP‐expressing embryos. Homozygous embryos laid from the same pair of adult fishes expressing strong eGFP were used in the same set of experiment in this study.
2.3. Zebrafish osteoporosis model induction
Wild‐type or transgenic larvae at 4 days postfertilization (dpf) were raised in 12‐well plates. N‐phenylthiourea (PTU, Sigma, USA) was added to the embryo water to prevent pigmentation. For GIOP model establishment, embryos were exposed to dexamethasone (Dex, MP cat no. 194561, dissolved in dimethyl sulfoxide [DMSO]) with series concentrations of 5, 10, and 20 μM in order to select the best effective concentration. For rescue experiments, flavonoids derived from epimedium (FE, purity > 90%, Tianyuan‐BioPharm, China) with series concentrations of 1.0, 0.5, and 0.1 μg/mL were mixed with 10 μM Dex to select the best effective concentration. DMSO (1:1000) and pure egg water groups were set as controls. Half the volume of the embryo water was refreshed daily (with Dex and/or FE). All trials were ended on the fifth day and 8 dpf fish were collected for bone mineralization analysis. n = 18 embryos per group.
2.4. Quantitative reverse transcription‐polymerase chain reaction (qRT‐PCR)
A total of 15 fish at 8 dpf from each group were collected for qRT‐PCR analysis. Total RNA was isolated with Trizol (Invitrogen, USA) and treated with DNase I (Thermo Scientific, USA). An output of 1000 ng RNA was used for cDNA synthesis with SYBR® Green Real‐time PCR Master Mix (Toyobo, Japan) according to the manufacturer's instructions. The obtained cDNA was diluted 1:10 in DEPC‐treated water for further experiments. qRT‐PCR reaction was set at a total volume of 20 μL, containing 10 μL 2 × SYBR® Green Real‐time PCR Master Mix, 5 μL diluted cDNA, 0.8 μL primers, and DEPC‐treated water. The primers used in this experiment were as follows: osterix‐Fw AAGAAACCTGTCCACAGCTG; osterix‐Re GAGGCTTTACCGTACACCTT; osteocalcin‐Fw TGGCCTCTATCATCATGAGACAGA; osteocalcin‐Re CTCTCGAGCTGAAATGGAGTCA; eGFP‐Fw GAAGAACGGCATCAAGGTG, eGFP‐Re ACTGGGTGCTCAGGTAGTGG; osteopontin‐Fw CGCTCAGCAAGCAGTTCAGA; osteopontin‐Re AGAATAGGAGGTGGCCGTTGA; tracp‐Fw CGTCCACTGACCACAGGAAGA, tracp‐Re AAGGATCCTGACGTCTGATTGA; β‐actin‐Fw CAACAGGGAAAAGATGACACAGAT; and β‐actin‐Re CAGCCTGGATGGCAACGT.
2.5. Imaging and evaluation of bone mineralization
Zebrafish larvae were fixed in 4% paraformaldehyde (PFA) in phosphate‐buffered saline (PBS). For wild‐type fish staining, zebrafish larvae were stained with alizarin red as described previously.21 Embryos were embedded and imaged using a M205 FA stereomicroscope (Leica, Germany). The gain, saturation, exposure, and lighting levels were identical for each imaging procedure. Tg(ola.sp7:nlsGFP) transgenic zebrafish was imaged with a laser scanning confocal microscope (LSCM) (Leica TCS SP5 II, Germany) for 3D reconstruction. During all the imaging processes of all the groups of fish, the LSCM imaging parameters were set identically. The pinhole was set as 1 AU and digital gain was set as 1.0; Both the master gain and digital offset were set as the lowest to avoid overexposure. The optimized sectioning depth was adopted for the Z‐Stack and internal depth setting. Bone mineralization was evaluated from 3D reconstructed images and quantified using Image‐Pro software (Image‐Pro Plus 6.0, USA). During the measurement of density and IOD, the eyedropper tool was used to repeatedly and precisely select the region of interest (ROI) until all the ROI are chosen. For wild‐type fish, the alizarin red‐stained area (excluding the otolith region) was measured as previously described.9 For transgenic fish, fluorescent images were first inverted to grayscale images. Then, the fluorescent area and IOD, representing the extent of mineralization and BMD, respectively, were measured in the same way as the alizarin red‐stained embryos. For the calculation of the signal intensity, the “measurement data” and “statistics” function were adopted to make T test of IOD results. n = 18 embryos per group.
2.6. Statistics
A one‐way ANOVA with Tukey's post hoc tests were used to determine differences between groups in various experiments. The differences between two groups were analyzed by Student's t tests. Differences were considered significant when P values were less than .05. Data are presented as mean ± SD.
3. RESULTS
3.1. Dex‐induced osteoporosis‐like symptoms in Tg(ola.sp7:nlsGFP) zebrafish
To generate cortical bone transgenic zebrafish, pDestTol2CG2‐osterix‐nlsegfp‐pA vector was injected into AB zebrafish embryos. The expression pattern of the eGFP which labels osteoblasts was investigated in a series of developmental stages of Tg(ola.sp7:nlsGFP) zebrafish. EGFP was initially detectable in the anterior part of the head and the tail region of 1 dpf embryo (Figure 1A). At 8 dpf, eGFP was clearly visible in the cleithrum (CT), opercle, mandible (MD), and branchiostegal (BR) (Figure 1B). From 30 to 42 dpf, eGFP strongly labeled the rostral skeleton, vertebral columns, fins, tail, and scales (Figure 1C,D). The cephalic bones developed between 4 and 8 dpf. During this period, the structure and morphology of cephalic bones undergo no distinguishable changes (data not shown). There were no significant variations in either both bone mass or BMD, which was reflected in the eGFP fluorescent area and IOD, respectively, during these developmental stages (Figure 2). Therefore, zebrafish larvae from 4 to 8 dpf were used in this study.
Figure 1.

eGFP expression patterns in Tg(ola.sp7:nlsGFP) zebrafish. (A), At 1 d postfertilization (dpf), GFP is weakly expressed in the posterior trunk and tail regions. (B), Until 8 dpf, GFP‐labeled osteoblasts are detectable in ceratobranchial, opercle, branchiostegal rays, and mandible of the head region. (C), The rostral skeleton, axial skeleton, fin, and tail vertebral columns are clearly labeled by eGFP in 30 dpf juvenile fish. (D), Fluorescent fish scales are visible in 42 dpf transgenic fish. CT, cleithrum; BR, branchiostegal rays; MD, mandible
Figure 2.

Cephalic bone mass and BMD changes in Tg(ola.sp7:nlsGFP) zebrafish during 4‐8 dpf developmental stages. Bone mass and bone mineral density (BMD) were evaluated by measuring GFP area and integrated optical density. There is no significant difference among during these stages. Data are presented as means ± SD. n = 18 fish for each group
Alizarin red, which chelates with calcium ions, labels mineralized bones and is the most common method of studying bone mineralization. When comparing the early stage bone structures resultant from these two methods, there was a distinct difference, especially in the anterior notochord region which was clearly marked by alizarin red staining but remained unmarked in transgenic fish in zebrafish larvae at 8 dpf (Figure 3).
Figure 3.
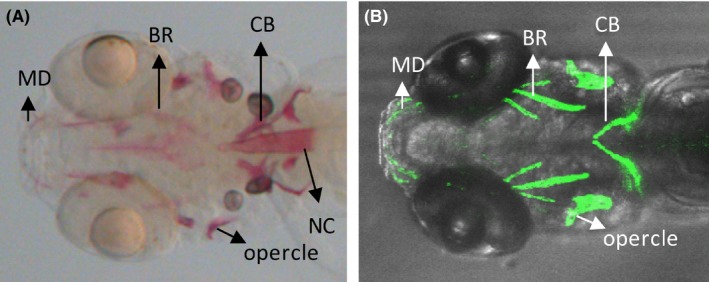
Comparison of GFP‐labeled cephalic bones in Tg(ola.sp7:nlsGFP) zebrafish to alizarin red‐stained cephalic bones at 8 dpf. (A), Alizarin red stains mineralized bones in zebrafish head region, including cleithrum, opercle, branchiostegal rays, mandible, and notochord. (B), 3D‐reconstructed confocal image of Tg(ola.sp7:nlsGFP) zebrafish larvae. In comparison with alizarin red‐stained fish, eGFP is not expressed in the notochord of transgenic fish. CT, cleithrum; BR, branchiostegal rays; MD, mandible; NC, notochord
To induce OP‐like symptoms, different concentrations of Dex were administered to 4 dpf zebrafish larvae. Morphologically, there was no significant difference between the blank (solely water‐incubated embryos) and DMSO‐incubated zebrafish larvae. At 8 dpf, zebrafish treated with 5 μM Dex displayed a slight curve in the linked region of the brain and trunk when compared with nontreated or DMSO‐treated controls (Figure 4A‐C). This phenotype was exacerbated by increasing concentrations of Dex from 10 to 20 μM (Figure 4D,E). When comparing the cephalic bone images by morphometry, all treated embryos presented similar structures within alizarin red‐stained groups and Tg(ola.sp7:nlsGFP) groups, respectively (Figure 5A,B). However, the signal strength of Dex‐treated larvae displayed decreasing trends in both alizarin red staining and green fluorescence (Figure 5A,B). Within both groups, larvae exposed to 5 μM Dex showed significantly decreased mineralized areas compared with DMSO‐treated ones (P < .05 or P < .01). Increasing the concentration to either 10 or 20 μM further enhanced this difference (P < .001, Figure 5A‐F). The above results indicated that the evaluation method using eGFP area and IOD as parameters can reflect the level of bone mass loss. The results were consistent with those from traditional alizarin red staining, suggesting a successful generation of zebrafish GIOP model using Tg(ola.sp7:nlsGFP) line (Figure 5D‐F).
Figure 4.

Morphologies of zebrafish larvae after Dex induction or FE treatment. In blank and DMSO‐treated control groups, zebrafish display a straight fish body (A, B). In Dex‐induced OP models, the larvae show a bent body and a curve at the link point of the head and trunk region as depicted by the red dash lines. This impairment is exacerbated by the increase in the Dex concentration from 5 μM to 20 μM (C‐E). (F), 1 μg/mL FE treatment rescues the impaired morphology observed in OP‐like fish
Figure 5.
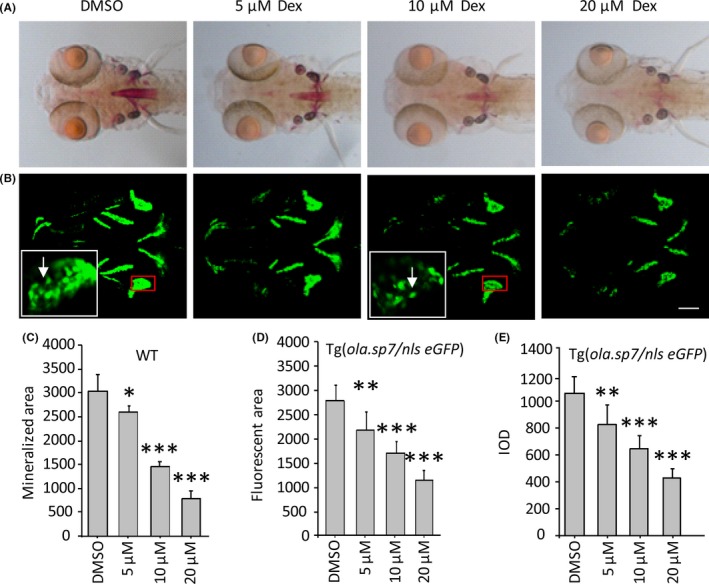
Dex induces OP‐like symptom in both wild‐type and Tg(ola.sp7:nlsGFP) zebrafish. (A), Dex‐treated larvae were stained by alizarin red. The stained area show the level of bone mineralization which is decreased in a dose‐dependent manner of Dex concentration from 0 to 20 μM (D). (B), 3D‐reconstructed confocal images of Dex‐treated Tg(ola.sp7:nlsGFP) zebrafish. Bone mass and density are reflected by GFP area and integrated optical density, which also presented a dose‐dependent manner of Dex concentration from 0 to 20 μM (E, F). Images in white frames are 5× magnifications relative to the red insets, where osteoblasts are visible (white arrow). Data are presented as means ± SD; *P < .05; **P < .01; ***P < .001; n = 18 fish in each group; scale bar, 100 μm
3.2. Rescue from GIOP using flavonoid treatment
Based on the successful establishment of the GIOP model, we next examined the clinical relevance of this model by treating with flavonoid, which was extracted from the traditional Chinese medicine epimedium (FE) and which has been reported to exert anti‐OP effects in rat studies.3 Primary analysis of 1 μg/mL FE effects on zebrafish bone growth indicated that FE stimulation could increase the bone mass, as reflected in both the fluorescent area and IOD (both P < .05, Figure 6). To investigate the restorative effect of FE on the GIOP model, different concentrations of FE were mixed with 10 μM Dex and tested on zebrafish larvae from 4 to 8 dpf. As a result, 1 μg/mL FE‐added mixture rescued zebrafish larvae from a curved body in the linked region of the brain and trunk (Figure 4B, 4D‐F). Morphometric analyses of Tg(ola.sp7:nlsGFP) images demonstrated that the fluorescent area and IOD were once again higher in 1 μg/mL FE‐treated larvae compared to the GIOP group (Figure 7B,E,F, P < .01). This indicated that treatment with 1 μg/mL FE could significantly inhibit bone loss. These results were consistent with image analyses from traditional alizarin red‐stained groups (Figure 7A,D). The above results indicate that FE is capable of preventing bone loss in GIOP, suggesting its potential therapeutic effect on OP.
Figure 6.
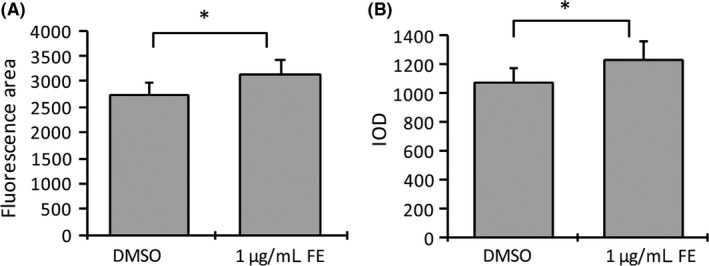
FE treatment promotes zebrafish bone mass and growth. (A, B), Bone mass and density were calculated by measuring GFP area and integrated optical density. FE can significantly promote the bone mass of zebrafish cephalic bones compared to DMSO‐treated controls. Data are presented as means ± SD. *P < .05; n = 18 fish for each group
Figure 7.
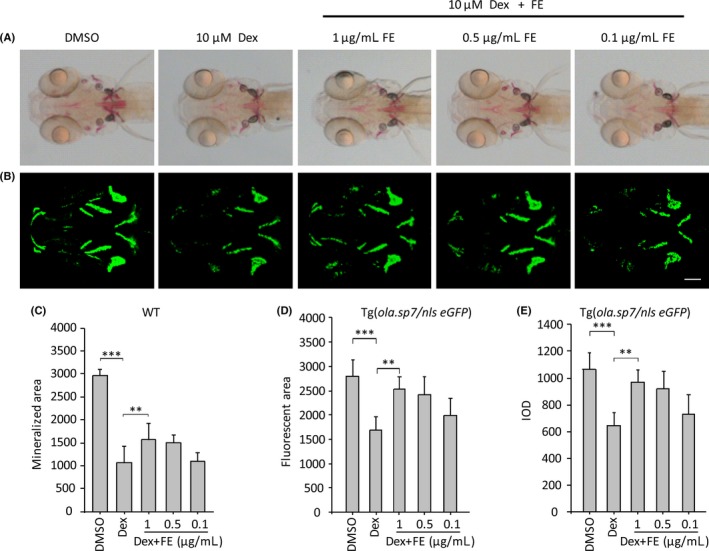
FE rescues OP‐like symptom induced by Dex. (A), Alizarin red‐stained zebrafish head regions of FE‐treated larvae. 1 μg/mL FE‐added zebrafish totally recovers the stained signal strength in comparison with GIOP model (**P < .01) (D). (B), 3D‐reconstructed confocal images of FE‐treated Tg(ola.sp7:nlsGFP) zebrafish head regions. Bone mass and bone mineral density (BMD) evaluated by fluorescent area and IOD reflect a rescued effect on 1 μg/mL FE‐treated OP‐like zebrafish (**P < .01) (E, F). Data are presented as means ± SD; **P < .01; ***P < .001; n = 18 fish in each group; scale bar, 100 μm
3.3. Gene expression variations involved in GIOP and flavonoid treatment
In mammalians, osteoblast transcription factors osterix, osteocalcin, osteopontin, as well as osteoclast factor tracp, which regulate both bone and matrix formation, have been reported to be involved in OP. Therefore, qRT‐PCR was performed to analyze the expression levels of the homologous osteoblast‐ and osteoclast‐related genes in GIOP zebrafish. Compared with the DMSO‐treated controls, Dex treatment downregulated expression levels of osterix, osteocalcin, and osteopontin, whereas tracp expression was significantly upregulated (P < .01, Figure 8). Compared with the GIOP group, FE treatment up‐regulated the expression of osterix, osteocalcin, and osteopontin (P < .05), but had no effect on tracp expression (P > .05). Moreover, consistent with the eGFP protein expression variations in osteoblasts, the expression level of egfp mRNA was also downregulated in GIOP models, and upregulated in FE‐rescued OP Tg(ola.sp7:nlsGFP) fish, respectively.
Figure 8.
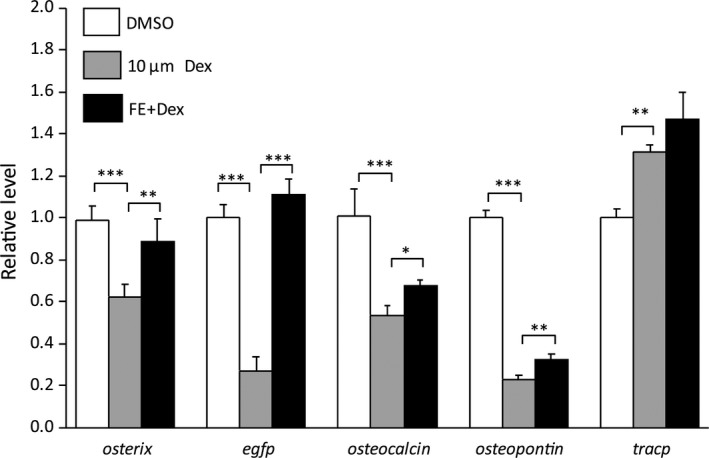
Gene expression alterations in GIOP and FE‐treated zebrafish. Osteoblast‐related genes osterix, osteocalcin, and osteopontin are significantly downregulated by 10 μM Dex treatment, and upregulated again in FE‐added zebrafish. Osteoclast‐related tracp is upregulated by Dex induction, whereas the FE treatment is unable to downregulate its expression. Data are presented as means ± SD. *P < .05; **P < .01; ***P < .001; n = 4 repeats
4. DISCUSSION
In this study, we used cortical bone transgenic zebrafish Tg(ola.sp7:nlsGFP), which express eGFP in osteoblasts, to establish a GIOP model. In this model, mineralized bone area and density were directly evaluated by measuring the area and intensity of eGFP signals in osteoblasts. After Dex administration, the variations of bone loss and BMD reduction observed in Tg(ola.sp7:nlsGFP) images were consistent with the traditional chemical staining methods using alizarin red. However, when comparing the early stage bone structures resultant from these two methods, there was a distinct difference, especially in the anterior notochord region. The notochords of 8 dpf zebrafish were clearly marked by alizarin red staining but remained unmarked in transgenic fish (Figure 3). Alizarin red, which chelates with calcium ions, labels mineralized bones and is the most common method of studying bone mineralization. In Tg(ola.sp7:nlsGFP) zebrafish, expression of eGFP was driven by the promoter of osterix, an osteoblast‐specific gene.22 Therefore, eGFP only labels osteoblast‐composed bones. At the early stage of zebrafish development, the notochord is more like a cartilage, and has no involvement with osteoblasts.23 Hence, no eGFP was observed in notochords.
As a traditional Chinese medicine to reinforce kidney and bone strength, FE has been reported to exert therapeutic effects on mice in OP models.3 Quantified results of bone mass and mineral density from both alizarin red‐stained and transgenic Tg(ola.sp7:nlsGFP) embryos demonstrated the protective effect of FE on OP‐like symptoms. Both solely FE‐treated zebrafish and FE‐rescued GIOP models indicated an increase in bone mass. Additionally, the morphology of Dex‐induced zebrafish larvae presented curved bodies, which was consistent with the clinical OP hunchback symptom (Figure 4). Thus, GIOP zebrafish showed similar clinical characteristics to human OP, including decreased bone mass and mineral density, altered morphology and impaired mobility. This evidence proves that zebrafish is a suitable animal model for OP study.
A typical characteristic of OP is the imbalance between osteoclasts and osteoblasts. Gene expression analyses revealed downregulated expressions of osterix, osteocalcin, and osteopontin, and an upregulated expression of tracp in GIOP zebrafish. This indicated that osteoblast formation was inhibited while osteoclast formation was enhanced. These findings are consistent with the canonical molecular mechanisms of GIOP.24, 25 FE reduced OP‐like symptoms by upregulating the expression of osteoblast‐specific transcription factors. However, it had no effect on tracp, the osteoclast‐related transcription factor. This suggests that FE only affects osteoblasts. It is likely FE contributes to the increasing of osteoblasts rather than the inhibition of osteoclast formation.
A limitation of our GIOP model is its inability to label osteoclast cells during OP‐like symptom formation, since eGFP labels only osteoblasts. Therefore, this model could only be applied in the screening of anti‐OP drugs which have a direct effect on osteoblasts. It is not suitable for studying the pathology of OP where osteoclasts are involved. However, compared with traditional alizarin red staining methods, use of Tg(ola.sp7:nlsGFP) zebrafish can easily evaluate bone mass and density by eGFP signaling. It not only eliminates the tedious processes of staining and bleaching, but also avoids the unstable signals caused by chemical staining. Hence, this model and the related evaluation methods can be applied in anti‐OP drug screening.
CONFLICT OF INTEREST
None.
ACKNOWLEDGEMENTS
We are indebted to Xiaoxia Gao for expert technical assistance with the fish facility. This work was supported by Chinese NSFC grants (31771628), the Guangdong Natural Science Fund for Distinguished Young Scholars (2017A030306024) and Initial Program of Excellent Young High School Teachers, Guangdong, China (Yue Jiaoshi Han [2016]6: YQ2015081).
AUTHOR CONTRIBUTIONS
All listed authors meet the requirements for publication. JJZ and HXH designed the research; HXH, HL, FL, YFW and ZGY performed the research. JJZ, HXH and HL analyzed the data; and HXH and JJZ wrote the paper. All authors read and approved the final manuscript.
Huang HX, Lin H, Lan F, Wu YF, Yang ZG, Zhang JJ. Application of bone transgenic zebrafish in antiosteoporosis chemical screening. Anim Models Exp Med. 2018;1:53–61. 10.1002/ame2.12000
Hong‐xin Huang and Hao Lin contributed equally to this work.
REFERENCES
- 1. Maeda SS, Lazaretti‐Castro M. An overview on the treatment of postmenopausal osteoporosis. Arq Bras Endocrinol Metabol. 2014;58:162–171. [DOI] [PubMed] [Google Scholar]
- 2. Xia B, Xu B, Sun Y, et al. The effects of Liuwei Dihuang on canonical Wnt/beta‐catenin signaling pathway in osteoporosis. J Ethnopharmacol. 2014;153:133–141. [DOI] [PubMed] [Google Scholar]
- 3. Peng S, Zhang G, He Y, et al. Epimedium‐derived flavonoids promote osteoblastogenesis and suppress adipogenesis in bone marrow stromal cells while exerting an anabolic effect on osteoporotic bone. Bone. 2009;45:534–544. [DOI] [PubMed] [Google Scholar]
- 4. Guo Y, Li Y, Xue L, et al. Salvia miltiorrhiza: an ancient Chinese herbal medicine as a source for anti‐osteoporotic drugs. J Ethnopharmacol. 2014;155:1401–1416. [DOI] [PubMed] [Google Scholar]
- 5. Liao JM, Zhu QA, Lu HJ, Li QN, Wu T, Huang LF. Effects of total coumarins of Cnidium monnieri on bone density and biomechanics of glucocorticoids‐induced osteoporosis in rats. Zhongguo Yao Li Xue Bao. 1997;18:519–521. [PubMed] [Google Scholar]
- 6. Huang W, Yang S, Shao J, Li YP. Signaling and transcriptional regulation in osteoblast commitment and differentiation. Front Biosci. 2007;12:3068–3092. [DOI] [PMC free article] [PubMed] [Google Scholar]
- 7. Li N, Felber K, Elks P, Croucher P, Roehl HH. Tracking gene expression during zebrafish osteoblast differentiation. Dev Dyn. 2009;238:459–466. [DOI] [PubMed] [Google Scholar]
- 8. Du SJ, Frenkel V, Kindschi G, Zohar Y. Visualizing normal and defective bone development in zebrafish embryos using the fluorescent chromophore calcein. Dev Biol. 2001;238:239–246. [DOI] [PubMed] [Google Scholar]
- 9. Fleming A, Sato M, Goldsmith P. High‐throughput in vivo screening for bone anabolic compounds with zebrafish. J Biomol Screen. 2005;10:823–831. [DOI] [PubMed] [Google Scholar]
- 10. Mari‐Beffa M, Santamaria JA, Murciano C, et al. Zebrafish fins as a model system for skeletal human studies. Sci World J. 2007;7:1114–1127. [DOI] [PMC free article] [PubMed] [Google Scholar]
- 11. Spoorendonk KM, Peterson‐Maduro J, Renn J, et al. Retinoic acid and Cyp26b1 are critical regulators of osteogenesis in the axial skeleton. Development. 2008;135(22):3765–3774. [DOI] [PubMed] [Google Scholar]
- 12. Canalis E, Mazziotti G, Giustina A, Bilezikian JP. Glucocorticoid‐induced osteoporosis: pathophysiology and therapy. Osteoporos Int. 2007;18:1319–1328. [DOI] [PubMed] [Google Scholar]
- 13. Weinstein RS. Clinical practice. Glucocorticoid‐induced bone disease. N Engl J Med. 2011;365:62–70. [DOI] [PubMed] [Google Scholar]
- 14. Thiele S, Baschant U, Rauch A, Rauner M. Instructions for producing a mouse model of glucocorticoid‐induced osteoporosis. Bonekey Rep. 2014;3:552. [DOI] [PMC free article] [PubMed] [Google Scholar]
- 15. Barrett R, Chappell C, Quick M, Fleming A. A rapid, high content, in vivo model of glucocorticoid‐induced osteoporosis. Biotechnol J. 2006;1:651–655. [DOI] [PubMed] [Google Scholar]
- 16. De Vrieze E, van Kessel MA, Peters HM, Spanings FA, Flik G, Metz JR. Prednisolone induces osteoporosis‐like phenotype in regenerating zebrafish scales. Osteoporos Int. 2014;25:567–578. [DOI] [PubMed] [Google Scholar]
- 17. Javidan Y, Schilling TF. Development of cartilage and bone. Methods Cell Biol. 2004;76:415–436. [DOI] [PubMed] [Google Scholar]
- 18. Kimmel CB, DeLaurier A, Ullmann B, Dowd J, McFadden M. Modes of developmental outgrowth and shaping of a craniofacial bone in zebrafish. PLoS ONE. 2010;5:e9475. [DOI] [PMC free article] [PubMed] [Google Scholar]
- 19. Westerfield . The Zebrafish Book. Eugene: University of Oregon Press; 2007. [Google Scholar]
- 20. Spoorendonk KM, Peterson‐Maduro J, Renn J, et al. Retinoic acid and Cyp26b1 are critical regulators of osteogenesis in the axial skeleton. Development. 2008;135:3765–3774. [DOI] [PubMed] [Google Scholar]
- 21. Walker MB, Kimmel CB. A two‐color acid‐free cartilage and bone stain for zebrafish larvae. Biotech Histochem. 2007;82:23–28. [DOI] [PubMed] [Google Scholar]
- 22. Nakashima K, Zhou X, Kunkel G, et al. The novel zinc finger‐containing transcription factor osterix is required for osteoblast differentiation and bone formation. Cell. 2002;108:17–29. [DOI] [PubMed] [Google Scholar]
- 23. Fleming A, Keynes R, Tannahill D. A central role for the notochord in vertebral patterning. Development. 2004;131:873–880. [DOI] [PubMed] [Google Scholar]
- 24. Canalis E, Delany AM. Mechanisms of glucocorticoid action in bone. Ann N Y Acad Sci. 2002;966:73–81. [DOI] [PubMed] [Google Scholar]
- 25. Shi XM, Chutkan N, Hamrick MW, Isales CM. Mechanism of glucocorticoid‐induced osteoporosis: an update. InTch. 2012;chapter 3: 41–60. [Google Scholar]


