

SUMMARY
Tumor growth and relapse are driven by tumor propagating cells (TPCs). However, mechanisms regulating TPC fate choices, maintenance, and self-renewal are not fully understood. Here, we show that Van Gogh-like 2 (Vangl2), a core regulator of the non-canonical Wnt/planar cell polarity (Wnt/PCP) pathway, affects TPC self-renewal in rhabdomyosarcoma (RMS)—a pediatric cancer of muscle. VANGL2 is expressed in a majority of human RMS and within early mononuclear progenitor cells. VANGL2 depletion inhibited cell proliferation, reduced TPC numbers, and induced differentiation of human RMS in vitro and in mouse xenografts. Using a zebrafish model of embryonal rhabdomyosarcoma (ERMS), we determined that Vangl2 expression enriches for TPCs and promotes their self-renewal. Expression of constitutively active and dominant-negative isoforms of RHOA revealed that it acts downstream of VANGL2 to regulate proliferation and maintenance of TPCs in human RMS. Our studies offer insights into pathways that control TPCs and identify new potential therapeutic targets.
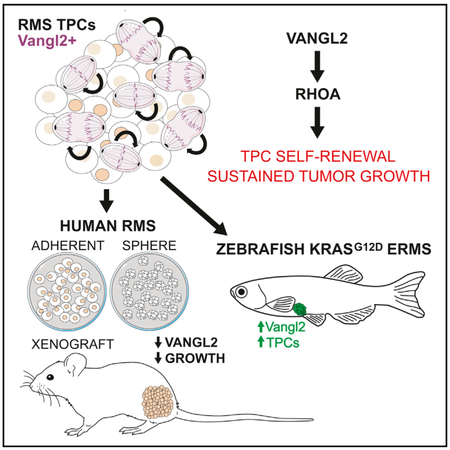
Graphical Abstract
In Brief
Hayes et al. find that Vangl2 specifically labels progenitors that sustain growth and self-renewal in both zebrafish and human rhabdomyosarcoma and is required for their maintenance. This work reveals direct regulation of stem cell programs and tumor growth by Vangl2/RhoA signaling, offering opportunities for direct assessment and therapeutic targeting.
INTRODUCTION
Continued tumor growth and relapse are driven by tumor propagating cells (TPCs) that share self-renewal properties with non-transformed stem cells (Kreso and Dick, 2014). For example, TPCs undergo self-renewal cell divisions to produce daughter cells with identical characteristics, ultimately expanding the pool of cells capable of driving tumor growth, elevating metastasis, and evading therapy (Kreso and Dick, 2014). TPCs can also divide asymmetrically to maintain the overall number of tumor-sustaining cells while also producing differentiated cells that have specialized functions necessary to support cancer progression and invasion (Ignatius et al., 2012; Kreso and Dick, 2014). Despite shared commonalities with normal stem cells, the molecular mechanisms regulating TPC fate specification, proliferation, and self-renewal are largely unknown, especially in pediatric sarcomas (Dela Cruz, 2013; Friedman and Gillespie, 2011). In addition, identifying molecular markers of TPCs has been elusive in many cancer cell types, making specific characterization and therapeutic targeting difficult to achieve in the clinical setting. Yet, it is clear that TPCs drive tumor growth and are retained in a subset of patients to cause local relapse and metastasis (Dela Cruz, 2013; Kreso and Dick, 2014). Thus, there is strong impetus to identify molecularly defined TPCs, understand the mechanisms that regulate proliferation and self-renewal, and uncover genetic vulnerabilities that can be exploited to differentiate and/or kill these tumor-sustaining cells.
The Wnt/planar cell polarity (Wnt/PCP) signaling pathway is essential during embryogenesis and for tissue homeostasis in adults (Seifert and Mlodzik, 2007). Wnt/PCP signaling acts independent of β-catenin and is regulated by pathway-specific components such as Van Gogh (VANGL1 and VANGL2 in humans) that restrict Wnt/Frizzled activity to polarize epithelium and orient the motility of mesendodermal tissues (Peng and Axelrod, 2012; Seifert and Mlodzik, 2007). Vangl2 is a predicted four-pass transmembrane protein, yet lacks any known receptor or enzymatic activity (Murdoch et al., 2001). Rather protein-protein interaction domains of Vangl2 modulate downstream signaling, including the activation of Rac1 and RhoA (Schlessinger et al., 2009; Seifert and Mlodzik, 2007). Despite well-known roles for the Wnt/ PCP pathway during development, defined roles in cancer are just now beginning to emerge. For example, oncogenic roles for non-canonical Wnt proteins have been linked to elevated cell motility, increased metastasis, and reduced patient survival in breast, liver, colon, and lung cancer (Gujral et al., 2014; Puvirajesinghe et al., 2016; Yagyu et al., 2002). Yet, a specific role for Wnt/PCP components in regulating TPC fate or expanding overall pools of tumor-sustaining cell types has not been established.
Rhabdomyosarcoma (RMS), a pediatric cancer of muscle, has emerged as a powerful experimental platform to assess cancer stem cell biology and to identify novel paradigms for cancer growth that extend to a wide array of malignancies (Ignatius et al., 2012; Satheesha et al., 2016; Walter et al., 2011). RMS is comprised of two main molecular subtypes. Alveolar RMS (ARMS) display characteristic genomic translocations of the PAX3-FOXO1 or PAX7-FOXO1 loci accompanied by few additional genomic changes (Shern et al., 2014). In contrast, RAS pathway activation is the dominant oncogenic driver in 90% of human embryonal RMS (ERMS) (Chen et al., 2013; Langenau et al., 2007; Shern et al., 2014). Both RMS subtypes exhibit features of skeletal muscle arrested at early stages of embryonic development and display molecular characteristics consistent with a block in differentiation within the myogenic hierarchy. Importantly, TPCs have been identified in human and animal models of ERMS (Ignatius et al., 2012; Langenau et al., 2007; Satheesha et al., 2016; Walter et al., 2011). For example, we have used a fluorescent transgenic zebrafish model of kRASG12D-induced ERMS to define markers of intra-tumor heterogeneity and to isolate molecularly defined TPCs (Ignatius et al., 2012; Langenau et al., 2007). Importantly, the same developmental hierarchies controlling muscle regeneration are recapitulated in ERMS, with TPCs sharing similar molecular pathway activation and gene expression markers with activated muscle satellite stem cells. Building on these commonalities, we have identified Wnt/β-catenin, Notch, and myogenic transcription factor signaling pathways as modulators of TPC function in embryonal rhabdomyosarcoma, a role that is conserved from zebrafish to human (Chen et al., 2014; Ignatius et al., 2017; Tenente et al., 2017). This work highlights the power of the zebrafish model to characterize conserved stem cell pathways that drive TPC growth and maintenance that are shared in development, regeneration, and cancer.
Here, we show that VANGL2 is highly expressed in a large majority of primary human RMS and within the proliferating RMS progenitor-like cells. VANGL2 depletion led to decreased cell proliferation, reduced in vitro sphere colony formation, and differentiation of ERMS cells in vitro. Moreover, VANGL2 was required for continued xenograft growth and maintenance following engraftment of human RMS into mice. Using the kRASG12D-induced zebrafish ERMS model and fluorescent transgenic approaches to label RMS cells based on cellular differentiation status, we defined roles for Vangl2 in regulating TPC self-renewal and growth. Studies in human RMS showed that RHOA functions downstream of VANGL2 to regulate in vitro growth and sphere colony formation, a surrogate for self-renewal in ERMS. This mechanistic link between VANGL2, RHOA and TPC biology suggests mechanisms that drive RMS growth by specifically modulating a highly conserved stem cell self-renewal program.
RESULTS
VANGL2 Is Highly Expressed in Human Rhabdomyosarcoma
We previously identified a role for activated canonical Wnt/β-catenin signaling in driving differentiation of human RMS (Chen et al., 2014). Wnt/β-catenin signaling is normally suppressed in RMS and activation leads to TPC differentiation, reduced selfrenewal, and suppressed tumor growth both in vitro and in animal models. Given that Wnt/β-catenin signaling also drives terminal differentiation in normal muscle development and can be antagonized by non-canonical Wnt pathways (Brack et al., 2008; McCoy et al., 2011; Nemeth et al., 2007), we investigated the possibility that alternative Wnt signaling pathway components affect RMS tumor biology.
RNA sequencing (RNA-seq data) (GEO: GSE108022) from primary patient samples described in Shern et al. (2014) was analyzed. 151 genes from the GSEAsig database (KEGG_WNT_SIGNALING_PATHWAY) and others from the literature that represent Wnt signaling molecules or targets were selected and each was assessed for expression in human RMS subtypes. From this analysis, we identified significant upregulation of genes associated with the non-canonical Wnt/PCP signaling pathway in both fusion-negative and fusion-positive RMS (Figure 1A). This included upregulation of Wnt ligands (WNT5B, WNT7A/B), Frizzled receptors (FZD2), and regulatory proteins (CELSR1/3, VANGL2, and PTK7) (Figure 1A, p < 0.01). We were particularly interested in VANGL2, because Vangl proteins are essential regulators of Wnt/PCP signaling that have been well characterized in development and regeneration (von Maltzahn et al., 2012; Seifert and Mlodzik, 2007). Moreover, unlike Wnt ligands and Frizzled receptors, Vangl proteins display minimal cross talk with the Wnt/β-catenin signaling pathway, making them useful targets to specifically interrogate Wnt/PCP signaling.
Figure 1. VANGL2 Is Highly Expressed in Human RMS Subtypes.

(A) Normalized expression (FPKM) for Wnt/PCP-associated genes from RNA sequencing of normal muscle, fusion-negative (FUS NEG), and fusion-positive (FUS POS) RMS samples. Each datum point represents an individual sample. The mean expression is noted by a horizontal bar with significance denoted by asterisks (*p < 0.01; n.s., not significant, Student’s t test).
(B) Normalized expression data (FPKM) depicting Van Gogh-like 2 (VANGL2) in normal muscle, fusion-negative, PAX3-FOXO1 and PAX7-FOXO1 patient samples (p = 0.0009 for fusion-negative, p = 0.0.0031 for PAX3-FOXO1, p = 0.0011 for PAX7-FOXO1, Student’s t test comparison to normal muscle).
(C) Quantitative real-time PCR analysis of VANGL2 in an independent cohort of normal muscle, RMS cell lines (RD, Rh18, Rh6), fusion-negative, and fusion-positive patient RMS samples (p < 0.05 for all samples, relative to muscle).
(D) Western blot analysis of human RMS cell lines. GAPDH is used as a loading control.
(E) Immunohistochemistry showing VANGL2 and H&E stained sections of representative primary human ERMS and ARMS. Arrowheads highlight VANGL2+ cells. Scale bar, 100 μm.
(F) Quantification of the percentage of VANGL2+ cells found in primary ERMS and ARMS.
Analysis of RNA sequencing data revealed that VANGL2 was upregulated in nearly all human RMS, regardless of subtype (n = 61 of 62 fusion-negative, 23 of 23 PAX3-FOXO1 fusion-positive, and 8 of 8 PAX7-FOXO1 fusion-positive root-mean-square (RMS, ≥ 3 SDs over the mean when compared to normal skeletal muscle, p = 0.0009 for fusion-negative, p = 0.0.0031 for PAX3-FOXO1, p = 0.0011 for PAX7-FOXO1, Student’s t test comparison to normal muscle, Figure 1B). By contrast, VANGL1 was not differentially regulated in RMS when compared with normal muscle (Figure 1A). VANGL2 was also highly expressed in an independent cohort of 12 primary patient samples when assessed by qRT-PCR (p < 0.05, Student’s t test, Figure 1C), and high protein levels were detected in a panel of human ERMS and ARMS cell lines (Figure 1D). IHC staining of pediatric RMS samples revealed VANGL2 was expressed in the majority of primary patient ERMS and ARMS (n = 43/55 ERMS and n = 14/18 ARMS, Figures 1E, 1F, S1A, and S1B). VANGL2 was detected in <10% of RMS cells in most cases (n = 39/55 ERMS and n = 13/18 ARMS, Figures 1E, 1F, S1A, and S1B), suggesting rarity of VANGL2+ cells and an underlying functional heterogeneity based on expression of this marker. VANGL2 expression was also confined to a fraction of sarcoma cells within Wilms tumor, synovial sarcoma, and desmoplastic small round cell tumor (TA-23, Stanford University Medical Centre, Figure S1C). Together, these data prompted us to further investigate VANGL2 in the context of tumor cell growth and TPC function.
VANGL2 Affects Growth and Differentiation of Human RMS
To assess the functional significance of VANGL2 in human RMS, VANGL2 was knocked down using two short hairpin RNAs in PAX3-FOXO1 fusion-positive ARMS (Rh30) and fusion-negative ERMS (RD) cells (>90% knockdown, Figures 2A and 2E). By 3 days post infection, Rh30 and RD cells depleted of VANGL2 exhibited a large, rounded morphology compared to the characteristic spindle shape observed in shSCRAMBLE (shSCRM)-infected cells (Figures 2B and 2F). Nuclei counts revealed that loss of VANGL2 significantly inhibited RMS growth in vitro (Figures 2C and 2G). Analysis of 5-ethynyl-2’deoxyuridine (EdU)-incorporation by flow cytometry showed significant inhibition of cell proliferation with a >7-fold reduction in S-phase cycling cells following knockdown of VANGL2 at 72 hr (Figures 2D and 2H, p < 0.0001, Student’s t test). This data showed that VANGL2 is required for human RMS tumor growth, acting predominantly through regulation of cell proliferation.
Figure 2. VANGL2 Is Required for Growth of Human RMS Cells.

(A–D) Phenotypic analysis for Rh30 fusion-positive ARMS cells. (A) Western blot analysis following scramble small hairpin RNA (shRNA) (shSCRM) and VANGL2 shRNA (shVL2(1), shVANGL2(2)) knockdown. GAPDH is used as a loading control. (B) Bright-field images of Rh30 cells at 4 days post infection. VANGL2 knockdown cells with prominent rounded cellular morphology are denoted (black arrow). Scale bar, 10 μm. (C) Cell counts performed at 24 and 48 hr post plating equal numbers of shRNA-infected cells (24 hr post infection). Cell number is normalized to 0 hr. (D) EdU and propidium iodide (PI) flow cytometry analysis of cell cycle in Rh30 cells at 4 days post infection.
(E–L) Phenotypic analysis of RD fusion-negative ERMS cells. (E) Western blot analysis for VANGL2, PAX7, and MYOG protein expression in shSCRM and shVL2-infected RD cells. GAPDH is used as a loading control. (F) Bright-field images of RD cells after 4 days post infection with rounded cellular morphology denoted by black arrow. Scale bar, 10 μm. (G) RD cell counts performed at 24 and 48 hr post plating equal numbers of shRNA-infected cells (24 hr post infection). Cell number is normalized to 0 hr. (H) EdU and propidium iodide (PI) flow cytometry analysis of cell cycle in RD cells 4 days post infection. (I) Quantitative real-time PCR gene expression analysis of muscle progenitor genes PAX3, PAX7, and MET, and differentiated genes M-CADHERIN (MCAD), MYOD, and MYOGENIN (MYOG). (J) Immunofluorescence staining for PAX7 (red) and MYOG (green) in scramble shRNA (shSCRM) and VANGL2 shRNA-infected RD cells. (K) Quantification of cellular PAX7 fluorescent intensity in shRNA-treated RD cells. (L) Quantification of MYOG-positive cells. *p < 0.05, **p < 0.01, ***p < 0.001, Student’s t test. Error bars represent SD.
Human RD ERMS cells differentiate along a developmental hierarchy similar to that which occurs during myogenesis and regeneration (Keller and Guttridge, 2013). To test the effect of VANGL2 loss on RMS differentiation, we next assessed myogenic regulatory factors that are expressed at specific stages of muscle differentiation. Compared to control shSCRM-infected cells, VANGL2 knockdown led to a dramatic decrease in the expression of genes associated with progenitor-like cells including PAX3, PAX7, and MET (Figure 2I, p < 0.01, Student’s t test). Conversely, markers of differentiation were significantly upregulated following VANGL2 knockdown, including MCAD, MYOD, and MYOG (Figure 2I, p < 0.01, Student’s t test). Differences in PAX7 and MYOG protein expression were confirmed by western blot analysis (Figure 2E) and immunofluorescence, with these latter experiments revealing a significant decrease in PAX7 at the cellular level in VANGL2-depleted cells (Figures 2J–2L, p < 0.001, Student’s t test). Moreover, a dramatic increase in the overall number of differentiated MYOG-positive cells was observed following VANGL2 depletion (Figures 2J and 2L, p < 0.001, Student’s t test). These data are consistent with VANGL2 having important roles in maintenance of progenitor-like cell fates in human RMS.
Next, we assessed a role for VANGL2 in growth and differentiation of human RMS in vivo using engraftment of control and VANGL2-depleted RD ERMS, SMSCTR ERMS, and Rh30 ARMS cells into the flanks of NOD/SCID/IL2Rγ null (NSG) female mice. Cells were labeled with firefly luciferase and engrafted animals were imaged weekly to observe differences in tumor growth over time (Figures 3A, 3B, and S2). Tumors derived from VANGL2-depleted cells displayed inhibition of growth by 28 days when monitored by total body luciferase imaging (Figures 3C–3E, p < 0.001 for RD and Rh30, p = 0.03 for SMSCTR compared to shSCRM, Student’s t test). This was in contrast to shSCRM-infected control tumor cells, which increased >30-fold (Figures 3A–3E, p < 0.01, Student’s t test). At necropsy, 6 of 12 VANGL2-depleted RD-derived tumors and 7 of 12 VANGL2-depleted SMSCTR-derived tumors had fully regressed (Figures S2C and S2I). The remaining VANGL2-depleted ERMS tumors were significantly smaller and weighed less than controls (Figures S2D, S2E, S2J, and S2K, p < 0.001, Student’s t test). Excised tumors derived from VANGL2-depleted RD cells also exhibited reduced cellularity compared to controls (Figures 3F, 3K, and 3P). Ki67 staining also revealed fewer proliferative cells in VANGL2 knockdown RD and SMSCTR ERMS tumors when compared to shSCRM-infected controls (Figures 3G, 3L, 3Q, S2M, and S2Q, p < 0.001, Student’s t test), while tumors displayed no significant increase in cleaved caspase 3 (CC3) (Figures 3H, 3M, 3R, S2N, and S2R). In addition, both RD and SMSCTR VANGL2-depleted cells displayed dramatic increases in the number of differentiated RMS cells when assessed by IHC for MYOD (Figures 3I, 3N, and 3S, p <0.001, Student’s t test) and MYOG (Figures 3J, 3O, 3T, S2O, and S2S, p < 0.001, Student’s t test), further supporting a role for VANGL2 in the maintenance of ERMS progenitor cell fate.
Figure 3. VANGL2 Is Required for Xenograft Growth and Inhibits Tumor Cell Differentiation In Vivo.

(A and B) Luciferase bioluminescent imaging of mice engrafted with bulk RD cells infected with scramble shRNA (left, scr) or VANGL2 shRNAs (right, shVL2). Representative animals are shown immediately after injection (A, 0 days) and 28 days post injection (B).
(C–E) Quantification of tumor size based on bioluminescence relative to day 0 for (C) RD, (D) SMSCTR, and (E) Rh30 xenograft experiments infected with scramble shRNA (shSCRM) or VANGL2 shRNAS (shVL2(1) and shVL2(2)). n ≥ 6 animals/arm. Experiments shown for SMSCTR were completed on different days with control shSCRM results compiled across experiments. Independent shSCRM experiments are shown in Figure S2.
(F–O) Histological characterization of scramble (F–J) and VANGL2 shRNA-infected RD xenografted tumors (K–O). Representative images of H&E-stained sections (F and K), IHC for Ki67 (G and L), cleaved caspase 3 (CC3) (H and M), MYOD (I and N), and MYOG (J and O).
(P) Quantification of nuclei counts/tumor area.
(Q) Percentage of Ki67-positive cells within tumors.
(R) Percentage of ERMS cells that stained for activated caspase 3 (CC3). Quantification of immunohistochemical analysis for MYOD (S) and MYOG (T) are also shown. *p < 0.05, **p < 0.01, ***p < 0.001; n.s., not significant, Student’s t test. Error bars represent SD. Scale bar, 100 μm.
In contrast to the xenograft studies using human ERMS, Rh30 ARMS tumors regrew after near complete tumor loss when assessed by luciferase bioluminescent imaging at 28 days (Figure 3E). Knockdown and control mice had similar sized tumors at necropsy by 60 days post engraftment (Figures S2V–S2X). IHC staining showed that Rh30-derived tumors that grew out lacked the lentiviral vector and regained VANGL2 expression equal to or greater than shSCRM-infected control cells (Figure S2Z). These data suggest that late-stage emergence of Rh30 ARMS resulted from growth of rare, uninfected cells introduced at the time of injection. Together, our results show that VANGL2 has important roles in regulating tumor growth and maintenance in vivo for both ERMS and ARMS.
VANGL2 Is Expressed in Proliferating Progenitor-like Cells in Human RMS
To characterize VANGL2 expression within heterogeneous cell types in RMS, human RD and Rh30 cells were assessed by immunofluorescence and co-stained with makers of proliferation and myogenic cell state. Confocal microscopy revealed that only a fraction of human RMS cells expressed VANGL2 (Figure 4A). Notably, the majority of VANGL2 expressing cells were actively dividing when assessed by DAPI and Ki67 staining (Figures 4B–4K). This was in contrast to cells expressing low levels of VANGL2, which were largely non-mitotic (Figures 4J and 4K, p < 0.001, Student’s t test). At the subcellular level, VANGL2 localized to the poles of cellular doublets in telophase (Figures 4G–4I), consistent with observations made during development where Vangl2 localizes to opposite ends of the axis in polarized, actively dividing satellite cells (Le Grand et al., 2009). Moreover, co-staining revealed that >80% of VANGL2+ cells co-expressed high levels of PAX7 (Figures 4A–4D), a marker of progenitor cell fate in muscle (Buckingham and Relaix, 2015). Interestingly, VANGL2+ cells also expressed the highest levels of FGFR3 and CD133 (Figures 4L, 4M, and S3). These markers have been previously associated with progenitor-like properties in RMS cells (Hirotsu et al., 2009; Pressey et al., 2013; Walter et al., 2011), suggesting that VANGL2 may be both a marker of TPCs and be required for self-renewal.
Figure 4. VANGL2 Is Expressed in Proliferating Progenitor Cells and Is Required for 3D Rhabdosphere Colony Formation.

(A–K) VANGL2 expressing cells express high levels of progenitor cell markers and are highly mitotic. (A–G) Immunofluorescent staining of VANGL2 and PAX7 in RD cells. VANGL2 is co-expressed with the PAX7 progenitor cell marker (white arrowhead in A). (B–D) High-magnification image of the VANGL2+/PAX7+ cell denoted in (A) by arrow. (E–G) Representative images of VANGL2+/PAX7+ cells undergoing mitotic division. (H and I) VANGL2 and Ki67 staining in RD (H) and Rh30 (I) cells. (J and K) Correlation of PAX7 and mitosis in VANGL2-high versus VANGL2-low expressing RD (J) and RH30 (K) cells.
(L and M) VANGL2 is co-expressed with FGFR3 (L) and CD133 (M) in human RD cells. Merged and single fluorescent channel images are shown.
(N–P) VANGL2 is highly expressed in 3D rhabdosphere culture as assessed by western blot analysis for RD (N), Ruch2 (O), and Rh36 (P).
(Q–V) Rhabdospheres stably expressing scramble shRNA (shSCRM) or VANGL2 shRNA (shVL2) shown at 10 for RD and Ruch2 ERMS cells and 20 days for Rh36 cells (104 cells plated per well).
(W–Y) Quantification of rhabdosphere colony formation (104and 103 cells/plated per well, quantification at 10 days for RD and Ruch2 cells and at 20 days for Rh36 cells). Representative experiments showing average colony number of three technical replicates. Three independent experiments (n = 3) for each cell line were performed with a similar effect observed across all biological replicates. ***p < 0.001, compared to colony formation in shRNA control cells. Error bars represent SD.
Vangl2 Is Required for Maintenance of TPCs in Human RMS
Human RD, Ruch2, and Rh36 ERMS cells can be efficiently grown as 3D rhabdospheres, which are 100-fold more tumorigenic than adherent cells when xenografted into immunedeficient mouse models and upregulate genes associated with stemness (Walter et al., 2011). Thus, rhabdosphere colony formation assays have become a powerful tool to estimate self-renewal in a subset of human ERMS and to identify pathways required for TPC maintenance and growth (Chen et al., 2014; Satheesha et al., 2016). Western blot analysis displayed upregulation of VANGL2 in RD, Ruch2, and Rh36 rhabdospheres (Figures 4N–4P), suggesting possible association between VANGL2 and TPCs in human ERMS. We next assessed the requirement for VANGL2 during rhabdosphere colony formation. Specifically, control shSCRM and shVANGL2-infected RD, Ruch2, and Rh36 cells were plated at limiting cell dilution in stem cell media and the number of colonies was quantified after 10–20 days of growth (Figures 4Q–4Y). VANGL2 depletion led to a dramatic decrease in colony formation (Figures 4W–4Y, p < 0.001) and culturing VANGL2 knockdown cells for more than 30 days in stem cell media failed to identify outgrowth of colonies, indicating a major requirement for VANGL2 in regulating rhabdosphere formation and in the maintenance of human RMS TPCs. Interestingly, VANGL2 was also upregulated in Rh30 ARMS cells grown in sphere media and depletion similarly led to inhibition of rhabdosphere formation (Figure S7), suggesting an association between VANGL2 and sphere colony formation in RMS regardless of subtype.
Vangl2 Increases TPCs in Zebrafish ERMS
VANGL2 is uniquely expressed in human RMS progenitor-like cells, is required for maintenance of cellular identity, and is required for rhabdosphere colony formation (a surrogate for assessing TPC number and function in vitro), suggesting an important role for Vangl2 in growth and maintenance of less differentiated tumor propagating cells in human RMS. To identify oncogenic roles for Vangl2 in regulating the overall frequency of self-renewing TPCs, we next utilized a syngeneic zebrafish model of kRASG12D-induced ERMS and performed cell transplantation experiments to quantity differences in RMS that express only kRASG12D with those that transgenically co-express kRASG12D and Vangl2. Importantly, the zebrafish kRASG12D-induced ERMS shares molecular and histopathological features with human RMS and has become a valuable model to assess conserved pathways that regulate TPC function in vivo (Chen et al., 2014; Ignatius et al., 2017; Langenau et al., 2007; Tenente et al., 2017).
Zebrafish ERMS were generated to transgenically express kRASG12D and GFP with and without Vangl2. In these studies, transgenic expression was driven by the minimal 6.5 kB rag2 promoter, which drives expression in muscle progenitors due to uncovering a myoD enhancer site (Langenau et al., 2007). Tumor formation was observed as early as 15 days in both kRASG12D alone and kRASG12D + Vangl2 ERMS, with no overt differences in latency, penetrance, or tumor size (Figure S4). H&E staining confirmed similar histology between kRASG12D alone and Vangl2 expressing ERMS (Figures S4B and S4D). Together, our data suggest minimal effects of Vangl2 overexpression on tumor initiation.
Next, we tested the effect of Vangl2 on modulating the overall fraction of TPCs using limiting dilution cell transplantation into syngeneic zebrafish. Highly purified GFP+ ERMS cells were isolated and introduced into syngeneic transplant recipient animals at limiting dilution (>90% purity and viability). Animals were followed for tumor onset for 90 days and TPC frequency quantified using the extreme limiting dilution analysis (ELDA) program. From these experiments, we observed an increase in overall engraftment rates of ERMS cells that transgenically expressed both kRASG12D and Vangl2 (28/67 total engrafted tumors from n = 3 independent kRASG12D ERMS and 43/65 total engrafted tumors from n = 3 independent kRASG12D + Vangl2 ERMS, p = 0.004 Fisher exact test, Figures 5A–5F). ELDA revealed a 9-fold increase in TPCs in kRASG12D + Vangl2 ERMS (Figures 5E and 5F; Table S1; p < 0.001, ELDA). Transgenic expression of Vangl2 also led to significant downregulation of markers associated with muscle differentiation including myod and myog (n = 3 tumors analyzed/genotype, Figure 5G, p < 0.01, two-way ANOVA). GFP-positive ERMS tumor cells did not have significant differences in myf5 or c-met expression (Figure 5G), suggesting a role for Vangl2 in regulating TPC fate by specifically inhibiting cellular differentiation.
Figure 5. Vangl2 Elevates Tumor Propagating Cell Number 9-Fold in Zebrafish kRASG12D-Induced ERMS.

(A–D) Representative images of syngeneic zebrafish engrafted with 1 – 104 sorted GFP+ ERMS cells and analyzed at 30 days post transplantation. ERMS expressing rag2:kRASG12D + rag2:GFP (A and B) or rag2:kRASG12D + rag2:Vangl2 + rag2:GFP (C and D). Representative images of tumor histology (B and D).
(E) Quantification of fish engrafted with 104, 103, and 102 GFP+ tumor cells that co-expressed rag2:kRASG12D with or without rag2:Vangl2 (data compiled from engraftment of 3 independent tumors/genotype).
(F) Graphical analysis of extreme limiting dilution analysis (ELDA) denoting overall engraftment rates at various cell dilutions. Dotted lines represent 95% confidence intervals. Estimated tumor propagating cell number for each genotype is noted (data compiled from engraftment of 3 independent unmixed tumors/genotype). ***p < 0.001.
(G) qRT-PCR gene expression analysis performed on sorted rag2:GFP ERMS cells (independent ERMS are represented and numbered on the x axis). **p < 0.01, ***p < 0.001; n.s., not significant, two-way ANOVA. Error bars denote SD.
Vangl2 Expression Identifies Self-Renewing TPCs in Zebrafish ERMS
A molecularly defined tumor-propagating cell has been identified in zebrafish ERMS (Ignatius et al., 2012; Langenau et al., 2007). This self-renewing TPC expresses satellite cell markers including myf5 and c-met and can be isolated using fluorescent protein expressed under control of muscle transgenic promoters that define specific cell states (Ignatius et al., 2012). For example, ERMS TPCs can be enriched using the myf5:GFP and mylz2:mCherry transgenic reporter lines, with GFP+/mCherry-negative cells exhibiting a >25-fold enrichment for TPCs when compared with more differentiated ERMS cells (Ignatius et al., 2012). Building on these findings, we first assessed if vangl2 was expressed in specific kRASG12D-induced ERMS cell sub-populations. As expected, based on co-expression of VANGL2 and progenitor cell markers in human RMS cells, endogenous vangl2 was highly expressed in myf5:GFP+/mylz2:mCherry− TPCs when compared with more differentiated myf5:GFP+/mylz2:mCherry+ cells (p < 0.001, Student’s t test, Figures S5A–S5C). vangl2 was also expressed in differentiated myf5:GFP−/mylz2:mCherry+ ERMS cells (Figures S5A–S5C), a pattern consistent with a developmental role for Wnt/PCP signaling in polarizing orientation of differentiated myofibers (Gros et al., 2009) and likely unrelated to self-renewal of ERMS TPCs.
To assess if vangl2 expression enriches specifically for TPCs in the zebrafish model, we next utilized a transgenic labeling strategy where mCherry was expressed under the control of the vangl2(−5kb) promoter (vangl2:mCherry) (Sittaramane et al., 2013). This vangl2 promoter drives at near endogenous levels and has been previously used to dynamically visualize Wnt/PCP-dependent developmental processes in vivo (Roszko et al., 2015; Sittaramane et al., 2013). CG1-strain syngeneic zebrafish were injected at the one cell stage with rag2:kRASG12D, rag2:GFP, and vangl2:mCherry transgenes (Figures S6A and S6B). Following tumor expansion into syngeneic recipient fish (Figures S6C and S6D), fluorescent-labeled ERMS cell fractions were purified by FACS (n = 3 tumors/genotype, >90% viability and 80%–95% purity, Figures S6E and S6F) and transplanted into syngeneic recipient animals at limiting dilution (Figures S6G–S6K; Table S2). rag2:GFP+/vangl2:mCherry+ double-positive cells displayed robust engraftment and propagated ERMS with a TPC frequency of 1 in 288 cells (180–461, 95% confidence interval, Figure S6K; Table S2). By contrast, ERMS cells that expressed only rag2:GFP propagated tumors far less efficiently with only 1 in >2,218 cells able to induce tumor formation in the transplantation setting (Figures S6J and S6K; Table S2, p < 0.0001, ELDA). Fluorescence-activated cell sorting (FACS) analysis also revealed a subpopulation of mature vangl2:mCherry single-positive cells that failed to engraft in recipient animals (Figures S6J and S6K), consistent with previous observations that tumor propagating ability is limited to less-mature rag2:GFP+-positive ERMS cell subpopulations (Langenau et al., 2007).
To determine if vangl2:mCherry expression further enriches for ERMS tumor propagating ability over the previously characterized myf5:GFP+ transgenic reporter (Ignatius et al., 2012), we next performed limiting dilution cell transplantation experiments using sorted myf5:GFP/vangl2:mCherry cells from four independent zebrafish ERMS (Figure 6; Table S3). When transplanted at limiting dilution into CG1 syngeneic recipient animals, myf5:GFP+/vangl2:mCherry+ cells efficiently propagated ERMS with an average TPC frequency of 1 in 59.6 and significantly enriched for tumor propagating ability 9-fold when compared to myf5:GFP+/vangl2:mCherry− cells (Figures 6I and 6J; Table S3, p < 0.0001, ELDA). Only 1 in 519 myf5:GFP+/vangl2:mCherry− cells propagated ERMS in syngeneic recipient fish (Figures 6I and 6J; Table S3). Finally, myf5:GFP−/vangl2:mCherry+ cells did not propagate ERMS, consistent with TPCs being confined to less mature myf5:GFP+ ERMS cell subpopulations (Figures 6I and 6J; Table S3) (Ignatius et al., 2012). Together, these data reveal vangl2:mCherry expression as a refined marker of self-renewing ERMS TPCs in vivo that further enriches for engraftment potential over all previously characterized in vivo markers of TPCs.
Figure 6. vangl2:mCherry Enriches for Self-Renewing TPCs in Zebrafish kRASG12D-Induced ERMS.

(A and B) Transgenic zebrafish with primary ERMS expressing vangl2(−5kb):mCherry and Tg(myf5:GFP).
(C–E) Transplant fish engrafted with unsorted myf5:GFP/vangl2:mCherry ERMS shown 30 days post transplantation. Whole animal imaging (C), histology (D), and FACS of ERMS cells obtained at sacrifice (E).
(F–J) Syngeneic zebrafish engrafted with purified myf5:GFP+/vangl2:mCherry+ ERMS cells. Sort purity of engrafted cells is denoted in the lower left panel of (F). Whole animal imaging (F), histology (G), and FACS of ERMS cells obtained at sacrifice (H). (I) Quantification of engraftment of myf5:GFP+/vangl2:mCherry+ (G+R+, yellow), myf5:GFP+/vangl2:mCherry− (G+, green) and myf5:GFP−/vangl2:mCherry+ (R+, red) tumor cells (data are compiled from four independent ERMS and shown as individuals in Table S3, n = 170 recipient fish total). Number of engrafted animals is denoted and percent engraftment annotated by colored bars (+). (J) Graphical analysis of extreme limiting dilution analysis (ELDA) with the fraction of TPCs found in each sorted cell fraction denoted. Dotted lines represent 95% confidence intervals. ***p < 0.001 (data compiled from four independent tumors, as above).
(K) qRT-PCR gene expression analysis performed on sorted myf5:GFP+/vangl2:mCherry+ (G+R+, yellow), myf5:GFP+/vangl2:mCherry− (G+, green), myf5:GFP−/vangl2:mCherry+ (R+, red) and myf5:GFP−/vangl2:mCherry− (NEG, white) cells. Relative expression for each gene is depicted and displayed for each subpopulation. Analysis is representative of two independent tumors (n = 2) run as technical triplicates. myf5:GFP+/vangl2:mCherry+ cells enrich for markers of ERMS TPCs including c-met, myf5, fgfr1a, and fgfr3 (p < 0.01, Student’s t test).
To validate the long-term tumor-propagating potential of vangl2:mCherry+ cells, tumor cell populations were isolated from host animals and serially engrafted following FACS and limiting dilution cell transplantation. In all cases, purified rag2:GFP+/vangl2:mCherry+ or myf5:GFP+/vangl2:mCherry+ TPCs retained long-term engraftment potential (Figures S5E–S5H and S6L–S6O; Tables S2 and S3). Histological analysis of serially passaged tumors revealed similar morphology as primary and early passaged ERMS tumors (Figures S5G and S6N). FACS confirmed that serially passaged tumors were capable of regenerating all cellular subpopulations in zebrafish ERMS, which was independently confirmed by qRT-PCR performed on sorted ERMS cell subfractions (Figure 6K). myf5:GFP+/vangl2:mCherry+ TPCs expressed the satellite cell markers myf5 and c-met and additional markers associated with human RMS TPCs including fgfr1a and fgfr3 (Figures 6K and S5I) (Armand et al., 2003; Goldstein et al., 2007; Hirotsu et al., 2009). By contrast, myf5:GFP+/vangl2:mCherry− cells were more differentiated and expressed higher levels of myog, mylz2, troponin I fast-twitch isoform 2 (tnni2a), and α-actin 1b (acta1b) (Figure 6K, p < 0.01, Student’s t test). Finally, differentiated myf5:GFP−/vangl2:mCherry+ cells expressed the most mature muscle markers including actin-related protein 2/3 complex subunit 5b (arpc5b) and myosin heavy chain 9a (myh9a) (Figure 6K, p < 0.001, Student’s t test), consistent with the observation that these cells do not propagate ERMS and likely represent a subpopulation of non-proliferative and terminally differentiated ERMS cells (Ignatius et al., 2012; Langenau et al., 2007). Our analysis shows that myf5:GFP+/vangl2:mCherry+ ERMS cells are enriched for molecular markers associated with TPCs and retain long-term self-renewal properties, further defining vangl2:mCherry as a marker of ERMS TPCs in vivo.
RHOA Regulates TPC Growth and Maintenance Downstream of VANGL2 in Human RMS
We next wanted to identify pathways downstream of VANGL2 that modulate human RMS growth and TPC function. Because Wnt/PCP signaling typically relies on activation of the Rho-family GTPases RHOA and RAC1 (Schlessinger et al., 2009), we first assessed their expression in adherent and 3D rhabdosphere cells. We observed increased RHOA in RD ERMS, Rh36 ERMS, and Rh30 ARMS rhabdosphere culture compared to adherent cells, coincident with upregulation of VANGL2 (Figures 7A, 7E, and S7A). By contrast, RAC1 protein was not consistently differentially regulated across cell lines in adherent and rhabdosphere growth conditions (Figures S7A, S7L, and S7O), suggesting a limited role for RAC1/JNK signaling in regulating TPC function.
Figure 7. RHOA Regulates TPC Growth and Maintenance Downstream of VANGL2 in Human RMS.

(A) Western blot analysis depicting VANGL2 and RHOA protein in RD cells grown as adherent (2D) cells or in sphere culture for 5 and 10 days. Relative protein expression was normalized to GAPDH.
(B) Western blot of total RHOA and activated RHOA (RHOA-GTP) in RD cells stably infected with scramble shRNA (shSCRM) or VANGL2 shRNA (shVL2(1), shVL2(2)) +/− RHOAV14 or RHOAN19 expression vectors. Relative RHOA/RHOA-GTP protein is indicated for control and VANGL2 knockdown cells.
(C) Quantification of RD rhabdosphere colony number at 10 days (104 cells plated per well). Representative experiment showing average colony number over three technical replicates. Three independent experiments (n = 3) were performed with a similar effect observed across all biological replicates.
(D) Real-time qPCR gene expression analysis of differentiation genes (MCAD, MYOD, MYOG) confirming that RHOAV14 restores VANGL2-depleted cells to a more undifferentiated state.
(E–G) Validation experiments completed using Rh36 ERMS cells. VANGL2 and RHOA protein expression in Rh36 (E) cells grown as adherent (2D) cells or in rhabdosphere culture. Relative protein expression normalized to GAPDH is indicated. (F) Western blot analysis of total RHOA and activated RHOA (RHOA-GTP) in Rh36 cells stably infected with scramble shRNA (shSCRM) or VANGL2 shRNA (shVL2(1), shVL2(2)) +/− RHOAV14 or RHOAN19 expression vectors. Relative RHOA/RHOA-GTP protein is indicated for control and VANGL2 knockdown cells. (G) Quantification of Rh36 rhabdosphere colony number at 20 days (104 cells plated per well). Representative experiment showing average colony number over three technical replicates. Three independent experiments (n = 3) were performed with a similar effect observed across all biological replicates. For all graphs *p < 0.05, **p < 0.01, ***p < 0.001, Student’s t test. Error bars represent SD.
To investigate RHOA activity downstream of VANGL2, we next assessed total RHOA and activated GTP-bound RHOA in control and VANGL2 knockdown RD, Rh36, and Rh30 cells (Figures 7B, 7F, and S7H). Interestingly, we observed reductions of total and activated forms of RHOA in VANGL2-depleted RMS cells (Figures 7B, 7F, and S7H), suggesting RHOA is required downstream of VANGL2 to maintain TPCs and to elevate overall tumor propagating potential. Importantly, our results show that both RHOA activation and expression are modulated downstream of VANGL2, consistent with reports from other groups showing this duality of control by VANGL2 (Phillips et al., 2005). By contrast, activated GTP-bound RAC1 was not consistently differentially regulated following VANGL2 knockdown (Figures S7J, S7M, and S7P).
We next performed epistasis experiments using constitutively active and dominant-negative forms of RHOA and RAC1 and assessed restoration of RMS colony growth in vitro. Specifically, control and VANGL2-depleted RD ERMS, Rh36 ERMS, and Rh30 ARMS cells were infected with constitutively active (RHOAV14, RAC1V12) or dominantnegative (RHOAN19, RAC1N17) forms of human RHOA or RAC1 and assessed in rhabdosphere colony formation assays (Figures 7C, 7G, and S7). Constitutively active RHOAV14 stimulated rhabdosphere colony formation in control cells (p < 0.01 for RD and Rh36, p = 0.033 for Rh30, Figures 7C, 7G, S7D, and S7I) while dominant-negative RHOAN19 reduced rhabdosphere formation (Figures 7C, 7G, S7F, and S7I, p < 0.05, Student’s t test). RHOAV14 also rescued rhabdosphere colony formation in VANGL2-depleted RMS cells (p < 0.001, Figures 7C, 7G, S7E, and S7I, p < 0.01, Student’s t test), while dominant-negative RHOAN19 failed to rescue rhabdosphere formation (Figures 7C, 7G, S7G, and S7I). By contrast, neither constitutively active RAC1V12 nor dominant-negative RAC1N17 could restore colony formation to VANGL2-depleted cultures (Figures S7K, S7N, and S7Q). Together, these data support a role for RHOA signaling downstream of VANGL2 in human RMS.
Finally, to investigate the effect of RHOA signaling on RMS TPCs and regulation of their differentiation, we next assessed myogenic factor expression in RD control, VANGL2-depleted, and RHOAV14 expressing cells. As expected, cells depleted of VANGL2 exhibited significant increases in the expression of differentiated muscle gene transcripts when compared with control cells (Figure 7D) while constitutively active RHOAV14 blocked differentiation and retained ERMS cells in a more undifferentiated, self-renewing TPC fate (Figure 7D). Together these data show that RHOA acts downstream of VANGL2 to maintain progenitor-like cell fates in ERMS and modulates the overall numbers of TPCs in human RMS. These functional studies reveal roles for a VANGL2/RHOA signaling axis in regulating sustained tumor growth through maintenance of self-renewing cell divisions.
DISCUSSION
Stem cells have the capacity to self-renew and generate more of themselves, yet these cells can also differentiate into specialized cells with unique functional characteristics. Despite a large body of literature supporting roles for canonical Wnt/β-catenin signaling in regulating stemness and cellular fate (Nusse and Clevers, 2017), alternative Wnt signaling pathways including non-canonical Wnt/PCP signaling are less well understood. Factors associated with non-canonical Wnt signaling pathways are elevated in a large number of human cancers and are linked to poor outcome (Anastas et al., 2012; Asad et al., 2014; Gujral et al., 2014; Ma et al., 2014; Puvirajesinghe et al., 2016; Weeraratna et al., 2002; Yagyu et al., 2002; Yang et al., 2015). VANGL proteins are required for tumor cell proliferation and growth in hepatocellular carcinoma and basal cell breast cancer (Puvirajesinghe et al., 2016; Yagyu et al., 2002) while other functional studies have focused on the role for VANGL proteins and Rho-GTPases in tumor cell invasion and metastasis (Anastas et al., 2012; Asad et al., 2014; Kurayoshi et al., 2006; Ma et al., 2014; Weeraratna et al., 2002; Yang et al., 2015). These features are consistent with known roles for this pathway in regulating migration during normal tissue morphogenesis (Seifert and Mlodzik, 2007; Simons and Mlodzik, 2008). To date, no reports have identified specific roles for the Wnt/PCP pathway in regulating TPC growth, maintenance, or self-renewal. Our work has identified a role for Vangl2 in the maintenance of tumor progenitor cells in both human and zebrafish rhabdomyosarcoma. Moreover, our work shows that Vangl2 labels early ERMS progenitor cells and enriches for tumor propagating cells (TPCs) in both zebrafish and human, thus identifying a cross-species marker of ERMS stem-like subpopulations. Our work also revealed a requirement for VANGL2 in regulating growth, colony formation, and in vivo tumor maintenance in both human ERMS and ARMS, suggesting that conserved self-renewal properties may underlie RMS regardless of subtype and encourage future exploration of the relationship between VANGL2 and TPCs in ARMS.
We have also uncovered a major role for RHOA in regulating proliferation and maintenance of cell fate in RMS downstream of VANGL2. Despite data implicating RhoA signaling in self-renewal of embryonic stem cells (Jaganathan et al., 2013; Lee et al., 2007; Xu et al., 2012), mechanistic requirements for RhoA during self-renewing cancer stem cell divisions are not well understood. Given that RhoA affects myoblast proliferation through direct transcriptional regulation of Myod (Carnac et al., 1998; Dhawan and Helfman, 2004; Gopinath et al., 2007), and our recent discovery that MYF5/MYOD is required for growth and self-renewal in human RMS (Tenente et al., 2017), it will be important to define the relationship between VANGL2/RHOA, MYOD transcription factory family members, and proliferative programs that drive tumor growth in RMS. Wnt/PCP signaling is known to affect the orientation of cell divisions in normal tissue (Ciruna et al., 2006; Gong et al., 2004; Segalen and Bellaïche, 2009), and it will be interesting in the future to dynamically visualize RhoA-dependent mechanisms in malignant cells to understand how orientation of proliferating TPCs may influence subsequent cell fate decisions and cancer growth in vivo.
Our work also suggests that inhibiting the VANGL2-RHOA signaling axis may provide new strategies to specifically target RMS TPCs that drive relapse and metastatic growth. Preclinical pharmacologic approaches have successfully inhibited non-canonical Wnt signaling in hepatocellular carcinoma, leading to a reduction in xenograft growth and metastasis (Gujral et al., 2014). As a consequence, several clinical trials are currently underway to test chemical or antibody-based therapeutics designed to target Wnt/PCP in several different forms of human cancer (Daulat and Borg, 2017). Several FDA approved small molecule inhibitors of RhoA have also been identified (Kopp et al., 2012; Lee et al., 2007). It will be important for future experiments to test these compounds for effects on RMS self-renewal and for preclinical efficacy in suppressing xenograft growth of human RMS, in addition to suppressing more commonly RhoA-associated activities including tumor cell invasion and metastasis.
Finally, we have previously uncovered similarities in pathways that regulate stemness in normal muscle growth, regeneration, and cancer. For example, we have identified important roles for intracellular NOTCH1 in regulating TPC self-renewal and number, while activation of the Wnt/β-catenin pathway induces TPC differentiation in rhabdomyosarcoma (Chen et al., 2014; Ignatius et al., 2017). It has been shown that the Wnt/PCP signaling pathway plays important roles in regulating self-renewal cell divisions in neuronal progenitor cells and muscle stem cells (Le Grand et al., 2009; Lake and Sokol, 2009). In regenerating muscle, Wnt7a induces the expansion of satellite cells through the non-canonical Wnt/PCP pathway (Le Grand et al., 2009). In this setting, Wnt7a signals through the Fz7a receptor to polarize distribution of Vangl2, resulting in the expansion of satellite cells and enhanced muscle regeneration. Loss of Vangl2 also led to increased muscle differentiation in vivo (Le Grand et al., 2009), akin to that seen following VANGL2 knockdown in human RMS. Despite some commonalities with our studies, the downstream effectors of VANGL2 responsible for direct regulation of stem cell self-renewal in muscle have not yet been identified nor have roles for VANGL2 in regulating expansion of highly proliferative stem cell pools been established. Based on our findings and the remarkable conservation in stem cell programs between normal satellite cells and RMS, it is likely that Vangl2/RhoA will have a similar role in development and muscle regeneration.
In conclusion, we have described a role for Vangl2 in regulating the frequency and identity of tumor-sustaining cell types in RMS. Our work also suggests important and highly conserved roles for Wnt/PCP signaling in regulating cancer stem cell self-renewal across species and experimental platforms, raising the possibility that similar pathways exist in other tumor types and can be targeted therapeutically in the future (Daulat and Borg, 2017).
STAR★METHODS
CONTACT FOR REAGENT AND RESOURCE SHARING
Further information and requests for resources and reagents should be directed to and will be fulfilled by the Lead Contact, David M. Langenau, Ph.D. (dlangenau@mgh.harvard.edu).
EXPERIMENTAL MODEL AND SUBJECT DETAILS
Animals
Studies were approved by the Massachusetts General Hospital Subcommittee on Research Animal Care under protocol #2011 N000127 (zebrafish) and #2013 N000038 (mouse). Zebrafish used include: CG1 strain (Mizgireuv and Revskoy, 2006), mylz2:mCherry (Xu et al., 1999), and myf5:GFP transgenic zebrafish (Chen et al., 2007) bred into the CG1 background for 16-20 generations (Ignatius et al., 2012). Male and female zebrafish were used in all experiments. 8 to 12-week-old NOD/SCID/Il2rg null female mice were used for xenograft experiments and were obtained from Jackson laboratory, Bar Harbor, Maine.
Human RMS cell lines
Human RD cells were obtained from ATCC’s cell biology collection (Manassas, Virginia). SMS-CTR, 381T, Rh3, Rh5 and Rh30 cell lines were kindly provided by Dr. Corrine Linardic (Duke University, North Carolina), Rh18 cells by Dr. Peter Houghton (Greehey Children’s Cancer Research Institute), RMS176 and RMS559 cells by Dr. Jonathan Fletcher (Brigham and Women’s Hospital, Massachusetts). Ruch2 and Rh36 cells were kindly provided by Dr. Beat Schäfer (University Children’s Hospital, Zurich, Switzerland). Cells were maintained at 37°C in DMEM (Life Technologies) supplemented with 10% FBS (Atlanta Biologicals) and 1% Penicillin/ Streptomycin (Life Technologies). Rhabdospheres were cultured at 37°C in Neurobasal medium supplemented with 20ng/mL EGF, 20ng/mL bFGF, 10ng/mL PGDF-AA, 10ng/mL PDGF-BB, 2x B27 and 1% Penicillin/Streptomyocin. All cells were verified by STR profiling prior to use.
METHOD DETAILS
Micro-injection and ERMS generation
rag2:kRASG12D and rag2:GFP DNA were previously described (Jessen et al., 2001; Langenau et al., 2007). rag2:Vangl2 and vangl2(−5kb):mcherry were generated by Gateway cloning using the zebrafish rag2 or vangl2(−5kb) promoter (Jessen et al., 2001; Sittaramane et al., 2013), Vangl2 (gift of Brian Ciruna, Hospital for Sick Children) and mcherry ORF (http://tol2kit.genetics.utah.edu/index.php/Main_Page). Plasmid DNA was linearized using NotI and/or XhoI (rag2:kRASG12D, rag2:GFP) or Hpal (vangl2:mCherry), phenol:chloroform-extracted and re-suspended in 0.5x Tris EDTA + 0.1 M KCl. 2-4pg of linearized DNA was injected into one-cell stage embryos. Tumors were detected using epifluorescence (Olympus MVX10) and GFP-positivity within the body musculature starting at 15 days of life.
Quantification of zebrafish RMS size and initiation
Zebrafish were followed for time to tumor onset using an epifluorescent stereomicroscope. Primary tumor size was quantified at 30 days using GFP fluorescence intensity multiplied by the pixel area using ImageJ software package. Differences in tumor onset were assessed using the method of Kaplan-Meier (Graphpad Prism Software).
Histology and Immunohistochemistry
Zebrafish and xenografted tumors were fixed in 4% PFA, processed and embedded in paraffin. Histological sections were made and stained with either Hematoxylin and Eosin or specific antibodies indicated and outlined in the reagents table. The RMS tumor microarray was generously provided by Dr. Matt van de Rijn (Stanford University Medical Centre, TA-23-66). All sectioning and histopathology procedures were performed at the MGH and BWH DF/HCC Research Pathology Cores. VANGL2 (clone 2G4 from Dr. Jean-Paul Borg and subsequently, Millipore) was used. Pathology review and staging were completed by a board-certified sarcoma pathologist (G.P.N.).
FACS and ERMS cell transplantation
Unsorted primary zebrafish ERMS tumor cells were transplanted at 104 cells into 6-10 syngeneic fish. Transplanted tumor cells were allowed to engraft and grow in secondary host animals to expand all tumor cell populations in vivo. When secondary recipient animals became moribund, ERMS were harvested in 0.9x PBS supplemented with 5% FBS, stained with DAPI to exclude dead cells and sorted twice using a Laser BD FACSAria II Cell Sorter. Sort purity and viability were assessed after two rounds of sorting and are reported in the context of each experiment. ERMS tumors that were fluorescently labeled with GFP or mCherry were transplanted into syngeneic CG1 zebrafish and monitored for tumor engraftment under a fluorescent dissecting microscope from 10 to 120 days post transplantation. Tumor-propagating cell frequency was quantified following transplantation using the Extreme Limiting Dilution Analysis software package (http://bioinf.wehi.edu.au/software/elda/). ERMS rag2:GFP and myf5:GFP/vangl2:mCherry sub-populations were sorted and RNA extraction was performed using RLT buffer/RNeasy Mini Kit as per manufacturer’s instructions. Subsets of tumors were fixed in 4% PFA, sectioned and stained with Hematoxylin and Eosin.
Gene expression analysis
RNA isolation and cDNA preparation were performed as previously described (Chen et al., 2014; Ignatius et al., 2012). Quantitative real-time PCR was completed using a Roche Lightcycler 480. PCR primers are available in Tables S4 and S5.
Bioinformatic analysis of human RMS samples
RNA sequencing data was processed and analyzed as previously reported (Shern et al., 2014, GEO: GSE108022). RNaseq reads were aligned to the human reference genome (hg19) using TopHat to generate BAM files. Gene expression was calculated as Fragments Per Kilobase of transcript per Million mapped reads (FPKM) using Cufflinks and with UCSC reference and reported at the gene level. Sample groups were determined based on genetic presence or absence of the fusion gene, as previously reported (Shern et al., 2014). Data visualization and statistical Student’s t test were performed using FPKM values of VANGL2 using Graphpad Prism software. The 12 primary patient samples analyzed by quantitative RT-PCR in Figure 1C have been reported previously (Ignatius et al., 2017).
Protein extraction, Immunoprecipitation, Immunofluorescence and western blot analysis
Total cellular protein from human RMS cell lines was obtained by lysis in 2% SDS buffer supplemented with protease inhibitors (Santa Cruz Biotechnology). Samples were boiled, vortexed and homogenized by passage through a syringe. 20-50ug of protein was loaded onto 4%–20% Mini-Protean TGX gels (Biorad) and transferred onto PVDF membranes. GTP-bound RHOA and RAC1 were precipitated using pull-down activation assay Biochem Kits, according to manufacturer’s recommendations (Cytoskeleton). Antibodies against VANGL2 (2G4, Dr. Jean-Paul Borg and Millipore), PAX7 (DSHB), MYOG (Santa Cruz, M-225), FGFR3 (Cell Signaling, C51F2), CD133 (Cell Signaling, D2V8Q), GAPDH (Cell Signaling, 14C10), RHOA (Cell Signaling, 67B9), RAC1 (Cytoskeleton, C7H2) were used.
Uninfected or stably-infected cells were plated in flat, clear bottom 96 well plates and fixed at the specified time point in 4% PFA/PBS for 15 minutes at room temperature. Cells were washed in 1x PBS, permeabilized in 0.5% Triton X-100/PBS, washed in 0.1% PBST and incubated with primary antibody overnight. Fluorescently-conjugated secondary antibody was used at 1:1000 dilution with 1:5000 DAPI to stain nuclei. Cells were washed in 1x PBS and imaged using a LSM710 Zeiss Laser scanning confocal microscope. Images were processed using ZEN software and and quantifications were made using ImageJ software.
Plasmids, lentiviral and shRNA
Lentiviral work was approved by Partners IBC under protocol #2013B000039. shRNA plasmids in the pLKO.1- background vector targeting VANGL2 (shVL2(1) – CAAGTCACACAAGTTTGTCAT, shVL2(2) – TTCAAACTCTCCGAGGAATTT) were obtained from the Massachusetts General Hospital Molecular Profiling Core Facility. RHOAV14, RHOAN19, RAC1V12, and RAC1N17 overexpression vectors were generated using a primer based mutagenesis approach and cloning from wild-type RHOA and RAC1 transcript. Clones were inserted into pDONR221 and pLentiCMVPuroDEST (w118-1) vectors using standard Gateway cloning approaches.
All vectors were packaged using 293T cells. 2 μg pCMV-dR8.91 and 0.2 μg pVSV-g were transfected with Trans-LTI reagent (Life Technologies) according to manufacturer’s recommendation. RMS were infected with 1:1 volume viral particle to DMEM/10%FBS media containing 1:1000 Polybrene (EMD Millipore) for 24 hours. Cells were maintained in DMEM/10% FBS media and selected for stable infection with puromycin after 48 hours.
Mouse xenograft, bioluminescent imaging, and necropsy
RD ERMS, SMSCTR ERMS and RH30 ERMS cells were co-infected with pLKO.1-shRNA and pLKO.1-luc-mKate (gift of Drs. Matthijssens and Van Vlierberghe, Ghent University, Belgium). At 3 days post-infection without selection, cells were collected, counted and analyzed using the SORP4 Laser BD LSRII Flow Cytometer to determine viability using DAPI and mKate expression, to infer infection efficiency. Equal numbers of viable cells were embedded into matrigel at 1×10⁶ cells/100uL. 8 to 12-week-old NOD/SCID/IL2g null female mice were anesthetized using isofluorane and injected with shSCRM/luc-mKate cells subcutaneously into the left flank and shVANGL2/luc-mKATE cells into the right flank (200uL/flank injection, n = 6 animals/shRNA construct). Tumor growth was monitored weekly by bioluminescence imaging following subcutaneous injection of 75mg/kg D-luciferin (Perkin Elmer) in 100uL PBS. Imaging was performed and analyzed using the IVIS Lumina II (Caliper Life Science). At necropsy, tumor volume was calculated using a caliper measure and tumor mass was determined using a standard weight scale.
QUANTIFICATION AND STATISTICAL ANALYSIS
Statistical details for all experiments can be found in the Results section and Figure legends. Data in bar graphs is shown as an absolute number or mean ± SD (standard deviation), as indicated. Student’s t tests were used to calculate significant differences between normally distributed data, where indicated. Grouped data was analyzed using two-way ANOVA. Extreme Limiting Dilution Analysis (ELDA, http://bioinf.wehi.edu.au/software/elda/) was used to analyze results of limiting dilution experiments. P values less than 0.05 were considered to be statistically significant. Significance is indicated as asterisk and defined in the Figure legends. Zebrafish and mice were randomly assigned to experimental groups.
DATA AND SOFTWARE AVAILABILITY
The dataset described in Shern et al. (2014) was analyzed as described in the Results section and is deposited in GEO: GSE108022.
Supplementary Material
KEY RESOURCES TABLE
| REAGENT or RESOURCE | SOURCE | IDENTIFIER |
|---|---|---|
| Antibodies | ||
| Rat monoclonal anti-VANGL2 | Millipore | Cat. #MABN750, AB_2721170 |
| Mouse monoclonal anti-Pax7 | DSHB | Cat. #Pax7, AB_528428 |
| Rabbit polyclonal anti-Myogenin | Santa Cruz | sc-576, AB_2148908 |
| Rabbit monoclonal anti-FGFR3 | Cell Signaling | Cat. #4574, AB_2721171 |
| Rabbit monoclonal anti-CD133 | Cell Signaling | Cat. #64326, AB_27211172 |
| Rabbit monoclonal anti-GAPDH | Cell Signaling | Cat. #2118, AB_561053 |
| Rabbit monoclonal anti-RhoA | Cell Signaling | Cat. #2117, AB_10693922 |
| Mouse monoclonal anti-Rac1 | Cytoskeleton | Cat. #ARC03, AB_2721173 |
| Rabbit monoclonal anti-Ki67 | Abcam | Cat. #ab16667, AB_302459 |
| Rabbit monoclonal anti-Ki67 | Biocare | Cat. #CRM325, AB_2721189 |
| Rabbit monoclonal anti-CC3 (Asp175) | Cell Signaling | Cat. #9664, AB_2070042 |
| Mouse monoclonal anti-MYOD | Dako | Cat. #M2512, AB_2721191 |
| Mouse monoclonal anti-MYOG | Dako | Cat. #M3512, AB_2148874 |
| Rabbit polyclonal anti-RFP | Abcam | Cat. #152123, AB_2637080 |
| Anti-Rabbit IgG, HRP-linked | Cell Signaling | Cat. #7074, AB_2099233 |
| Anti-Rat IgG, HRP-linked | Thermo Fisher | Cat. # PA128573, AB_10980086 |
| Anti-goat IgG, Alexa Fluor 488 | Life Technologies | Cat. #A11055, AB_2534102 |
| Anti-mouse IgG, Alexa Fluor 594 | Life Technologies | Cat. #A11062, AB_2534109 |
| Anti-rabbit IgG, Alexa Fluor 594 | Life Technologies | Cat. #A21207, AB_141637 |
| Chemicals, Peptides, and Recombinant Proteins | ||
| EGF | Life Technologies | Cat. #PHG0311 |
| bFGF | Life Technologies | Cat. #13256029 |
| PGDF-AA | Life Technologies | Cat. #PHG0035 |
| PGDF-BB | Life Technologies | Cat. #PHG0045 |
| B27 (50x) | Life Technologies | Cat. #17504044 |
| Neurobasal Medium | Life Technologies | Cat. #21103049 |
| DMEM | Life Technologies | Cat. #11995073 |
| Opti-MEM Reduced Serum Medium | Life Technologies | Cat. #31985088 |
| Transit LT-1 | VWR | Cat. #MIR2300 |
| Polybrene Infection Reagent | Millipore | Cat. #TR-1003-G |
| Puromycin | Fisher Scientific | Cat. #NC9138068 |
| Penicillin-Streptomycin-Glutamine | Life Technologies | Cat. #10378-016 |
| Fetal Bovine Serum | Atlanta Biologicals | Cat. #S11550H |
| Trypsin/EDTA Solution (TE) | Life Technologies | Cat. #R001100 |
| PBS | Life Technologies | Cat. #10010049 |
| DAPI | Life Technologies | Cat. #D1306 |
| Not1 | New England Biolabs | Cat. #R3189 |
| XhoI | New England Biolabs | Cat. #R0146 |
| HpaI | New England Biolabs | Cat. #R0105 |
| PVDF Transfer Membranes | Bio-Rad Laboratories | Cat. #1704157 |
| Mini-Protean TGX Gels | Bio-Rad Laboratories | Cat. #456-1094 |
| ECL Prime Western Blot Detection Reagent | Fisher Scientific | Cat. #45002401 |
| Gateway BP Clonase II | Life Technologies | Cat. #11789020 |
| Gateway LR Clonase II Plus | Life Technologies | Cat. #11791020 |
| Light Cycler 480 SYBR Green | Roche | Cat. #04887352001 |
| Matrigel | VWR | Cat. #47743-715 |
| D-Luciferin | Perkin Elmer | Cat. #122799 |
| Critical Commercial Assays | ||
| RhoA Pull-down Activation Assay Biochem Kit | Cytoskeleton | Cat. #BK036 |
| Rac1 Pull-down Activation Assay Biochem Kit | Cytoskeleton | Cat. #BK035 |
| RNeasy Mini Kit | QIAGEN | Cat. #74106 |
| cDNA Reverse Transcription Kit | Life Technologies | Cat. #4368813 |
| Click-IT EDU Kit | Life Technologies | Cat. #C10269 |
| Deposited Data | ||
| RNA sequencing of human RMS | Shern et al., 2014 | GEO: GSE108022 |
| Experimental Models: Cell Lines | ||
| HEK293T | ATCC | CRL-3216 |
| RD | ATCC | CCL-136 |
| SMSCTR | Corrine Linardic (Duke University) | N/A |
| 381T | Corrine Linardic (Duke University) | N/A |
| Rh3 | Corrine Linardic (Duke University) | N/A |
| Rh5 | Corrine Linardic (Duke University) | N/A |
| Rh30 | Corrine Linardic (Duke University) | N/A |
| Rh18 | Peter Houghton (Greehey Children’s Cancer Research Institute) | N/A |
| RMS176 | Johnathan Fletcher (Brigham and Women’s Hospital) | N/A |
| RMS559 | Johnathan Fletcher (Brigham and Women’s Hospital) | N/A |
| Ruch2 | Beat Schäfer (University Children’s Hospital, Zurich) | N/A |
| Rh36 | Beat Schäfer (University Children’s Hospital, Zurich) | N/A |
| Experimental Models: Organisms/Strains | ||
| Zebrafish CG1 strain | Mizgireuv and Revskoy, 2006 | N/A |
| Zebrafish Tg(mylz2:mCherry) | Xu et al., 1999; Ignatius et al., 2012 | N/A |
| Zebrafish Tg(myf5:mCherry) | Chen et al., 2007; Ignatius et al., 2012 | N/A |
| Mice NOD/SCID/Il2rg-null | Jackson laboratories | Cat. #005557 |
| Oligonucleotides | ||
| Primers for qRT-PCR related to human RMS | Table S4 | N/A |
| Primers for qRT-PCR related to zebrafish ERMS | Table S5 | N/A |
| Recombinant DNA | ||
| rag2:KRASG12D | Langenau et al., 2007 | N/A |
| rag2:GFP | Jessen et al., 2001 | N/A |
| rag2:Vangl2 | This paper with rag2 from Jessen et al. (2001) | N/A |
| vangl2(−5kb):mCherry | This paper with p5E vangl2(−5kb) (gift of Anand Chandrasekhar, Sittaramane et al., 2013) | N/A |
| pME-Vangl2 | Gift of Brian Ciruna (Hospital for Sick Children, Toronto) | N/A |
| pDONR221 | Koichi Kawakami, Kristen Kwan | http://tol2kit.genetics.utah.edu/index.php/Main_Page |
| pDESTTol2pA2 | Koichi Kawakami, Kristen Kwan | http://tol2kit.genetics.utah.edu/index.php/Main_Page |
| pME-mCherry | Koichi Kawakami, Kristen Kwan | http://tol2kit.genetics.utah.edu/index.php/Main_Page |
| psPAX2 | Addgene | Plasmid #12260 |
| pVSV-g | Addgene | Plasmid #8454 |
| pLKO scramble shRNA | Addgene | Plasmid #1864 |
| pLKO.1 shVANGL2(1) | Massachusetts General Hospital Molecular Profiling Facility | TRCN0000147138 |
| pLKO.1 shVANGL2(2) | Massachusetts General Hospital Molecular Profiling Facility | TRCN0000417141 |
| pLKO.1-luc-mKate | gift of Drs Van Vlierberghe and Matthijssens (Ghent University) | N/A |
| pLentiCMVPuroDEST | Addgene | w118-1 |
| pLentiCMV-RHOAV14 | This reagent was created from PCR of endogenous human RHOA and the point mutation generated by modifying the specific oligonucleotide primer. RHOAV14 was cloned into pLentiCMVPuroDEST using standard gateway approach | N/A |
| pLentiCMV-RHOAN19 | This reagent was created from PCR of endogenous human RHOA and the point mutation generated by modifying the specific oligonucleotide primer. RHOAN19 was cloned into pLentiCMVPuroDEST using standard gateway approach | N/A |
| pLentiCMV-RAC1V12 | This reagent was created from PCR of endogenous human RAC1 and the point mutation generated by modifying the specific oligonucleotide primer. RAC1V12 was cloned into pLentiCMVPuroDEST using standard gateway approach | N/A |
| pLentiCMV-RAC1N17 | This reagent was created from PCR of endogenous human RAC1 and the point mutation generated by modifying the specific oligonucleotide primer. RAC1N17 was cloned into pLentiCMVPuroDEST using standard gateway approach | N/A |
| Software and Algorithms | ||
| GraphPad Prism | GraphPad | https://www.graphpad.com/scientific-software/prism/ |
| ImageJ | National Institutes of Health | https://imagej.nih.gov/ij/ |
| ZEN | Carl Zeiss | https://www.zeiss.com/microscopy/int/products/microscope-software/zen.html |
| Extreme Limiting Dilution Analysis (ELDA) | Walter & Eliza Hall Institute of Medical Research | http://bioinf.wehi.edu.au/software/elda/ |
| IVIS Lumina II Living Image | Perkin Elmer | Part #28110 |
| Other | ||
| Pediatric sarcoma tissue microarray | Matt va de Rijn (Stanford University Medical Cener) | TA-23-66 |
| Primary human RMS RNA/cDNA (12 samples + cell lines) | David Malkin (Hospital for Sick Children, Toronto), described previously in Ignatius et al. (2017) | N/A |
Highlights.
Wnt/PCP/VANGL2 are expressed in a majority of primary human rhabdomyosarcoma (RMS)
Vangl2 labels TPCs and expands their number in zebrafish embryonal RMS
VANGL2 knockdown inhibits growth and self-renewal of human RMS
RHOA functions downstream of VANGL2 to regulate growth and self-renewal
ACKNOWLEDGMENTS
This work was funded by NIH grants R01CA154923 (D.M.L.), R01CA215118 (D.M.L.), R24OD016761 (D.M.L.), and U54CA168512 (D.M.L.); a St. Baldricks Research Grant (D.M.L.); the MGH Scholars Program (D.M.L.); the Alex’s Lemonade Stand Foundation (M.N.H.); and the Amanda Riley Foundation (M.N.H., Bear Necessities). We thank the Specialized Histopathology Services at Massachusetts General Hospital (MGH) and the Dana-Farber/Harvard Cancer Center (P30 CA06516), the MGH Cancer Center/Molecular Pathology Confocal Core, and the MGH CNY Flow Cytometry Core and Flow Image Analysis (1S10RR023440-01A1). The work of Z.M. and D.M. was supported through a Rhabdomyosarcoma Research Fund from SickKids Foundation. The work of M.I. was supported by NIH grant R00CA175184.
Footnotes
SUPPLEMENTAL INFORMATION
Supplemental Information includes seven figures and five tables and can be found with this article online at https://doi.org/10.1016/j.stem.2018.02.002.
DECLARATION OF INTERESTS
The authors declare no competing interests.
REFERENCES
- Anastas JN, Biechele TL, Robitaille M, Muster J, Allison KH, Angers S, and Moon RT (2012). A protein complex of SCRIB, NOS1AP and VANGL1 regulates cell polarity and migration, and is associated with breast cancer progression. Oncogene 31, 3696–3708. [DOI] [PMC free article] [PubMed] [Google Scholar]
- Armand AS, Launay T, Pariset C, Della Gaspera B, Charbonnier F, and Chanoine C (2003). Injection of FGF6 accelerates regeneration of the soleus muscle in adult mice. Biochim. Biophys. Acta 1642, 97–105. [DOI] [PubMed] [Google Scholar]
- Asad M, Wong MK, Tan TZ, Choolani M, Low J, Mori S, Virshup D, Thiery JP, and Huang RY-J (2014). FZD7 drives in vitro aggressiveness in Stem-A subtype of ovarian cancer via regulation of non-canonical Wnt/PCP pathway. Cell Death Dis. 5, e1346. [DOI] [PMC free article] [PubMed] [Google Scholar]
- Brack AS, Conboy IM, Conboy MJ, Shen J, and Rando TA (2008). A temporal switch from notch to Wnt signaling in muscle stem cells is necessary for normal adult myogenesis. Cell Stem Cell 2, 50–59. [DOI] [PubMed] [Google Scholar]
- Buckingham M, and Relaix F (2015). PAX3 and PAX7 as upstream regulators of myogenesis. Semin. Cell Dev. Biol 44, 115–125. [DOI] [PubMed] [Google Scholar]
- Carnac G, Primig M, Kitzmann M, Chafey P, Tuil D, Lamb N, and Fernandez A (1998). RhoA GTPase and serum response factor control selectively the expression of MyoD without affecting Myf5 in mouse myoblasts. Mol. Biol. Cell 9, 1891–1902. [DOI] [PMC free article] [PubMed] [Google Scholar]
- Chen Y-H, Wang Y-H, Chang M-Y, Lin C-Y, Weng C-W, Westerfield M, and Tsai H-J (2007). Multiple upstream modules regulate zebrafish myf5 expression. BMC Dev. Biol 7, 1. [DOI] [PMC free article] [PubMed] [Google Scholar]
- Chen X, Stewart E, Shelat AA, Qu C, Bahrami A, Hatley M, Wu G, Bradley C, McEvoy J, Pappo A, et al. ; St. Jude Children’s Research Hospital–Washington University Pediatric Cancer Genome Project (2013). Targeting oxidative stress in embryonal rhabdomyosarcoma. Cancer Cell 24, 710–724. [DOI] [PMC free article] [PubMed] [Google Scholar]
- Chen EY, DeRan MT, Ignatius MS, Grandinetti KB, Clagg R, McCarthy KM, Lobbardi RM, Brockmann J, Keller C, Wu X, and Langenau DM (2014). Glycogen synthase kinase 3 inhibitors induce the canonical WNT/β-catenin pathway to suppress growth and self-renewal in embryonal rhabdomyosarcoma. Proc. Natl. Acad. Sci. USA 111, 5349–5354. [DOI] [PMC free article] [PubMed] [Google Scholar]
- Ciruna B, Jenny A, Lee D, Mlodzik M, and Schier AF (2006). Planar cell polarity signalling couples cell division and morphogenesis during neurulation. Nature 439, 220–224. [DOI] [PMC free article] [PubMed] [Google Scholar]
- Daulat AM, and Borg J-P (2017). Wnt/planar cell polarity signaling: new opportunities for cancer treatment. Trends Cancer 3, 113–125. [DOI] [PubMed] [Google Scholar]
- Dela Cruz FS (2013). Cancer stem cells in pediatric sarcomas. Front. Oncol 3, 168. [DOI] [PMC free article] [PubMed] [Google Scholar]
- Dhawan J, and Helfman DM (2004). Modulation of acto-myosin contractility in skeletal muscle myoblasts uncouples growth arrest from differentiation. J. Cell Sci 117, 3735–3748. [DOI] [PubMed] [Google Scholar]
- Friedman GK, and Gillespie GY (2011). Cancer stem cells and pediatric solid tumors. Cancers (Basel) 3, 298–318. [DOI] [PMC free article] [PubMed] [Google Scholar]
- Goldstein M, Meller I, and Orr-Urtreger A (2007). FGFR1 over-expression in primary rhabdomyosarcoma tumors is associated with hypomethylation of a 5′ CpG island and abnormal expression of the AKT1, NOG, and BMP4 genes. Genes Chromosomes Cancer 46, 1028–1038. [DOI] [PubMed] [Google Scholar]
- Gong Y, Mo C, and Fraser SE (2004). Planar cell polarity signalling controls cell division orientation during zebrafish gastrulation. Nature 430, 689–693. [DOI] [PubMed] [Google Scholar]
- Gopinath SD, Narumiya S, and Dhawan J (2007). The RhoA effector mDiaphanous regulates MyoD expression and cell cycle progression via SRF-dependent and SRF-independent pathways. J. Cell Sci 120, 3086–3098. [DOI] [PubMed] [Google Scholar]
- Gros J, Serralbo O, and Marcelle C (2009). WNT11 acts as a directional cue to organize the elongation of early muscle fibres. Nature 457, 589–593. [DOI] [PubMed] [Google Scholar]
- Gujral TS, Chan M, Peshkin L, Sorger PK, Kirschner MW, and MacBeath G (2014). A noncanonical Frizzled2 pathway regulates epithelial-mesenchymal transition and metastasis. Cell 159, 844–856. [DOI] [PMC free article] [PubMed] [Google Scholar]
- Hirotsu M, Setoguchi T, Matsunoshita Y, Sasaki H, Nagao H, Gao H, Sugimura K, and Komiya S (2009). Tumour formation by single fibroblast growth factor receptor 3-positive rhabdomyosarcoma-initiating cells. Br. J. Cancer 101, 2030–2037. [DOI] [PMC free article] [PubMed] [Google Scholar]
- Ignatius MS, Chen E, Elpek NM, Fuller AZ, Tenente IM, Clagg R, Liu S, Blackburn JS, Linardic CM, Rosenberg AE, et al. (2012). Invivo imaging of tumor-propagating cells, regional tumor heterogeneity, and dynamic cell movements in embryonal rhabdomyosarcoma. Cancer Cell 21, 680–693. [DOI] [PMC free article] [PubMed] [Google Scholar]
- Ignatius MS, Hayes MN, Lobbardi R, Chen EY, McCarthy KM, Sreenivas P, Motala Z, Durbin AD, Molodtsov A, Reeder S, et al. (2017). The NOTCH1/SNAIL1/MEF2C Pathway Regulates Growth and Self-Renewal in Embryonal Rhabdomyosarcoma. Cell Rep. 19, 2304–2318. [DOI] [PMC free article] [PubMed] [Google Scholar]
- Jaganathan BG, Anjos-Afonso F, Kumar A, and Bonnet D (2013). Active RHOA favors retention of human hematopoietic stem/progenitor cells in their niche. J. Biomed. Sci 20, 66. [DOI] [PMC free article] [PubMed] [Google Scholar]
- Jessen JR, Jessen TN, Vogel SS, and Lin S (2001). Concurrent expression of recombination activating genes 1 and 2 in zebrafish olfactory sensory neurons. Genesis 29, 156–162. [DOI] [PubMed] [Google Scholar]
- Keller C, and Guttridge DC (2013). Mechanisms of impaired differentiation in rhabdomyosarcoma. FEBS J. 280, 4323–4334. [DOI] [PMC free article] [PubMed] [Google Scholar]
- Kopp MA, Liebscher T, Niedeggen A, Laufer S, Brommer B, Jungehulsing GJ, Strittmatter SM, Dirnagl U, and Schwab JM (2012). Small-molecule-induced Rho-inhibition: NSAIDs after spinal cord injury. Cell Tissue Res. 349, 119–132. [DOI] [PMC free article] [PubMed] [Google Scholar]
- Kreso A, and Dick JE (2014). Evolution of the cancer stem cell model. Cell Stem Cell 14, 275–291. [DOI] [PubMed] [Google Scholar]
- Kurayoshi M, Oue N, Yamamoto H, Kishida M, Inoue A, Asahara T, Yasui W, and Kikuchi A (2006). Expression of Wnt-5a is correlated with aggressiveness of gastric cancer by stimulating cell migration and invasion. Cancer Res. 66, 10439–10448. [DOI] [PubMed] [Google Scholar]
- Lake BB, and Sokol SY (2009). Strabismus regulates asymmetric cell divisions and cell fate determination in the mouse brain. J. Cell Biol 185, 59–66. [DOI] [PMC free article] [PubMed] [Google Scholar]
- Langenau DM, Keefe MD, Storer NY, Guyon JR, Kutok JL, Le X, Goessling W, Neuberg DS, Kunkel LM, and Zon LI (2007). Effects of RAS on the genesis of embryonal rhabdomyosarcoma. Genes Dev. 21, 1382–1395. [DOI] [PMC free article] [PubMed] [Google Scholar]
- Le Grand F, Jones AE, Seale V, Scimè A, and Rudnicki MA (2009). Wnt7a activates the planar cell polarity pathway to drive the symmetric expansion of satellite stem cells. Cell Stem Cell 4, 535–547. [DOI] [PMC free article] [PubMed] [Google Scholar]
- Lee M-H, Cho YS, and Han Y-M (2007). Simvastatin suppresses self-renewal of mouse embryonic stem cells by inhibiting RhoA geranylgeranylation. Stem Cells 25, 1654–1663. [DOI] [PubMed] [Google Scholar]
- Ma MZ, Zhuang C, Yang XM, Zhang ZZ, Ma H, Zhang WM, You H, Qin W, Gu J, Yang S, et al. (2014). CTHRC1 acts as a prognostic factor and promotes invasiveness of gastrointestinal stromal tumors by activating Wnt/PCP-Rho signaling. Neoplasia 16, 265–278. [DOI] [PMC free article] [PubMed] [Google Scholar]
- McCoy KE, Zhou X, and Vize PD (2011). Non-canonical wnt signals antagonize and canonical wnt signals promote cell proliferation in early kidney development. Dev. Dyn 240, 1558–1566. [DOI] [PMC free article] [PubMed] [Google Scholar]
- Mizgireuv IV, and Revskoy SY (2006). Transplantable tumor lines generated in clonal zebrafish. Cancer Res. 66, 3120–3125. [DOI] [PubMed] [Google Scholar]
- Murdoch JN, Doudney K, Paternotte C, Copp AJ, and Stanier P (2001). Severe neural tube defects in the loop-tail mouse result from mutation of Lpp1, a novel gene involved in floor plate specification. Hum. Mol. Genet 10, 2593–2601. [DOI] [PubMed] [Google Scholar]
- Nemeth MJ, Topol L, Anderson SM, Yang Y, and Bodine DM (2007). Wnt5a inhibits canonical Wnt signaling in hematopoietic stem cells and enhances repopulation. Proc. Natl. Acad. Sci. USA 104, 15436–15441. [DOI] [PMC free article] [PubMed] [Google Scholar]
- Nusse R, and Clevers H (2017). Wnt/β-catenin Signaling, Disease, and Emerging Therapeutic Modalities. Cell 169, 985–999. [DOI] [PubMed] [Google Scholar]
- Peng Y, and Axelrod JD (2012). Asymmetric protein localization in planar cell polarity: mechanisms, puzzles, and challenges. Curr. Top. Dev. Biol 101, 33–53. [DOI] [PMC free article] [PubMed] [Google Scholar]
- Phillips HM, Murdoch JN, Chaudhry B, Copp AJ, and Henderson DJ (2005). Vangl2 acts via RhoA signaling to regulate polarized cell movements during development of the proximal outflow tract. Circ. Res 96, 292–299. [DOI] [PubMed] [Google Scholar]
- Pressey JG, Haas MC, Pressey CS, Kelly VM, Parker JN, Gillespie GY, and Friedman GK (2013). CD133 marks a myogenically primitive sub-population in rhabdomyosarcoma cell lines that are relatively chemoresistant but sensitive to mutant HSV. Pediatr. Blood Cancer 60, 45–52. [DOI] [PMC free article] [PubMed] [Google Scholar]
- Puvirajesinghe TM, Bertucci F, Jain A, Scerbo P, Belotti E, Audebert S, Sebbagh M, Lopez M, Brech A, Finetti P, et al. (2016). Identification of p62/SQSTM1 as a component of non-canonical Wnt VANGL2-JNK signalling in breast cancer. Nat. Commun 7, 10318. [DOI] [PMC free article] [PubMed] [Google Scholar]
- Roszko I, S Sepich D, Jessen JR, Chandrasekhar A, and Solnica-Krezel L (2015). A dynamic intracellular distribution of Vangl2 accompanies cell polarization during zebrafish gastrulation. Development 142, 2508–2520. [DOI] [PMC free article] [PubMed] [Google Scholar]
- Satheesha S, Manzella G, Bovay A, Casanova EA, Bode PK, Belle R, Feuchtgruber S, Jaaks P, Dogan N, Koscielniak E, et al. (2016). Targeting hedgehog signaling reduces self-renewal in embryonal rhabdomyosarcoma. Oncogene 35, 2020–2030. [DOI] [PMC free article] [PubMed] [Google Scholar]
- Schlessinger K, Hall A, and Tolwinski N (2009). Wnt signaling pathways meet Rho GTPases. Genes Dev. 23, 265–277. [DOI] [PubMed] [Google Scholar]
- Segalen M, and Bellaïche Y (2009). Cell division orientation and planar cell polarity pathways. Semin. Cell Dev. Biol 20, 972–977. [DOI] [PubMed] [Google Scholar]
- Seifert JRK, and Mlodzik M (2007). Frizzled/PCP signalling: a conserved mechanism regulating cell polarity and directed motility. Nat. Rev. Genet 8, 126–138. [DOI] [PubMed] [Google Scholar]
- Shern JF, Chen L, Chmielecki J, Wei JS, Patidar R, Rosenberg M, Ambrogio L, Auclair D, Wang J, Song YK, et al. (2014). Comprehensive genomic analysis of rhabdomyosarcoma reveals a landscape of alterations affecting a common genetic axis in fusion-positive and fusion-negative tumors. Cancer Discov. 4, 216–231. [DOI] [PMC free article] [PubMed] [Google Scholar]
- Simons M, and Mlodzik M (2008). Planar cell polarity signaling: from fly development to human disease. Annu. Rev. Genet 42, 517–540. [DOI] [PMC free article] [PubMed] [Google Scholar]
- Sittaramane V, Pan X, Glasco DM, Huang P, Gurung S, Bock A, Li S, Wang H, Kawakami K, Matise MP, and Chandrasekhar A (2013). The PCP protein Vangl2 regulates migration of hindbrain motor neurons by acting in floor plate cells, and independently of cilia function. Dev. Biol 382, 400–412. [DOI] [PMC free article] [PubMed] [Google Scholar]
- Tenente IM, Hayes MN, Ignatius MS, McCarthy K, Yohe M, Sindiri S, Gryder B, Oliveira ML, Ramakrishnan A, Tang Q, et al. (2017). Myogenic regulatory transcription factors regulate growth in rhabdomyosarcoma. eLife 6, 1–24. [DOI] [PMC free article] [PubMed] [Google Scholar]
- von Maltzahn J, Chang NC, Bentzinger CF, and Rudnicki MA (2012). Wnt signaling in myogenesis. Trends Cell Biol. 22, 602–609. [DOI] [PMC free article] [PubMed] [Google Scholar]
- Walter D, Satheesha S, Albrecht P, Bornhauser BC, D’Alessandro V, Oesch SM, Rehrauer H, Leuschner I, Koscielniak E, Gengler C, et al. ; CWS Study Group (2011). CD133 positive embryonal rhabdomyosarcoma stem-like cell population is enriched in rhabdospheres. PLoS ONE 6, e19506. [DOI] [PMC free article] [PubMed] [Google Scholar]
- Weeraratna AT, Jiang Y, Hostetter G, Rosenblatt K, Duray P, Bittner M and Trent JM (2002). Wnt5a signaling directly affects cell motility and invasion of metastatic melanoma. Cancer Cell 1, 279–288. [DOI] [PubMed] [Google Scholar]
- Xu Y, He J, Tian HL, Chan CH, Liao J, Yan T, Lam TJ, and Gong Z (1999). Fast skeletal muscle-specific expression of a zebrafish myosin light chain 2 gene and characterization of its promoter by direct injection into skeletal muscle. DNA Cell Biol. 18, 85–95. [DOI] [PubMed] [Google Scholar]
- Xu J, Lim SBH, Ng MY, Ali SM, Kausalya JP, Limviphuvadh V, Maurer-Stroh S, and Hunziker W (2012). ZO-1 regulates Erk, Smad1/5/8, Smad2, and RhoA activities to modulate self-renewal and differentiation of mouse embryonic stem cells. Stem Cells 30, 1885–1900. [DOI] [PubMed] [Google Scholar]
- Yagyu R, Hamamoto R, Furukawa Y, Okabe H, Yamamura T, and Nakamura Y (2002). Isolation and characterization of a novel human gene, VANGL1, as a therapeutic target for hepatocellular carcinoma. Int. J. Oncol 20, 1173–1178. [PubMed] [Google Scholar]
- Yang X-M, You H-Y, Li Q, Ma H, Wang Y-H, Zhang Y-L, Zhu L, Nie H-Z, Qin W-X, Zhang Z-G, and Li J (2015). CTHRC1 promotes human colorectal cancer cell proliferation and invasiveness by activating Wnt/PCP signaling. Int. J. Clin. Exp. Pathol 8, 12793–12801. [PMC free article] [PubMed] [Google Scholar]
Associated Data
This section collects any data citations, data availability statements, or supplementary materials included in this article.
Supplementary Materials
Data Availability Statement
The dataset described in Shern et al. (2014) was analyzed as described in the Results section and is deposited in GEO: GSE108022.