Figure 4.

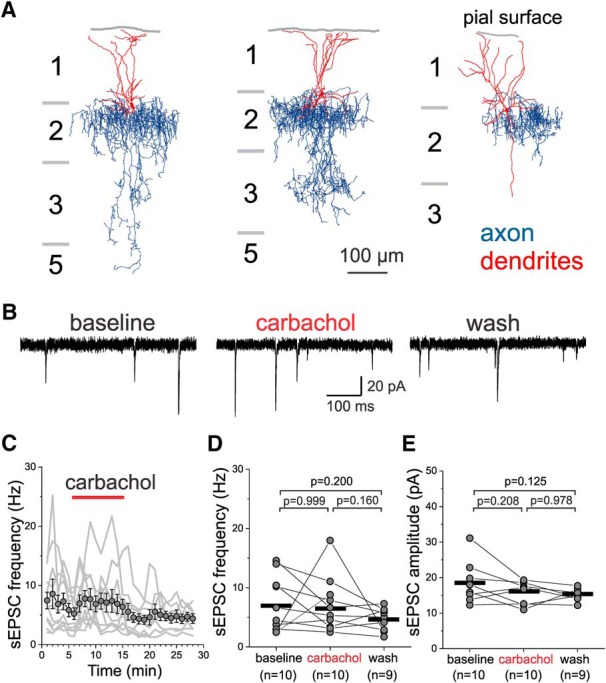
Effect of carbachol on sEPSCs recorded from layer 2 PV+ ChCs with soma near the border with layer 1. A, Examples of the morphology of ChCs with soma near the border with layer 1. The dendritic tree is shown in red and the axonal arbor in blue. Note that ChC dendrites mostly project onto layer 1 and that the distal tips of the dendrites end near the pial surface. B, Examples of sEPSCs recorded from a L2 ChC before (baseline), during 20 µM carbachol application (carbachol), and after washout (wash). C, Time-course plot illustrating the effects of a 10 min application of 20 µM carbachol on sEPSC frequency in ChCs. The gray lines show the data for individual ChCs. The symbols show mean ± SEM, n = 10. The sEPSC frequency was measured in 20 s time windows every 60 s. D, Carbachol did not have significant effects on sEPSC frequency when estimated 20 s before carbachol application (baseline), the last 20 s before beginning of washout, and after ≥10 min of washout; one-way RM mixed model ANOVA, F(2,19.5) = 2.53, p = 0.106; shown in figure are the results of Sidak-corrected, post hoc pairwise comparisons). The black horizontal bars indicate the mean value for each sample. E, Carbachol did not have significant effects on sEPSC amplitude when estimated 20 s before carbachol application (baseline), the last 20 s before beginning of washout, and after ≥10 min of washout (one-way RM mixed model ANOVA, F(2,15.4) = 2.89, p = 0.086; shown in figure are the results of Sidak-corrected, post hoc pairwise comparisons). The black horizontal bars indicate the mean value for each sample.
