Abstract
Recently, rowing power has been shown to be a key determinant of rowing performance. However, rowing power testing can vary greatly, and is not standardized. Here we sought to evaluate rowing power over a 15 sec rowing test utilizing a stroke-by-stroke analysis before and after 4 weeks of training in youth rowers.
Methods
18 adolescent male rowers were assigned to complete either 4 weeks of plyometric training (PLYO, n=9), or steady state cycling (Control, n=9), for 30 minutes before on water training three days/week. Each group was matched for training volume. Peak power (PP) was assessed via a 15 sec maximal rowing ergometer test. Using the Ergdata mobile app, PP, peak force (PF), average force (AF), drive speed (DS), and stroke at which PP was achieved (PPstroke) were measured and recorded for later offline analysis.
Results
Before training PP, PF, AF and DS did not differ between groups. After training, PP trended towards a significant difference between groups PLYO and CON (569±75 v. 629±51 Watts, control v. PLYO, p=0.08). Stroke-by-stroke analysis indicated more power was produced over the test following training (p<0.05), but no group differences existed. There was also a trend towards PLYO achieving PP earlier in the test (7.7±0.9 to 6.9±0.9 strokes, p=0.08). Finally, DS during the test was significantly increased for PLYO after training (p<0.05).
Conclusion
This novel method of evaluating rowing power was able to detect changes in rowing power indices, providing coaches with a cost effective method of evaluating responses to rowing training.
Keywords: Rowing performance, force, stroke analysis, youth
INTRODUCTION
Rowing is a high intensity sport that requires a high aerobic and anaerobic capacity (9). The training programs of most teams are dominated by aerobic training (9), as aerobic metabolism accounts for 67–84% of the energy requirement during racing on water (9) and off water on rowing ergometers (2). Interestingly, peak rowing power has been shown to be the highest correlate to 2km rowing performance (1, 6, 7), and has been shown to account for 76% of the variation in rowing performance in female rowers (13). In fact, rowing power has been demonstrated to correlate to rowing performance more than VO2max, the gold standard measure of aerobic capacity (15). This suggests that improving rowing power should be an integral goal in development of training programs. In a survey of British rowing coaches, Gee et al. found that almost all coaches had their rowers perform strength and power training (3), but often assessment of peak rowing power is not performed or the testing procedures and analysis are poorly defined. With rowing power perhaps as equally important as aerobic capacity to rowing performance, rowing coaches need a sound and reliable method of evaluating rowing power that is sensitive to training induced improvements.
Traditionally, to assess rowing power performance, different tests of various lengths have been utilized. Many investigations have used the highly reliable gold standard Concept2 rowing ergometer (5), with rowers able to consistently produce performance results on this ergometer (14). Practically the Concept2 is widely used, and is the ergometer commonly used for local, regional, national, international indoor rowing championships. In the survey by Gee et al., coaches indicated using “power strokes” and/or “world class start testing protocol” to assess rowing power, although these protocols are not defined or standardized, and often rely on athletes self-reporting peak values observed during the test, all of which are problematic. Meanwhile, others have used max power from a step test (1), a modified Wingate test for rowing (13), and tests exploring the power produced in 5–10 strokes (4, 7). Furthermore, most of this work has been performed in elite or collegiate athletes, and at present there is a paucity of data on youth rowers or their peak power characteristics (11). The aforementioned tests, and current mode of analysis, often only provide a coach or physiologist with self-reported peak rowing power, and more complex equipment is required for a more detailed assessment of rowing power, and its components (drive speed, distance, and force)to be performed (16). Other relatively new ergometers, such as the RowPerfect, provide more detailed stroke and power analysis, but these ergometers are two to three times the price of a regular Concept2 ergometer, and thus largely unavailable to youth or even collegiate rowing teams. Moreover, US National team testing standards dictate ergometer testing takes place on stationary ergometers, not dynamic, such as the RowPerfect. As such, coaches need a cost effective reliable alternative for assessing and analyzing rowing power, using the Concept2 ergometer.
Consequently, using a free commercially available software application, the purpose of this investigation was to collect and analyze stroke-by-stroke data during a 15 second peak rowing power test, and provide peak rowing power characteristics of youth rowers. Additionally, we sought to determine if a plyometric training intervention could improve peak rowing power and its determinants (drive length, speed, and force) using this test and analysis approach, which are largely missing from the literature. Collectively, this study could provide a new cost effective method for quantifying rowing power that is capable of detecting changes in rowing power in response to training.
METHODS
Participants
Sixteen male rowers were recruited from a local competitive high school rowing program. The participants were separated into a plyometric (PLYO) group and control (CON) group each consisting of 8 rowers, with the groups matched using pre-training 500 m time trial times. All participants, and their legal guardians, provided written informed consent prior to participation in this study. This study was approved by the Institutional Review Board of Skidmore College.
Protocol
Training Program
The participants completed a 4 week plyometric or steady state cycling program in between testing sessions. The 4 weeks of plyometric training were used to elicit improvements in rowing power, and although 4 weeks is a short-term plyometric period (10) it has been shown to elicit significant physiological and performance changes (8). The PLYO and CON groups both performed 30 minutes of plyometric or steady state cycling prior to their on water practice, 3 days/week, with 48 hours between sessions (e.g. Monday, Wednesday, and Friday). The plyometric training consisted of vertical jumping movements, and steady state cycling was used for the control group so that neither group benefited from additional rowing specific training. The steady state cycling was performed below ventilatory threshold, using the “talk test”, or the ability to carry on some conversation, as an approximate indicator of intensity. After the 30 minutes of plyometric or cycling training had been completed, the participants proceeded to their regular on-water practice. Acceptable adherence to the plyometric training program was set at 85% of sessions.
The peak power measurements were completed during a single testing session on the weekends before and after the 4 weeks of training. As part of a separate study, the participants completed an 8-minute submaximal economy test and a maximal 500m time trial 60 and 30 minutes before the peak rowing power measurement, respectively. Testing was performed at least 48 hours after the last plyometric session, allowing for adequate recovery.
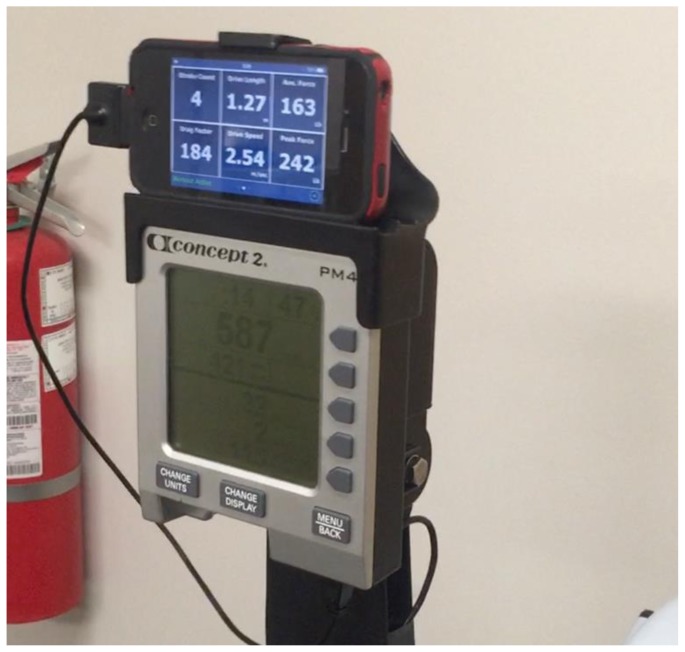
The participants’ height (Seca 217, United Kingdom), weight (Belfour Inc., WI, USA), and thigh and calf circumferences (Gulick tape measure) were measured upon arrival prior to further testing. All rowing tests were performed on a Concept2 Model D ergometer with a PM4 monitor (Concept2, VT, USA). The Concept2 ergometer has been demonstrated to be a reliable rowing ergometer (5). The ergometer was connected, via USB adapter cable, to a mobile device (iPhone 4S, Apple, CA, USA) loaded with the Concept2 ErgData application which held in place with a commercially available docking station (Concept2). In addition to measuring rowing power (Watts) on the PM4 monitor, the Ergdata application allowed the simultaneous measurement of Peak Force (lb), Average Force (lb), Drive Speed (m/s), and Drive Length (m), all of which were recorded stroke-by-stroke. This was achieved by placing a video camera behind the ergometer to record the ergometer screen and Ergdata screen (Figure 1). Video analysis and data acquisition were performed after the testing session to obtain the stroke-by-stroke data, which was input into an electronic spreadsheet. Peak rowing power was recorded as the maximum wattage achieved during the test, a previously validated method (5).
Figure 1.
An overview of the ergometer screen and ErgData application from the video camera in order to record the measurements during peak rowing power testing.
The rowing power test consisted of three maximal trials of 15 seconds with 1-minute rest between trials. As the Concept2 ergometer cannot be set to perform an interval shorter than 20 seconds, the participants were instructed to only row for the first 15 seconds and then stop rowing. This was done so that the rowers performed ~10 strokes, as a 10 stroke test has been used before for rowing power (4). The resistance on the ergometer was set to the maximum (10 arbitrary units). The participants were instructed to perform a self-selected 2-minute warm up before the test, and a 2-minute cool down after the test.
Statistical Analysis
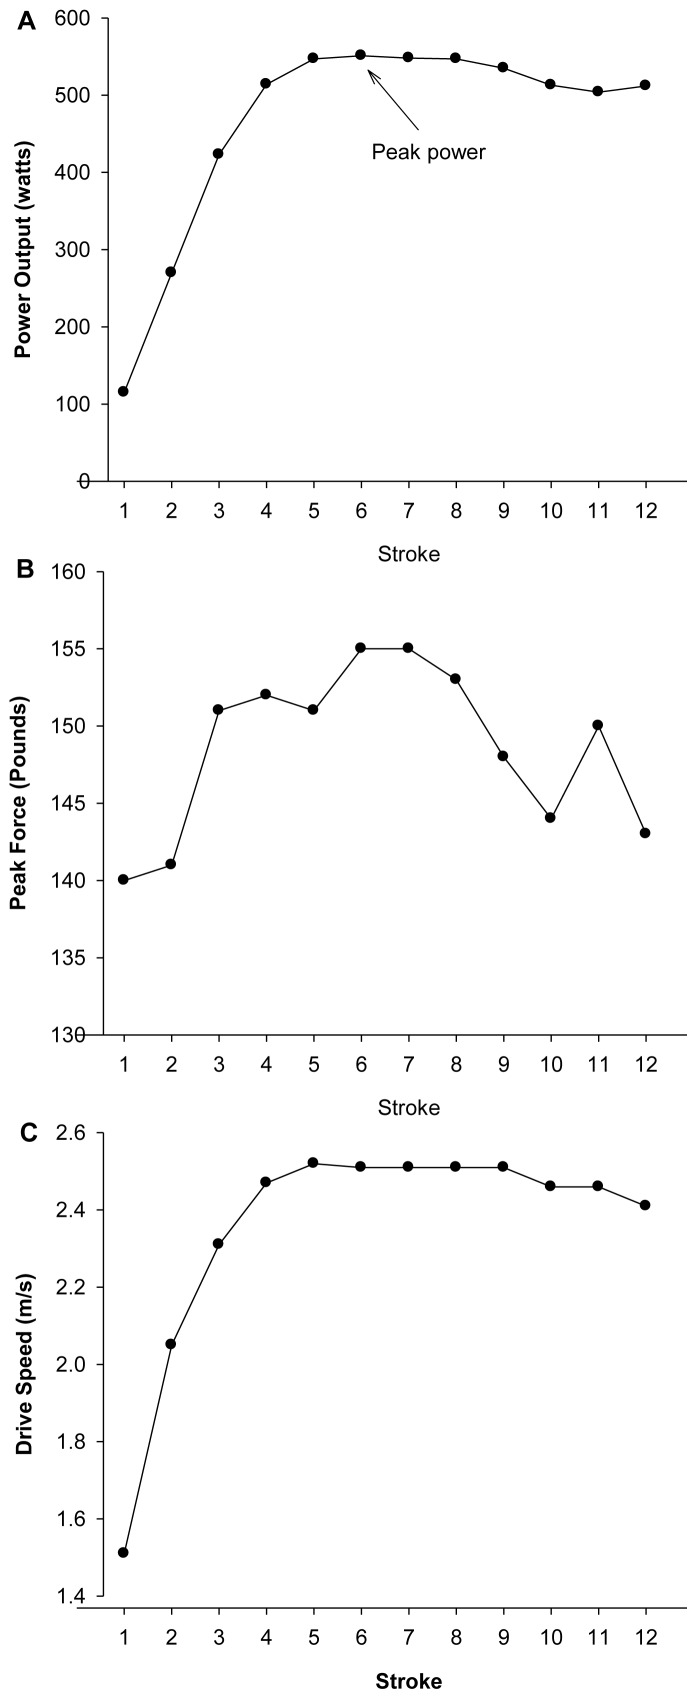
The trial with the highest peak power was chosen, then on an individual basis the peak power observed within the test was identified (Figure 2). Once the peak was established, we determined the stroke at which peak power was achieved, the linear slope to peak power, and the sum of power to peak. All participants had completed at least 10 strokes within the 15 sec period, but only the first 10 strokes were selected for analysis. For stroke-by-stroke data, a mixed model Analysis of Variance (ANOVA) was used to determine the potential interactions and impact of group (2 levels, PLYO vs. CON), time (2 levels, Pre vs. Post) and stroke (10 strokes) with repeated measures for time and stroke. Pre-planned comparisons were used to determine if any group differences existed at baseline, and in changes in peak responses both within and between groups. To determine the potential reliability across the 3 trials, a reliability coefficient (Cronbachs α) was calculated. All statistics were run using commercially available software (SPSS v. 23, IBM, Armonk, NY). The level of significance was established at p ≤ 0.05. Data are reported as means ± standard error of the mean.
Figure 2.
Example of individual stroke-by-stroke analysis of rowing power (panel A), peak force (Panel B), and Drive Speed (Panel C).
RESULTS
Participant Characteristics
All participants successfully completed the training program with adherence rates above 85%. The PLYO and CON groups were matched based on a 500m rowing time trial before training (PYO=99.8±9.6 seconds, CON=98.8±5.8). There were no differences (p>0.05) in height, weight, or thigh and calf circumferences between or within groups prior to training (Table 1). However, despite no within group changes, there was a significant difference in thigh circumference between PLYO and CON (p<0.05) after training.
Table 1.
The Participant Characteristics at Baseline and Following the 4 week Intervention
| Control Group (n=8) | Experimental Group (n=8) | |||
|---|---|---|---|---|
|
|
|
|||
| Pre | Post | Pre | Post | |
| Age (yr) | 16 ± 0.6 | 16 ± 0.6 | 16 ± 0.8 | 16 ± 0.8 |
| Height (cm) | 177 ± 4 | 177 ± 4 | 179 ± 6 | 179 ± 6 |
| Weight (kg) | 66.5 ± 9.4 | 66.2 ± 8.6 | 71.4 ± 6.5 | 71.8 ± 6.9 |
| Thigh Circumference (cm) | 49 ± 4.8 | 49 ± 3.0 | 52 ± 4.0 | 53 ± 3.5* |
| Calf Circumference (cm) | 35.4 ± 2.6 | 34.5 ± 2.5 | 35.1 ± 2.0 | 35.2 ± 1.9 |
Data are presented as mean ± standard deviation.
Significant difference between groups at post.
Peak Rowing Power
At baseline, peak rowing power was 566 ± 82 Watts for CON and 585 ± 115 Watts for PLYO, with no significant difference between groups before training (p>0.05). Neither group exhibited a significant change in peak rowing power over the 4 weeks. After training, peak rowing power was 569±75 and 629±51 Watts for CON and PLYO groups respectively, with a trend towards a significant difference between the groups (p=0.08). The peak power responses were also highly reliable and exploration of the 3 baseline trials indicated a significant reliability coefficient (Cronbachs α = 0.99, p < 0.05), and this high reliability across trials remained for post-testing (Cronbachs α = 0.97, p < 0.05).
Stroke-by-Stroke Rowing Power
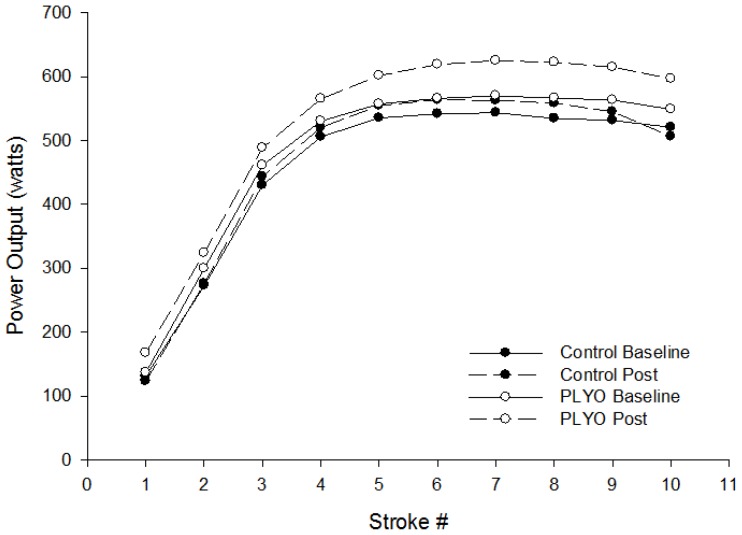
In regards to rowing power over the entire test, there was a significant stroke by time interaction (Figure 3), indicating that more power was produced over the entire test after training (p>0.05). There was also a significant main effect of time indicating an increase in rowing power produced during the test in both groups over the 4-week period (Figure 3, p>0.05). Finally, as expected, there was a main effect of stroke to stroke, indicating increased power output with increasing stroke number. Baseline PPslope (80±20 v. 65±15 watts/stroke) were not different between groups (Control v. PLYO, p>0.05). After 4 weeks of training, PPslope (78±18 v. 74±19 watts/stroke) was unchanged and not different between groups (Control v. PLYO, respectively, p>0.05). However, the stroke at which peak power was achieved during the test trended to decrease in PLYO (7.1±1 to 6.9±0.9 strokes, p=0.08).
Figure 3.
Stroke-by-stroke Rowing Power observed during the 15 second maximal rowing ergometer tests in both the control and experimental (PLYO) groups, performed before and after 4-weeks of plyometric training. Error bars omitted for clarity.
Stroke-by-Stroke Average and Peak Force
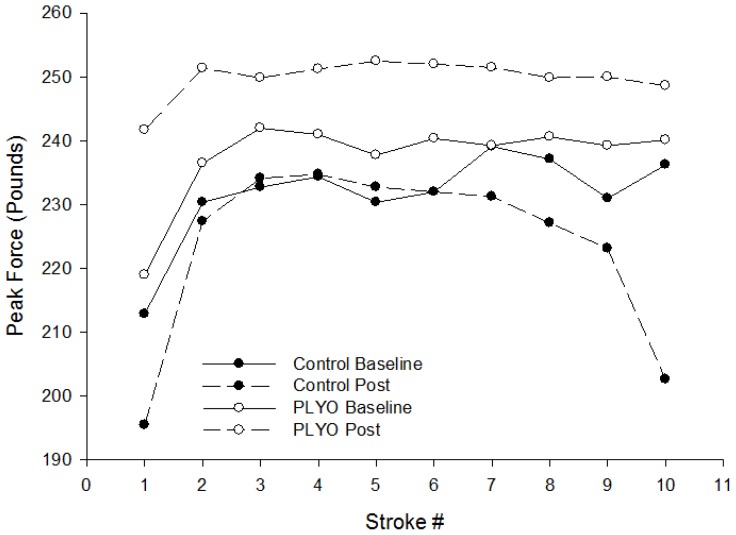
No significant interactions were observed for time, stroke, or group in average stroke force. Only a main effect for stroke number was observed for average force (p>0.05), indicating increased force output with increasing stroke number. However, in peak stroke force (Figure 4) there was a significant stroke by time interaction (p = 0.05), where peak force over the test increased from pre to post intervention. There was also a trend towards main effect of time in peak force (p=0.07), suggesting an increase in peak force from pre to post intervention (Figure 4).
Figure 4.
Stroke-by-stroke Peak Force observed during the 15 second maximal rowing ergometer test in both control and experimental (PLYO) groups, performed before and after 4-weeks of plyometric training. Error bars omitted for clarity.
Stroke-by-Stroke Drive Length and Drive Speed
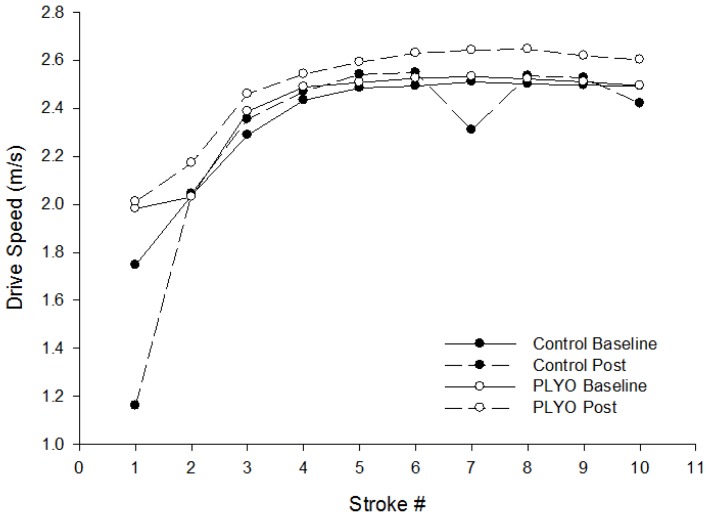
Drive length did not differ between or within groups before or after testing (p>0.05). However, there was a significant group by time by stroke interaction (p < 0.05) indicating that the PLYO group increased drive speed over the peak power test more so than the control in response to the 4-week intervention (Figure 5). Additionally, there was a significant group by time interaction for drive speed, suggesting that drive speed increased to a greater degree from pre to post intervention in the PLYO group (Figure 5, p<0.05).
Figure 5.
Stroke-by-stroke Drive Speed observed during the 15 second maximal rowing ergometer test in both control and experimental (PLYO) groups, performed before and after 4-weeks of plyometric training. Error bars omitted for clarity.
DISCUSSION
The purpose of the current study was to utilize a new method of assessing and recording peak rowing power, and its determinants (drive length, speed, and force), using the Concept2 ergometer instrumented with the ErgData application, in youth rowers in response to a training intervention. This novel combination of test and stroke-by-stroke analysis was not only able to show that rowing power measured over the test increased with training, but also documented changes in peak force and an increase in drive speed mediated by plyometric training and is the first study to do so. This study is also the first to provide normative data for peak power and its determinants of youth rowers. Finally, the test displays high within day reliability. Collectively, these findings suggest that this new method of plotting stroke-by-stroke rowing data using a standard rowing machine, inexpensive equipment, and a free software application can reveal changes in rowing power associated with training, which may not be detectable with a simple assessment of peak power.
Recently, rowing power (1, 7, 13) and generalized muscle power (6) have been shown to be key predictors of rowing performance (i.e. 2 km time trial). Previously, peak rowing power has been evaluated using an unspecified number of strokes on the ergometer (3) or, more specifically, using 5 and 10 stroke tests (4). These methods usually record rowing power as the single highest wattage seen during the test. However, we provided a more comprehensive assessment of changes in rowing power and its components, stroke force and drive speed, using our novel stroke-by-stroke assessment and analysis. Plyometrics have been shown to increase muscle power (12) and are commonly used in athlete populations (10). A 4 week intervention of either plyometric training to increase rowing power (3) or steady state endurance exercise performed in combination with on the water training resulted in significant improvements in drive speed, peak force, and power. Specifically, plyometric training augmented the increase in drive speed (Figure 5) observed over the intervention period, and tended to result in greater peak power and power observed over the 15 sec test (Figure 3).
The video based measuring system was able to accurately record peak rowing power. Usually, obtaining peak rowing power values relies upon a rower or coxswain during or after the test has been completed, which may or may not be reliable. Using a video system to record these values increases the accuracy of recordings, and decreases the potential subjectivity of measuring peak rowing power. Furthermore, utilizing the stroke-by-stroke approach, but not the single peak power measurement, indicated a significant time effect suggestive of a training-induced increase in power, with a trend for differences in peak between groups post-intervention (p = 0.10). The stroke by stroke data also showed a trend towards increased peak force per stroke after plyometric training. Interestingly, the PLYO group was shown to have increased drive speed over the test when compared to Control. Without the use of the video, the Ergdata application, and stroke-by-stroke analysis method, none of these subtle changes would have been detected. Thus, we contend that use of the Ergdata application to capture components of rowing power, coupled with video capture of stroke-by-stroke data, provides a robust assessment of rowing power, a factor known to influence and/or predict rowing performance, which can be done using existing rowing equipment with minimal instrumentation or investment.
There are some additional considerations to this method of testing. A coach or rower must own either an iPhone or Android device in order to use the ErgData application, in addition to a video camera, and special order USB cable or ergometer with bluetooth. Although, a second cell phone could be substituted as a suitable way to record the ergometer screen. Alternatively, development or modification of software could be used to link or capture the stroke-by-stroke data into a computer directly. Recently, the Ergstick application has been developed for this purpose, but outputs the data, by time and not stroke, and costs ~40$ for each install. Finally, the use of this system is conducive to assessing only one rower at a time. However, the testing protocol used in this investigation only took 4 minutes for all 3 trials, so a large group of rowers can be tested in a short period of time using this method. Additionally, given the high reliability of the test, 1 trial is likely sufficient to capture the peak performance, shortening the already brief time requirement, and increasing the throughput. It remains to be seen how longer training periods may affect this assessment or how this assessment may differ in elite and/or female rowers.
In the current study we aimed to determine the efficacy of a new method of assessing peak rowing power using the Concept2 ergometer, ErgData app, a video camera, and stroke-by-stroke analysis and whether this method could detect changes in rowing power, and its components, in response to training. This method of analysis was able to show changes in rowing power, peak force, and drive speed. Additionally, for the first time we provide normative data for peak rowing power of youth rowers. As rowing power is a key determinant of rowing performance, and rowing power is increasingly being trained by many rowing coaches, this easy to use and cost-effective system could be a valuable way for coaches to quantify and track performance characteristics of their athletes.
ACKNOWLEDGEMENTS
We would like to acknowledge the gracious participation of the rowers and coaches of Saratoga Rowing Association.
REFERENCES
- 1.Bourdin M, Messonnier L, Hager JP, Lacour JR. Peak power output predicts rowing ergometer performance in elite male rowers. Int J Sports Med. 2004;25(5):368–373. doi: 10.1055/s-2004-815844. [DOI] [PubMed] [Google Scholar]
- 2.de Campos Mello F, de Moraes Bertuzzi RC, Grangeiro PM, Franchini E. Energy systems contributions in 2,000 m race simulation: A comparison among rowing ergometers and water. Eur J Appl Physiol. 2009;107(5):615–619. doi: 10.1007/s00421-009-1172-9. [DOI] [PubMed] [Google Scholar]
- 3.Gee TI, Olsen PD, Berger NJ, Golby J, Thompson KG. Strength and Conditioning Practices in Rowing. J Strength Cond Res. 2011;25(3):668–682. doi: 10.1519/JSC.0b013e3181e2e10e. [DOI] [PubMed] [Google Scholar]
- 4.Hartmann U, Mader A, Wasser K, Klauer I. Peak force, velocity, and power during five and ten maximal rowing ergometer strokes by world class female and male rowers. Int J Sports Med. 1993;14(Suppl 1):S42–5. doi: 10.1055/s-2007-1021224. [DOI] [PubMed] [Google Scholar]
- 5.Hopkins WG, Schabort EJ, Hawley JA. Reliability of power in physical performance tests. Sports Med. 2001;31(3):211–234. doi: 10.2165/00007256-200131030-00005. [DOI] [PubMed] [Google Scholar]
- 6.Huang C, Nesser TW, Edwards JE. Strength and power determinants of rowing performance. J Exerc Physiol Online. 2007;10(4):43–50. [Google Scholar]
- 7.Ingham S, Whyte G, Jones K, Nevill A. Determinants of 2,000 m rowing ergometer performance in elite rowers. Eur J Appl Physiol. 2002;88(3):243–246. doi: 10.1007/s00421-002-0699-9. [DOI] [PubMed] [Google Scholar]
- 8.Lloyd RS, Oliver JL, Hughes MG, Williams CA. The effects of 4-weeks of plyometric training on reactive strength index and leg stiffness in male youths. J Strength Cond Res. 2012;26(10):2812–2819. doi: 10.1519/JSC.0b013e318242d2ec. [DOI] [PubMed] [Google Scholar]
- 9.Mäestu J, Jürimäe J, Jürimäe T. Monitoring of Performance and Training in Rowing Sports Med. 2005;35(7):597–617. doi: 10.2165/00007256-200535070-00005. [DOI] [PubMed] [Google Scholar]
- 10.Markovic G, Mikulic P. Neuro-musculoskeletal and performance adaptations to lower-extremity plyometric training. Sports Med. 2010;40(10):859–895. doi: 10.2165/11318370-000000000-00000. [DOI] [PubMed] [Google Scholar]
- 11.Mikulić P, Ružić L. Predicting the 1000m rowing ergometer performance in 12–13-year-old rowers: The basis for selection process? J Sci Med Sport. 2008;11(2):218–226. doi: 10.1016/j.jsams.2007.01.008. [DOI] [PubMed] [Google Scholar]
- 12.Potteiger JA, Lockwood RH, Haub MD, Dolezal BA, Almuzaini KS, Schroeder JM, Zebas CJ. Muscle Power and Fiber Characteristics Following 8 Weeks of Plyometric Training. J Strength Cond Res. 1999;13(3):275–279. [Google Scholar]
- 13.Riechman SE, Zoeller RF, Balasekaran G, Goss FL, Robertson RJ. Prediction of 2000 m indoor rowing performance using a 30 s sprint and maximal oxygen uptake. J Sports Sci. 2002;20(9):681–687. doi: 10.1080/026404102320219383. [DOI] [PubMed] [Google Scholar]
- 14.Schabort E, Hawley J, Hopkins W, Blum H. High reliability of performance of well-trained rowers on a rowing ergometer. J Sports Sci. 1999;17(8):627–632. doi: 10.1080/026404199365650. [DOI] [PubMed] [Google Scholar]
- 15.Shephard RJ, Allen C, Benade AJ, Davies CT, Di Prampero PE, Hedman R, Merriman JE, Myhre K, Simmons R. The maximum oxygen intake. An international reference standard of cardiorespiratory fitness. Bull World Health Organ. 1968;38(5):757–764. [PMC free article] [PubMed] [Google Scholar]
- 16.Sprague RC, 4th, Martin JC, Davidson CJ, Farrar RP. Force-velocity and power-velocity relationships during maximal short-term rowing ergometry. Med Sci Sports Exerc. 2007;39(2):358–364. doi: 10.1249/01.mss.0000241653.37876.73. [DOI] [PubMed] [Google Scholar]


