Abstract
The adaptive immune response generates a large repertoire of T cells with T-cell receptors (TCRalpha and TCRbeta) and B cells with immunoglobulins (Ig). The repertoire changes in response to antigen stimulation both through amplification of specific cells (clonal expansion) as well as somatic hypermutation of immunoglobulins. Alterations of the immune repertoire have been observed in response to acute disease, such as external pathogens, or chronic diseases, such as autoimmunity and cancer. Here we establish experimental and analytical protocols for quantifying the peripheral blood of healthy human individuals by profiling the immune repertoire for the Complementarity determining region 3 (CDR3) of the variable regions of TCRbeta (CDRβ3) and the IgG heavy chain (CDRH1, CDRH2, CDRH3). The results demonstrate that 40 ml of blood are sufficient to reliably capture the 10,000 most common TCRbeta and 1000 most common IgG and determine their relative frequency in the circulation. We conclude that by using an accessible sample size of human PBMC one is able to robustly monitor alterations in the immune repertoire.
Keywords: Immune repertoire, cancer, T cell receptor, B cell receptor
Introduction:
The efficacy of the adaptive immune response depends on the diversity and flexibility of its immune repertoire. The diversity is represented by a large number of different sequences for critical receptors and the flexibility is from the ability to amplify the representation of selective receptors. Two of the key cell types contributing to this flexible diversity are T cells, with their T cell receptor (TCR) and the B cells with their B cell receptor (BCR) also known as the immunoglobulins (IGs). In individual B and T cells the genomic sequence for each of these receptors, during development, undergoes a rearrangement through recombination of variable (V), diversity (D) and joining (J) genes, also known as VDJ recombination (Tonegawa, 1983; Tonegawa, 1988). Each individual B or T cell expresses only a single sequence. Each of its offspring are clones from it, expressing essentially the same BCR or TCR sequence referred to as a clonotype.
The BCR, is composed of a heavy chain and one of two different light chains (𝜅 and 𝜆). The heavy chain undergoes a recombination in a gene locus of different segments of V, D and J genes. (Li et al., 2004; Tonegawa, 1983; Tonegawa, 1988). Additionally, there are different constant (C) genes (M, D, G1–4, E, A1–2). The light chain, independently of the heavy chain, recombines from an analogous collection of V, J and C genes. The TCR undergoes a similar pattern. Instead of a heavy and light chain they have α and β chains, although a subset have γ and δ chains. The TCR also undergoes recombination. The α chain, like the light chain, undergoes a rearrangement of V, J and C gene segments and the β chain, like the heavy chain, undergoes a rearrangement of V, D. J, and C gene segments. The variable regions which engage the antigen in the BCR and antigen and the major histocompatibility complex (MHC) molecule in TCR are made of three domains referred to as Complementarity Determining Regions (CDR), or CDR1, CDR2 and CDR3. The CDR1 and CDR2 are contained within the V segment. The CDR3 is encoded by the junction between the V, (D), and J segments, of the TCR and BCR (Janeway, 2005).
The initial diversity of the BCR and TCR, through the VDJ recombination, is established during development. Many subsequent events then affect the distribution of these to generate what is called the immune repertoire. During development, cells that express BCR or TCR that can bind to self-antigens can undergo clonal deletion, a negative selection. Both the T cells and B cells also undergo positive selection. When a T cell is activated, it rapidly divides, which alters the distribution of the TCR in body. B cells also undergo positive selection usually in secondary lymphoid organs such as the spleen or lymph nodes. B cells that are activated can enter into the germinal centers of the secondary lymphoid organs and undergo two additional changes (Tas et al., 2016). First is somatic hypermutation, which is the consequence of point mutations predominantly in the V-region of circulating B cells. This increases the diversity of BCR in the population. The second is isotype or class-switching. The BCR, also known as immunoglobulin (IGs), exists in different classes (IgM, IgD, IgA, IgG, IgE). Early in the development, through their constant region, they are all membrane bound, predominantly IgM and IgD. Upon activation, usually with the assistance of activation by T cells, they can switch part of their constant region so they can form different classes of IGs such as IgA and IgG. The variable regions are unaltered and thus the binding specificity is the same. All isotypes can also be alternatively spliced so as to lose their transmembrane domain, so that they can be secreted. At this point they are no longer referred to as BCR, implying a receptor, and instead, at are usually referred to as IGs.
Based on the potential recombinations as well as the insertion of nontemplated nucleotides in the junctions between V, (D), and J segments, the estimates for the diversity of TCR or BCR, depending on the assumptions made, range considerably with estimates from 1012 to 1018 (Elhanati et al., 2015; Murugan et al., 2012; Robins et al., 2009) with a further diversification as a result of somatic hypermutation (Janeway, 2005). The extent of the actual diversity of the TCR and BCR in the human body has been speculated to be 1014 (Schroeder, 2006). It has proven problematic to quantitatively determine the actual diversity and distribution of that diversity. One study came to the conclusion that the actual VDJ recombinations were not random, and thus the actual diversity was much smaller (Pasqual et al., 2002).
The diversity and distribution of the immune repertoire varies with acute disease, e.g. infection, or chronic pathologies such as cancer or autoimmune disease (Hoehn et al., 2016; Hou et al., 2016; Jiang et al., 2013; Wendel et al., 2017). The ability to characterize the extent of the diversity, but also the representation of the different TCR and BCR could provide a valuable tool for understanding both the normal dynamics of the immune response and the pathologies during autoimmune disease, infection and cancer. Equally important, they could provide useful diagnostics for following pathogenesis or provide insides on immunotherapy (Georgiou et al., 2014; Miho et al., 2018; Robinson, 2015).
Recent advances in next generation sequencing methods have allowed new ways of studying the immune system in great depth. The mass sequencing of the repertoires of BCR and TCR could potentially provide valuable information on the workings of these systems as well as the state of the patient’s health. Like all genomic and RNA sequencing processes, the methods for preparing the cDNA libraries are critical to obtaining meaningful data. For a library to be robust and reproducible, but also be an accurate reflection of the distribution of the TCR and BCR repertoires present in situ, various forms of error must be prevented and corrected. Data errors, bottlenecks, contamination, and bias can all occur in many of the processing steps and confound analysis (Greiff et al., 2015b). For limitations that cannot be completely remedied, it is useful to quantify the extent to which they can be managed. Thus, any analysis must evaluate the various forms of error that can occur during processing and quantify the extent to which the sequenced cDNA library represents the total diversity and distribution of the patient’s immune repertoire.
The goal of this work is to quantify the required blood volume draw for characterizing the immune-repertoire of an individual evaluate the robustness and reproducibility of sequencing the repertories for the immunoglobulin IgG from B cells (CDRH1, CDRH2 and CDRH3) and the TCRbeta (CDR3) from T cells from whole peripheral blood mononuclear cells (PBMCs). For this analysis we focused on determining the number of distinct clonotypes at the amino acid level (100% amino acid identity) (Greiff et al., 2015a; Greiff et al., 2017). Thus, offspring from a common B cell that diverge in sequence due to somatic hypermutation will be considered discrete clonotypes. We used the amino acids because we wanted to determine how many different functional clonotypes were present in the peripheral circulation. Using the amino acids would allow for convergent development of clonotypes during somatic hypermutation. If a study is interested in the development of the different clonotypes, then it might be better to use the nucleotides to allow the mapping of somatic hypermutation.
We will define three clonotype populations. The “Total RNA-pool” are all those contained in the entirety of the human circulation. The “Sample RNA-pool” are those in the pool of RNA that have been collected from a specific patient sample. And lastly, the “Library RNA-pool” are clonotypes present in the sequenced and processed library. The overlap of different RNA-populations taken from different samples drawn at the same time, biological replicates, informs the extent to which saturation of the Total-population is occurring across clonotype abundance levels. First, we confirm that individual libraries are fully sampled, and therefore their coverage is not improved with additional sequencing depth. Second, we examine if a library is a good representation of a sample by quantifying the overlap of two libraries made independently from RNA taken from the same sample. Finally, having validated that a sample population is well measured, we compare the overlap of multiple RNA-populations drawn at the same time to measure coverage of the Total-population.
Methods:
During processing of patient-derived samples to evaluate the repertoires for the BCR and TCR, the four sources of error that should be examined are: data errors, sampling errors, bias errors and contamination.Data Errors: Errors which alter sequences and typically arise during PCR synthesis or sequencing. These errors are a particular concern for immune repertoire sequencing where single base pair mutations must be distinguished from errors to avoid to erroneous repertoire diversity. Sampling Error: An exhaustive characterization of the repertoire in the circulation can currently not be accomplished without a drawing an impractical volume of blood. To start such a determination of the extent of the immune repertoire, the starting material must be fully sampled to allow quantification of its biological undersampling. Bottlenecks which lead to under sampling can occur at any of the steps from blood draw to sequencing depth. Resampling can then be used to measure the degree of saturation within a volume of blood and between blood draws. The distribution of the different clonotypes are known to follow a Zipf’s-law which describes a specific power-law probability distribution (Burgos and Moreno-Tovar, 1996; Greiff et al., 2015a; Mora et al., 2010). The challenge of ensuring that one has saturated the detection of all possible clonotypes is greatest with those that are most scarce. Bias errors: In addition to capturing all existing clonotypes, the accuracy of their quantification depends on removing sources of bias during reverse transcription and PCR cycles. Differences in the efficiency of annealing of different primers would compromise the quantification. Contamination: Another challenge in any sequencing experiment is cross sample contamination during batch processing. For differential analysis, small amounts of contamination can significantly affect statistical significance, especially if these occur prior to PCR amplification. Contamination is also relevant to reproducibility studies since will also cause artificial similarity in the sequenced libraries (Greiff et al., 2017).
There are a number of ways to control for these errors. Basic library analysis methods can inform if the sequencing depth is sufficient; however, they cannot say if a library is an accurate representation of the original blood draw or, more importantly, of the full diversity in the circulation. While it is true that it is not possible to sequence every rare clonotype of a human, there are levels of reproducibility that should be achievable. Most evaluations of biological saturation come from the perspective of estimating total size of the population of the complete repertoire of TCR or IGs. These results agree with past work that the complete population size cannot be achieved without sampling the entire body (Qi et al., 2014). In depth sequencing of T-cells has indicated at total size of well over 1 million (Warren et al., 2011) and such approaches are also providing insights into the degree to which there is overlap of the repertoire on successive samples (Galson et al., 2015).
There were at least three approaches that we could have used to quantify the distribution of the IgG and TCRbeta repertoire: DNA sequencing, macroscopic RNA-seq or single cell RNA-seq. The single cell RNA-seq would allow a matching of the heavy and light chains, but would not have allowed us to sample as many cells. Quantifying the DNA would have the potential advantage of reporting the fraction of cells for each IgG or TCRbeta clonotype, independent of relative levels of expression per cell. We chose to quantify the IgG and TCRbeta by mRNA levels. This had a few advantages. The mRNA does not have introns. The full length of the variable region in IgG is less than 600 nucleotides making it possible to determine the entire variable domain using the Illumina MiSeq 2×300 paired-end sequencing workflow. Further, a sequence found in the DNA is not necessarily functional – it may not be expressed. It has been previously shown that if simultaneous sequencing is done on RNA and DNA, if one then excludes DNA reads which are not found in the RNA, then the subsequent reads from the DNA strongly correlated with the RNA (Bashford-Rogers et al., 2014).
An additional advantage of examining the RNA is the ability to quantify the repertoire using a template switch with a barcode, a unique molecular identifiers (UMI). The template used in this protocol attaches a universal priming region and unique molecular identifier or barcode to the 5’ region during cDNA reverse transcriptase (Egorov et al., 2015; He et al., 2014; Khan et al., 2016; Mamedov et al., 2013; Vollmers et al., 2013) (Supplemental Table 1 - Primers Used). Two subsequent PCR reactions amplify the library and attach Illumina sequencing adapters. The template switch offered the potential of alleviating several major possible sources of error in the pipeline. Some of the key advantages offered are as follows:
Quantification:
By attaching unique UMI to each cDNA molecule during reverse transcriptase, abundance is defined by counts of unique UMI per clonotype rather than number of raw sequence reads. This avoids the stochastic and variable nature of PCR amplification which confounds precise quantification.
Consensus Reads:
The primary form of Illumina sequence error is nucleotide substitutions. This can be greatly alleviated by forming consensus reads out of all reads that contain the same barcode and only using UMI which are above a defined sequence-abundance.
Provides tests for Contamination:
If there are two identical barcode sequences identified in different samples that also share the same clonotype, they can safely be assumed to be a result of contamination. This allows quantifying the exact number of sequences and clonotypes contaminated per library.
Universal PCR Primer:
A universal forward priming region solves the challenge of optimizing dozens of V-gene forward primers at the minor cost of also sequencing the 5’ UTR region. Additionally, new V gene alleles can be sequenced.
The results from the template switch were analyzed to determine the determine the key constraints and limitations in obtaining an immune repertoire and evaluating the extent to which a particular library population reflects the total population for the RNA for the IgG and TCRbeta.
Blood Collection.
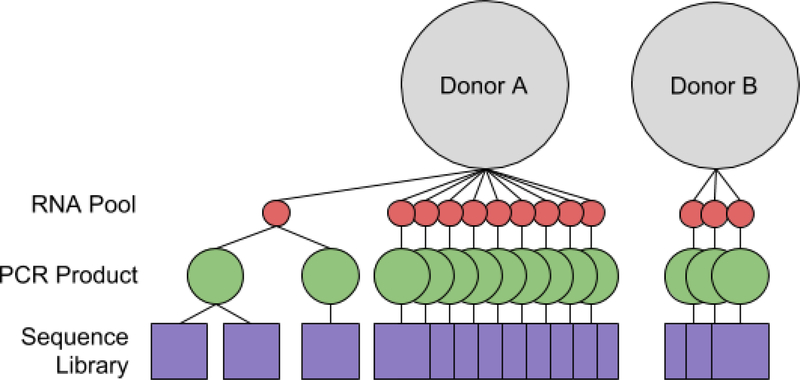
Samples were collected into ethylene diamine tetraacetic acid (EDTA) tubes each with a capacity of 10 ml from a healthy donor (Figure 1 Experimental Setup) under Rockefeller University IRB protocol SSI-0725 in accordance the recommendations of the Adaptive Immune Receptor Repertoire (AIRR) community (Breden et al., 2017). The EDTA tubes, right after blood collection, were spun at 10,000 rpm for ten minutes at 4°C to separate out the plasma, the buffy coat with the B and T cells and the red blood cells. The buffy coat was then collected by manual extraction into Trizol and processed using the Direct-zol RNA MiniPrep Plus (cat #R2070 - Zymo Research).
Figure 1 -. Experimental Setup:
An overview of sample processing. Donor-A gave ten 10ml draws of blood and Donor-B gave three. All blood draws were taken at the same time and each processed into a corresponding sample RNA pool. Aliquots of the RNA are used to create the amplified PCR product, aliquots of which are used to make multiple sequence libraries. Multiple libraries from the same sample RNA pool are compared to evaluate the coverage of the RNA-populations and multiple libraries from different sample RNA pools are compared to evaluate the Total-population.
cDNA Synthesis
Synthesis of the cDNA with template switching was performed using SMARTScribe reverse transcriptase to attach a custom template switch oligo at the 5’ region. The template switch oligo (Supplemental table 1 - 5’ adapter with molecular identifier) contains a common forward primer sequence, twelve random nucleotides, deoxyuridine (U), two riboguanosines (rG) and one LNA-modified guanosine (+G) to improve template switching (Picelli et al., 2014). Reverse primers were added to isolate the IgG or TCRbeta RNA of interest,. Additionally, uracyl DNA glycosylase treatment was employed to remove residual template switch adapters. The cDNA was purified using Qiagen MinElute PCR Purification Kit and used in the first PCR amplification.
Amplification and Indexing
Each sample was split into four 50ul PCR tubes and amplified using KAPA HiFi HotStart ReadyMixPCR Kit (Sigma, St. Louis, MO, US) for 23 cycles. This contained a step-out universal 5’ primer, (in which the non-matching 5’ end of the primer is added to the end, resulting in an extension of the amplified region) and sample-type specific step-out reverse primers both of which contained adapters for the sequencing adapters. These were then pooled and half (100ul) were run across an agarose gel before excising and purifying the band of interest (Zymoclean Gel DNA Recovery Kit. Catno: D4007). This sample was then used in a second 8-cycle PCR to attach Illumina Nextera Adapters (Nextera XT DNA Library Preparation Kit. Catno: FC-131–1024). Finally, the samples were purified and pooled for sequencing (Zymo DNA Clean & Concentrator-5. Catno: D4013).
Sequencing.
Two approaches were taken to sequencing the PCR products. MiSeq was used for sequencing of the IgG. The use of 300 basepair paired-end sequencing allowed complete coverage of the full variable region including CDRH1, CDRH2 and CDRH3. Hi-Seq was used for the TCRbeta using only 150 nucleotide single end sequencing from the 3’ end to cover the CDR3 region and 50 nucleotide 5’ forward to cover the barcode. The IgG sequences of B cells in the germinal cells undergo somatic hypermutation, which can occur throughout the V-region. Since human TCRs do not undergo hypermutation, we sequenced only 150 nucleotides which was sufficient to include the full CDR3 region.
Analysis Pipeline:
Sequencing reads were processed and merged by their barcode using the MIGEC Toolkit (Shugay et al., 2014) which provides utilities for working with barcode tagged reads. The overlap of shared RNA libraries was used as an empirical method to decide pipeline parameters. After forward and reverse end consensus reads were merged by barcode, they were aligned using PEAR (Zhang et al., 2014) (Paired end Alignment) to produce the final reads. Comparison of multiple alignment tools (unpublished data) showed PEAR to produce the best results. A custom script (available https://github.com/joel-simon/decontaminate) filtered all libraries processed in batches to control for contamination between batches. We found that in different batches the same barcode matched to the same RNA 0.07% of the time (see results). Thus, when the same cDNA sequence was found in two different batches with the same bar code, it was assumed to be the consequence of cross-contamination during sample preparation. The final step of processing was using a wrapper of IgG-Blast called MIGMAP (Turchaninova et al., 2016) to obtain a V(D)J mapping of each BCR and TCR read containing CDR regions. The output of MIGMAP was then used in final analysis. IgG sequences were considered the same if they had the same V-gene, J-gene as well as CDR1, CDR2 and CDR3 amino acid sequences. TCR comparison was done the same way but without CDR1 and CDR2 which were not sequenced.
Results & Discussion:
Library Saturation Analysis
The validation of the sequencing and analysis pipeline was done in three steps. First, the overlap of independently processed libraries taken from the same biological sample was evaluated. These replicates test for the extent to which our pipeline is robust, including factors such as: i) were there sufficient reads from the libraries, ii) if a sufficient amount of RNA or cDNA was used; iii) if the PCR reactions were introducing a bias. Then, the degree of overlap was analyzed for a number of independent blood draws taken from the same patient. By assaying the extent to which increasing the number of libraries lead to a saturation number of clonotypes, this would test the extent to which any specific biological sample was reflecting the full population in the adult or the extent to which different size biological samples would cover the full population in the circulation. Finally, samples from independent donors were compared. This would test the extent to which there was commonality either in the identity of different clonotypes, or the distribution of different clonotypes of different patients with similar or different phenotypes.
Technical Replicates: Analysis of two assays from the same Sample RNA pool:
In order to measure the overall error in the pipeline, two replicate cDNA libraries of mRNA encoding TCRbeta and IgG were made from the same sample RNA pool from the buffy coat isolated from a 10 ml blood sample collected into an EDTA tube. Library overlap can be defined in many different ways and there are many indexes of overlap from ecology that take into account species abundance (Rempala and Seweryn, 2013). However, any single index for overlap must merge distinct concepts including: count of overlapping species, abundance of those overlapping species and the correlations of abundances. In this work we choose to consider overlap as a distribution with respect to abundance. An investigator may only be interested in the acutely expressed sequences for their experiment: Two libraries might have a low level of total overlap, as a consequence of a large number of low abundance transcripts, but still have a high overlap of abundant sequences. Additionally, if an experiment is looking for certain, lower abundance sequences, probabilities can be assigned to potential false negatives.
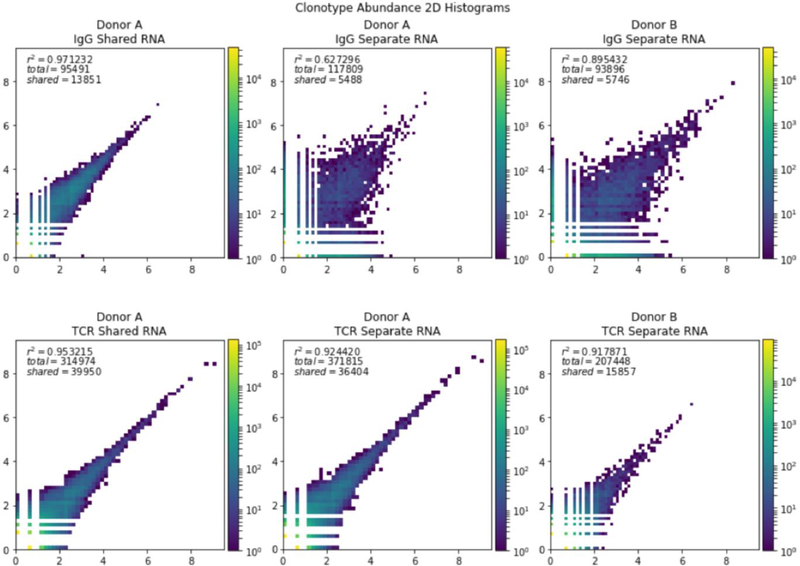
In the pair of IgG libraries generated from the same sample RNA pool, one had 45,258 clonotypes and the other had 64,084 with 13,851 in common (Figure 2, upper left, Table 1 - Library Overlaps). For the analysis of the mRNA reads for the TCRbeta, the libraries had 184,674 and 170,250 clonotypes with 39,950 shared (Figure 2, lower left). IgG libraries of four or more UMI had a Jaccard Index (size of intersection divided by size of union) of 84.8% and TCRbeta replicates had overlap of 54.0%. When the analysis is restricted to the top 10,000 most abundant clonotypes, 94.6% of the IgG and 94.8% of the TCRbeta sequences from one library were present in the other (Table 1). Thus, this procedure has saturated the reads for these 10,000 most common TCRbeta in the immune repertoire.
Figure 2. Comparison of the abundance of clonotypes in samples.
The log of the abundance of the clonotypes from different libraries was plotted as a heat map. Top row: Comparison of two samples if IgG. Bottom row: Comparison of two samples of TCRbeta. Left column: Two libraries generated from the same RNA pool. Middle column: Two libraries generated from different pools of RNA from donor A. Right column: Two libraries generated from different RNA pools of donor B.
Table 1 -.
Library Overlaps Various different metrics of overlap and similarity between repertoires. For Donor A the average is also taken between all separate RNA libraries. The r^2 value is given for the entire library.
| Number of Overlapping Clonotypes | Overlap of top 10K Clonotypes | Overlap of top 1K Clonotypes | Jaccard Overlap | r^2 | |
|---|---|---|---|---|---|
| Donor A- IgG shared RNA | 13851 | 8919 | 816 | 0.1450 | .971232 |
| Donor A- TCR shared RNA | 39950 | 6882 | 835 | 0.1268 | .953215 |
| Donor A- IgG different RNA pairwise Average | 6831.18 | 2526.28 | 310.2142 | 0.0444 | .627296 |
| Donor A- TCR different RNA pairwise average | 38207.107 | 6973.32 | 825.0 | 0.09533 | .924420 |
| Donor B - IgG different RNA pairwise Average | 4936.66 | 2975.33 | 689.33 | 0.064564 | 0.897276 |
| Donor B - TCR different RNA pairwise Average | 20960.0 | 4397.33 | 455.66 | 0.0740642245 | 0.933248 |
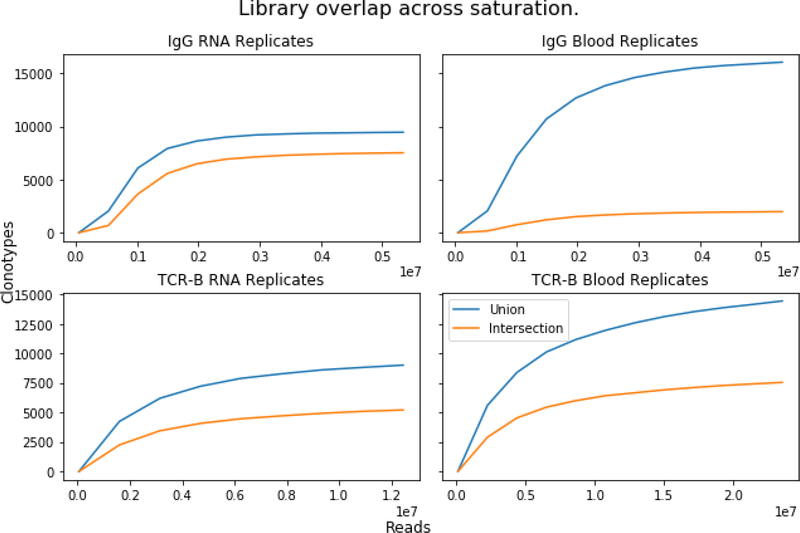
An alternative way of looking at the library overlap (and ensuring sufficient read depth) is to use a pairwise rarefaction plot of union and intersection between two libraries (figure 3 Plotting pairwise library overlap). New libraries are created from random subsamples of the original library at increasing sizes. Then, the union and the overlap (intersection) of the two libraries are plotted with increasing numbers of subsamples of the original libraries. Plotting union and intersection can, like rarefaction curves, be used to explore the extent of saturation of the number of clonotypes in a library, providing one view of library saturation. A plateauing of union and intersection indicates that the library has been sequenced thoroughly. A plateau of intersection, but not the union, indicates that either there are a disproportionate many low-abundant clonotypes that are unlikely to overlap, or erroneous sequences are arising in the pipeline. When both lines plateau, but there is a large discrepancy in the level between them, indicates that the library is being sequenced thoroughly but that starting population is being under sampled. Note that this analysis is only based on the presence of a particular clonotype, but does not take into account the distribution of the clonotypes. If a clonotype is appears once, or if it accounts for 99% of the population, it gets equal representation.
Figure 3. Plotting pairwise library overlap:
The clonotype overlap and intersection of randomly subsampled library reads. Only clonotypes of abundance greater than five are visualized. Upper left, IgG from the same RNA sample, upper right, IgG from two different RNA samples. Lower left, TCRbeta from the same RNA sample, lower right, TCRbeta from two different RNA samples.
A rarefaction plot analysis was applied to two IgG libraries generated from the sample biological sample (Figure 3, upper left). With increasing number of subsamples, both the union and the intersection of the two populations plateau at a similar level. This indicates that with increasing samples, the types of clonotypes were saturated. Increasing number of samples or increasing number of read within each sample would increase the diversity of clonotypes. With increasing numbers of subsamples of the TCRbeta neither the union nor the intersection fully plateaued, and not at the same value (Figure 3, lower left). This could be the consequence of under-sequencing or a disproportionate amount of low abundance sequences which are difficult to cover.
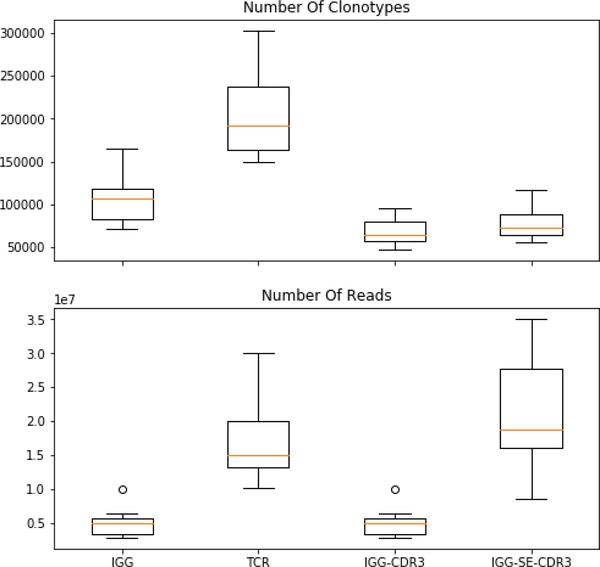
It is important to determine if this failure to saturate is the consequence of a large population of very low abundance clonotypes, or due to errors in the processing pipeline, a methodological skew to low abundance sequences, or insufficient reads of the sequences in each sample. Extra sequencing is costly and may yield diminishing returns. For the first of the three possible explanations, increased numbers of reads would not help. It is our expectation that there is an extremely large population of low abundance clonotypes and our interest is in ensuring we cover all of the activated B and T cells. If there were 1011 −1012 clonotypes which were represented just once in the circulation, deeper sequencing would not be helpful. Thus, before proceeding, it is important to determine the minimum number of reads that is sufficient to identify and sequence a clonotype that is more than a singleton in the peripheral circulation. To validate these methods, all IgG sequences which were initially sequenced in 300 paired-end Mi-Seq were re-sequenced at higher depth. This was done by repeating the sequencing of just the CDR3 region of the IgG with a five-fold increase in read-depth. This increase had no significant increase in independent CDR3 clonotypes (Figure 4).
Figure 4. Number of reads and clonotypes in all libraries:
The number of clonotypes and the number of reads for the IgG and the TCRbeta was quantified, from left to right, for all IgG (left), TCRbeta, only the CDR3 region of IgG, or increasing the number of reads for CDR3 four-fold. Increasing the number of reads of the CDR3 region of IgG (IgG-SE-CDR3) had an insignificant effect on the total number of clonotypes.
These results validated that the pipeline we used produces a thorough and reproducible sampling of a specific sample RNA pool of the IgG or TCRbeta from a single blood draw. The results further demonstrate that the results are not meaningfully improved by more reads.
Biological replicates: Saturation of reads from independent samples of the same donor:
We next applied our analysis to quantify the overlap of clonotypes from different blood draws taken at the same time from the same donor. To do so, it was important to determine the extent to which different volumes of blood accurately report the diversity of the immune repertoire (how many different clonotypes) and depth of the immune repertoire (the distribution in number of different clonotypes). We quantified the clonotypes of IgG and TCRbeta in ten independently drawn samples (Figure 2, middle column and right column, figure 3 right column), and then, by examining different subsets, quantified the degree to which they overlapped the total population from all ten tubes (Figure 5). To examine both the diversity and the distribution we quantified the overlap as a function of representation in the population. For the TCRbeta the aggregate top 1000 clonotypes were found in every sample. Coverage for the top 10,000 most represented was close to saturated by combining 3 or 4 samples, 30 or 40 ml of blood (figure 5). The top one thousand IgG required three samples (30 ml) to saturate coverage, but the top 10,000 failed to saturate even with ten tubes.
Figure 5: Library Saturation Curves.
Groups of libraries of varying sizes are compared to the merger of all libraries. The percent of clonotypes from the total pool that exist within a merged sub-group is measured for each group size. For each group size all possible combinations are averaged. On the plot of TCRbeta saturation the top 100 (green) and top 1000 (orange) completely overlap.
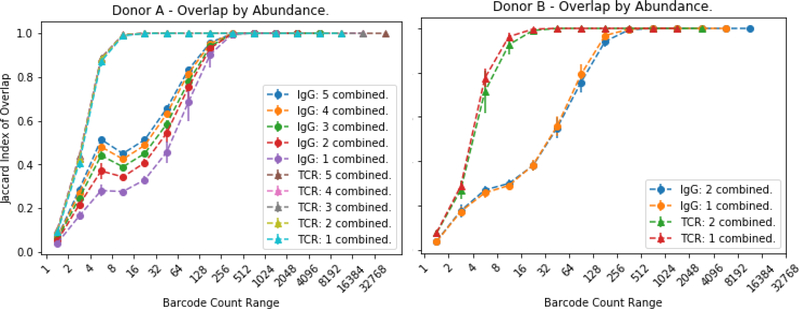
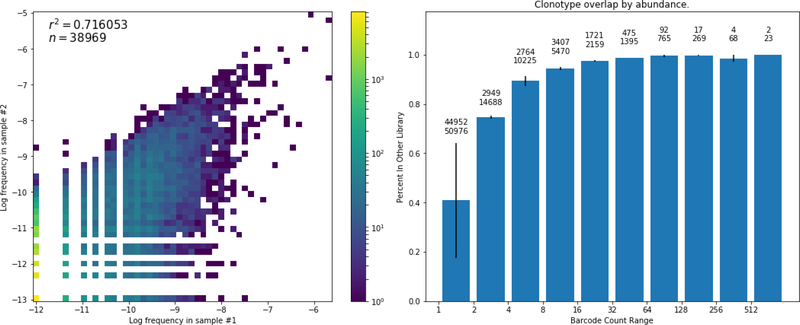
A complementary perspective on the overlap is obtained by considering the overlap of different merged libraries as a function of the abundance of the clonotype (Figure 6). We calculated a Jaccard index of overlap for different combinations of tubes. For example, every combination of two tubes against every combination of two tubes or every combination of three tubes against every other combination of three tubes (Figure 6A). Then we plotted the e+xtent of the overlap between the two groups, with a value of 1 being complete overlap, as function of the number of UMI which mapped to a particular clonotype. The number of UMI is a measure of the abundance of that clonotype in the population. In the analysis of the TCRbeta clonotypes from different samples, the overlap increased monotonically with increasing abundance of the barcode for a particular clonotype (Fig 6A, triangles). This means that the more common a clonotype, the more likely it is to be in multiple different samples. All clonotypes with abundances of eight or greater overlapped completely between all combinations of tubes. This indicates that all clonotypes of that abundance and greater are sequenced. The overlap of clonotypes of lower abundant clonotypes is not improved by pooling 1 to 5 samples. This suggests that for these rare clonotypes, a much larger sampling of blood would be necessary. Similar results were observed with samples from a second donor with three samples (Figure 6B, triangles). With any combination of 1 vs 1 or 2 vs 2 the TCRbeta clonotypes overlapped with abundance of 8 or higher.
Figure 6: Group Overlap Saturation Curves.
The overlap is measured at each range of UMI with exponentially increases ranges.</p>The overlap at a range is the percent of clonotypes in that range that are present in the other library. If an overlap between ranges was taken exclusively it would miss some clonotypes with abundances differing by one. For varying subset sizes, all possible library subsets of that size are merged. Error bars indicate standard deviation.
Some aspects of the immune repertoire of the IgG were similar. The high abundant clonotypes (>256 UMI) were found in all samples whether contrasting single tubes or five against five. However, at lower abundant clonotypes there were two differences in the IgG repertoire. First, for the clonotypes with low representation, increasing the number of tubes combined from one to five increased the overlap. Overlap of the IgG 8–16 barcode sequences improves from 20% to 43% when pooling five samples. This corresponds to an increase from 10ml to 50ml of starting sample volume. Second, the overlap did not increase monotonically with increasing representation of the clonotype in the population. There was a population of clonotypes that were represented 4–8 times per sample that showed a great deal of overlap, and then there was a slight decrease in overlap for clonotypes of intermediate representation (8–32 bar codes), and then, with greatly increased representation (>64 UMI), there was increased overlap between the biological samples until complete representation across the samples at >256 reads per clonotype. Again, similar results in the overlap of the IgG clonotypes were seen with a second blood donor (Figure 6B).
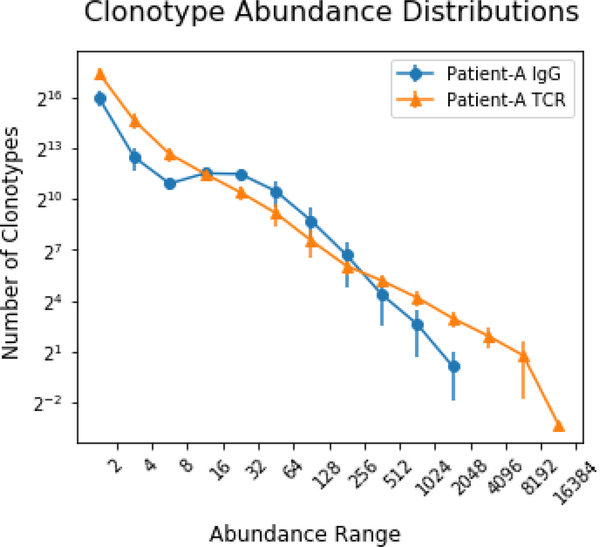
To further explore the characteristics of the repertoire we quantified the histogram of abundances (Figure 7: Clonotype Abundance Distributions). The number of clonotypes of the TCRbeta decreases roughly linearly on a log-log plot with increasing abundance of the clonotype. In contrast, the distribution of the IgG repertoires shows a greater abundance of more middle abundant clonotypes (represented by 8– 64 bar codes) and no clonotypes that are as highly abundant as the most abundant TCRbeta clones. There are more clonotypes of 16–31 abundance than those of 4–8. These characteristics of the repertoire is most likely the product of sequencing multiple merged B-cell populations with varying RNA expression levels. An RNA population highly concentrated in few expressing cells would require more material to saturate than the same total population evenly spread out among many cells. This could very well be the case for B cells where plasma blasts express much more Ig mRNA than naïve B cells. This may contribute the large differences in TCR and IgG repertoire saturation. Additionally, the hypermutation that occurs upon stimulation of a B cell may put a limit on the maximum representation of any IgG and may prevent the appearance of very highly abundant clonotypes.
Figure 7: Clonotype Abundance Distributions:
A histogram of the number of clonotypes that are found within each barcode abundance range. Displayed for IgG and TCRbeta clonotypes and averaged across all ten libraries. The IGG clonotype distribution is skewed towards those of mid-range abundance, with significantly fewer high abundance. Error bars correspond to standard deviation.
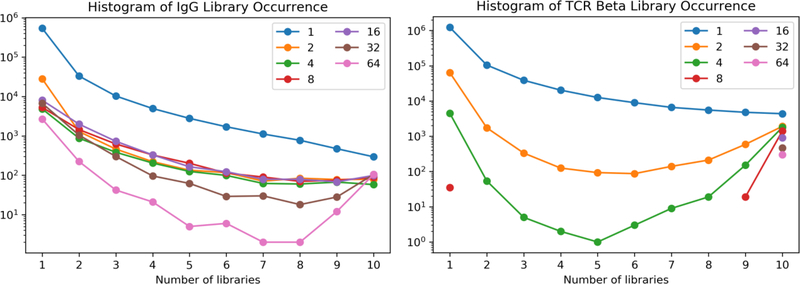
There is a differential distribution of the frequency of different clonotypes across the libraries for both IgG and TCRbeta (figure 8: Histograms of libraries Occurrence). For IgG the clonotypes for which there is only one read, the most are found in one library, with a decrease in the number of singletons found in 2, 3, 4 up to 10. However, since there are more singletons of the IgG, they are found distributed throughout. As one examines, clonotypes that appear with two reads, there is a similar distribution. Then with four or eight independent reads per clonotype, the number of total clonotypes decreases, but one starts to see an increase in the number found in all ten libraries. As one increases to clonotypes that have 8, 16, and 64 reads, they are found with increasing frequency in all ten libraries.
Figure 8: Histograms of libraries Occurrence.
A histogram showing the distribution of clonotypes of a single read, or 2, 4, 8, 16, 32 or 64 reads per clonotype as a function of the number of libraries in which they were found. For the TCRbeta, at 8 reads per clonotype and above, they were almost all found in all ten libraries.
The effect on distribution of TCRbeta iis even more dramatic. For the clonotypes for which there is only one read, the frequency of appearance decreases as one goes to 2, 3, or more libraries. However for clonotypes with even two reads, they increase even more frequently in many librareis, and even more dramatically for clonotypes with four separate reads. With clonotypes of 32 and 64 reads, they are almost exclusively found in all ten libraries.
Quantifying Contamination.
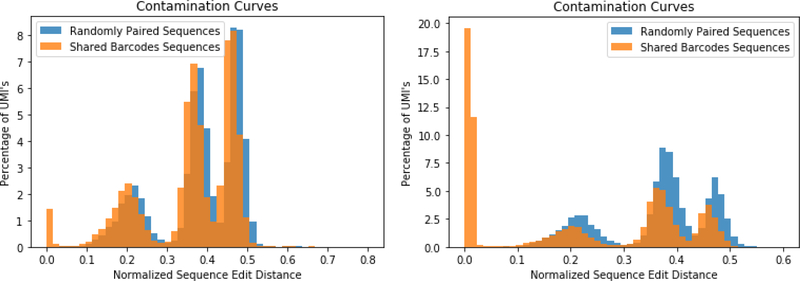
We used a barcode that was 12 nucleotides long which has 16.7 million possible combinations and each of our libraries used a range of 300,000 to 700,000 different UMI. Some reuse of UMI is expected so we tested the frequency with which any bar code was coupled to the same RNA. This was done by comparing the frequency with which a barcode in one library was found in another library and then percentage of time that the shared bar code matched to the same RNA (figure 9). The comparison was done by taking all pairs of matching bar codes and then comparing the similarity of their RNA sequences using a normalized edit distance, a measure of string similarity normalized from 0 to 1, as a quantification of similarity. A distance of zero means that they are identical. A comparison of completely random sequences, shows some discrete peaks in similarity, which represent some common regions in the VDJ genes, but only 0.003% of the RNA had the identical sequence (Figure 9, blue). Since the UMIs were randomly mixed, we think that the 0.003% commonality is due to a random selection.
Figure 9 -. Shared barcode Sequence Similarity Histograms:
Identical Bar codes from two different libraries were compared for the similarity of the coding sequence of their RNA. Similarity was quantified with a histograms of the normalized edit distance. If the normalized sequence distance is 0, then the sequences are identical. If identical bar codes from two different libraries also have identical coding sequences (peak at 0), those bar codes were characterized as contamination and discarded. As a control, when a matching was done of randomly matched bar codes (blue histogram), there were no values at 0. The other peaks correspond to sequences that share common regions of the V, D or J genes. The libraries that showed the highest degree of contamination (peak at 0) are shown for (Left) the pair of TCRbeta libraries (B3 & B10) and (Right) the pair of IgG library (B6 & B9). The fraction of each pairing of libraries that has values at zero is shown for the complete set of matches between libraries in Figure 10.
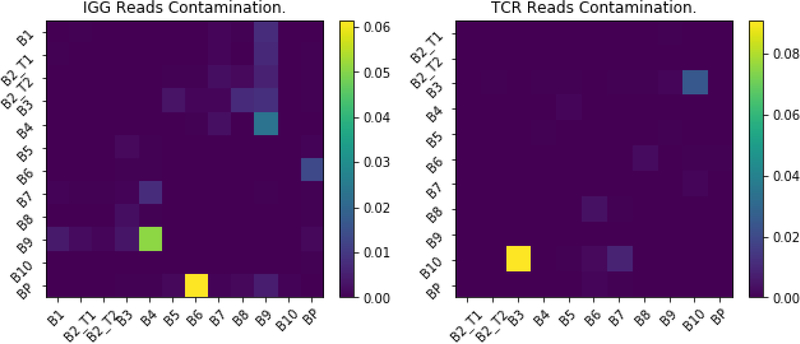
In most pairings of libraries, when comparing sequences with the same bar code, only 0.074% of these had common RNA sequences (Figure 10). This puts an upper limit on the probability of two different RNA mapping to the same bar code by chance. However, in two of the pairings of libraries, we found that a much higher percentage of the shared bar codes mapped to the same RNA. In one pair of TCRbeta we found 0.9% of one samples bar codes had the same RNA as 0.2% of another libraries bar codes. In the analysis of the shared bar codes between one pair of IgG libraries, we found 5.8% reads in one were the same as 7.2% of the other. We decided that these two examples were likely due to the sensitivity of the PCR to cross contamination, potentially for aerosolization during batch processing. It is possible that two different individuals might have the same clonotype due to affinity maturation.However, the results indicate that the chances that the some clonotype is matched to the same bar code is very low. Since we cannot resolve whether a common bar code with a common RNA is due to a random match, or cross contamination during our processing, all occurrences of pairings of identical UMI with the same RNA were considered contamination and removed. Thus, the presence of the UMI allows us to identify when there was cross-contamination between libraries, potentially due to aerosolization of droplets and the high sensitivity of the PCR reaction. While the fraction of contamination counts was always less than 0.1%, it gave further reassurance to the results.
Figure 10. Pairwise contamination.
A heat map showing the percentages of sequences of IgG (left) or TCRbeta (right) believed to be contamination between different libraries. A read is considered contaminated between libraries if has the same barcode and full sequences nucleotide normalized edit distance of less than 0.05 (histogram values at zero, see Figure 9). The heat map is the percentage of the reads in a library on the horizontal access that were viewed as contamination from the library on the vertical access. The percentage of total sequence varies since each library has a different number of reads. All reads deemed contamination, by this criteria, where removed from the library and not used in the analysis.
We tested if the presence of the UMI had other impacts on the analysis by comparing the same libraries with and without the use of the UMI. When the same IgG library was processed with and without the UMI we found a large divergence with fewer clonotypes being shared in the absence of UMI. The non-UMI library contained significantly more clonotypes, most of which did not occur in the library with UMI. This supports the view that merging reads on UMI is critical to remove erroneous reads which hurts abundance count accuracy and inflate species size (figure 11).
Figure 11: A paired overlap comparison with and without UMI.
To further view the effect of UMI during the data processing stage of analysis, an IgG library processed with UMI was compared to itself without them. This was done by simply ignoring the UMI and jumping directly to the merge reads step in data processing pipeline. Instead of filtering UMI by number of reads, each read was passed through the default quality check. A large divergence was observed, only 37.6% of the clonotypes were shared (Jaccard index).
Donor Comparison
As a means of validation, the procedure was repeated in a second donor using three samples of ten ml each. Each library was processed for TCRbeta and IgG. Shared RNA libraries were not repeated. The trends of the saturation and overlap curves for IgG and TCR were congruent with those of the first donor and within generally expected levels of variance. Overlap of the top 10,000 IgG clonotypes between different-RNA libraries was 2526 for donor A and 2975 for donor B (Table 1). Donor B also exhibited a peak, although much less pronounced, in overlap of low-mid (8–32) range IgG’s (figure 6). There was a higher average overlap of high abundance IgG clonotypes in donor B across RNA (689 vs 310 of top 1,000 and r2=0.897 vs r2=0.627 - Table 1 - Library Overlaps). This reinforces how variability in donor health, specifically clonal expansion and overall diversity, are contributing factors to the ability to saturate.
Conclusion
Next generation sequencing and UMI have made it possible to quantitatively evaluate immune populations (Egorov et al., 2015; He et al., 2014; Mamedov et al., 2013). However, the ability to saturate a population is dependent on a variety of its characteristics as well as the overall health status of the immune system. This work presents a paradigm for collecting, processing and analyzing clonotypes for IgG and TCRbeta. The results demonstrate the conditions for ensuring that the complete immune repertoire in a particular sample is captured as well as how to evaluate the extent to which blood samples of various sizes capture the complete immune repertoire in the circulation.
All of these measurements were done on presumably healthy donors. Patients of compromised health might have a lower density of lymphocytes, which would decrease the size of the immune repertoire, or an altered immune repertoire, which might increase the size (Hoehn et al., 2016; Hou et al., 2016; Jiang et al., 2013; Wendel et al., 2017). Thus, for those patients it will be necessary to repeat analysis similar to this work to validate the measurement. i.e. ability to cover >90% of the 10,000 most abundant clonotypes. Differences were observed in the distribution of the clonotypes between TCRbeta and IgG. Greater sample was required to cover more of the clonotypes of the IgG. In this particular study we treated each amino acid sequence as a separate clonotype. Thus, the increased number of clonotypes for the IgG, and the requirement of great sample to cover them, likely represents the increased diversity as a consequence of somatic hypermutation. If one were interested in the evolution of the clonotypes, then with an examination at the nucleotide level it should be possible to follow the development of the diversity and classify the discrete clonotypes based on originating B cells (DeWitt et al., 2018). One advantage of using the EDTA tubes is that the blood can be fractionated and the resulting RNA was only from the B and T cells, thus none of the RNA was from the red blood cells (RBC). However, a disadvantage of the EDTA tubes is that they had to be processed immediately. This would be a particular problem if it was necessary to process samples from many different collection sites. Some locations many not have the facilities or time to fractionate the blood. Further, doing the fractionation at different locations could add variability in the quality of the extraction. For these kinds of applications it may be worth switching to collection blood in tubes that can preserve the RNA, such PaxGene Tubes (BD Biosciences), or an equivalent, even though it means that the RNA from all of the cells in the circulation will be mixed.
The results demonstrate that relatively little blood is required to capture the most abundant species. Quantifying what saturation is needed is dependent on how important it is to capture sequences of mid range abundance. For TCR 10ml is sufficient for the top 1000 sequences and for IgG, it may be necessary to have a blood draw of 40 ml to capture the top 1000 different clonotypes. The results demonstrate that with 40 ml it is possible to cover >90% of all circulating T Cell clonotypes and > 60% of all circulating IgG clonotypes (Figure 6: Library Saturation Curves). With 80mls, which is not a large draw for an individual, >95% of the TCRbeta clonotypes are captured and >75% of the IgG clonotypes. With this kind of information, it should be possible to test how the distribution of the clonotypes of an individual varies over time or changes with infection or vaccination.
Supplementary Material
Acknowledgements.
We would like to thank Gabriel Victora and Victor Greiff for comments on the manuscript and the community of patients with fibrolamellar hepatocellular carcinoma for their support and acknowledge NIH Grants 5R56CA207929 (SMS) and P50 CA210964 (SMS). Data in the paper is available at https://www.ncbi.nlm.nih.gov/sra/PRJNA494572.
Acronyms:
- BCR
B-cell receptors
- CDR
Complementarity determining region
- EDTA
ethylene diamine tetraacetic acid
- Ig
Immunoglobulins
- PBMC
peripheral blood mononuclear cells
- TCR
T-cell receptors
- UMI
Unique molecular identifiers
Literature Cited:
- Bashford-Rogers RJ, Palser AL, Idris SF, Carter L, Epstein M, Callard RE, Douek DC, Vassiliou GS, Follows GA, Hubank M, and Kellam P 2014. Capturing needles in haystacks: a comparison of B-cell receptor sequencing methods. BMC Immunol. 15:29. [DOI] [PMC free article] [PubMed] [Google Scholar]
- Breden F, Luning Prak ET, Peters B, Rubelt F, Schramm CA, Busse CE, Vander Heiden JA, Christley S, Bukhari SAC, Thorogood A, Matsen Iv FA, Wine Y, Laserson U, Klatzmann D, Douek DC, Lefranc MP, Collins AM, Bubela T, Kleinstein SH, Watson CT, Cowell LG, Scott JK, and Kepler TB 2017. Reproducibility and Reuse of Adaptive Immune Receptor Repertoire Data. Front Immunol. 8:1418. [DOI] [PMC free article] [PubMed] [Google Scholar]
- Burgos JD, and Moreno-Tovar P 1996. Zipf-scaling behavior in the immune system. Biosystems. 39:227–232. [DOI] [PubMed] [Google Scholar]
- DeWitt WS 3rd, Mesin L, Victora GD, Minin VN, and Matsen F.A.t. 2018. Using genotype abundance to improve phylogenetic inference. Mol Biol Evol. [DOI] [PMC free article] [PubMed] [Google Scholar]
- Egorov ES, Merzlyak EM, Shelenkov AA, Britanova OV, Sharonov GV, Staroverov DB, Bolotin DA, Davydov AN, Barsova E, Lebedev YB, Shugay M, and Chudakov DM 2015. Quantitative profiling of immune repertoires for minor lymphocyte counts using unique molecular identifiers. Journal of immunology. 194:6155–6163. [DOI] [PubMed] [Google Scholar]
- Elhanati Y, Sethna Z, Marcou Q, Callan CG Jr., Mora T, and Walczak AM 2015. Inferring processes underlying B-cell repertoire diversity. Philos Trans R Soc Lond B Biol Sci. 370. [DOI] [PMC free article] [PubMed] [Google Scholar]
- Galson JD, Truck J, Fowler A, Munz M, Cerundolo V, Pollard AJ, Lunter G, and Kelly DF 2015. In-Depth Assessment of Within-Individual and Inter-Individual Variation in the B Cell Receptor Repertoire. Front Immunol. 6:531. [DOI] [PMC free article] [PubMed] [Google Scholar]
- Georgiou G, Ippolito GC, Beausang J, Busse CE, Wardemann H, and Quake SR 2014. The promise and challenge of high-throughput sequencing of the antibody repertoire. Nature biotechnology. 32:158–168. [DOI] [PMC free article] [PubMed] [Google Scholar]
- Greiff V, Bhat P, Cook SC, Menzel U, Kang W, and Reddy ST 2015a. A bioinformatic framework for immune repertoire diversity profiling enables detection of immunological status. Genome Med. 7:49. [DOI] [PMC free article] [PubMed] [Google Scholar]
- Greiff V, Menzel U, Miho E, Weber C, Riedel R, Cook S, Valai A, Lopes T, Radbruch A, Winkler TH, and Reddy ST 2017. Systems Analysis Reveals High Genetic and Antigen-Driven Predetermination of Antibody Repertoires throughout B Cell Development. Cell Rep. 19:1467–1478. [DOI] [PubMed] [Google Scholar]
- Greiff V, Miho E, Menzel U, and Reddy ST 2015b. Bioinformatic and Statistical Analysis of Adaptive Immune Repertoires. Trends Immunol. 36:738–749. [DOI] [PubMed] [Google Scholar]
- He L, Sok D, Azadnia P, Hsueh J, Landais E, Simek M, Koff WC, Poignard P, Burton DR, and Zhu J 2014. Toward a more accurate view of human B-cell repertoire by next-generation sequencing, unbiased repertoire capture and single-molecule barcoding. Scientific reports. 4:6778. [DOI] [PMC free article] [PubMed] [Google Scholar]
- Hoehn KB, Fowler A, Lunter G, and Pybus OG 2016. The Diversity and Molecular Evolution of B-Cell Receptors during Infection. Mol Biol Evol. 33:1147–1157. [DOI] [PMC free article] [PubMed] [Google Scholar]
- Hou D, Ying T, Wang L, Chen C, Lu S, Wang Q, Seeley E, Xu J, Xi X, Li T, Liu J, Tang X, Zhang Z, Zhou J, Bai C, Wang C, Byrne-Steele M, Qu J, Han J, and Song Y 2016. Immune Repertoire Diversity Correlated with Mortality in Avian Influenza A (H7N9) Virus Infected Patients. Scientific reports. 6:33843. [DOI] [PMC free article] [PubMed] [Google Scholar]
- Janeway C 2005. Immunobiology : the immune system in health and disease. Garland Science, New York: xxiii, 823 p. pp. [Google Scholar]
- Jiang N, He J, Weinstein JA, Penland L, Sasaki S, He XS, Dekker CL, Zheng NY, Huang M, Sullivan M, Wilson PC, Greenberg HB, Davis MM, Fisher DS, and Quake SR 2013. Lineage structure of the human antibody repertoire in response to influenza vaccination. Science translational medicine. 5:171ra119. [DOI] [PMC free article] [PubMed] [Google Scholar]
- Khan TA, Friedensohn S, Gorter de Vries AR, Straszewski J, Ruscheweyh HJ, and Reddy ST 2016. Accurate and predictive antibody repertoire profiling by molecular amplification fingerprinting. Sci Adv. 2:e1501371. [DOI] [PMC free article] [PubMed] [Google Scholar]
- Li A, Rue M, Zhou J, Wang H, Goldwasser MA, Neuberg D, Dalton V, Zuckerman D, Lyons C, Silverman LB, Sallan SE, Gribben JG, and A.L.L.C. Dana-Farber Cancer Institute. 2004. Utilization of Ig heavy chain variable, diversity, and joining gene segments in children with B-lineage acute lymphoblastic leukemia: implications for the mechanisms of VDJ recombination and for pathogenesis. Blood. 103:4602–4609. [DOI] [PubMed] [Google Scholar]
- Mamedov IZ, Britanova OV, Zvyagin IV, Turchaninova MA, Bolotin DA, Putintseva EV, Lebedev YB, and Chudakov DM 2013. Preparing unbiased T-cell receptor and antibody cDNA libraries for the deep next generation sequencing profiling. Front Immunol. 4:456. [DOI] [PMC free article] [PubMed] [Google Scholar]
- Miho E, Yermanos A, Weber CR, Berger CT, Reddy ST, and Greiff V 2018. Computational Strategies for Dissecting the High-Dimensional Complexity of Adaptive Immune Repertoires. Front Immunol. 9:224. [DOI] [PMC free article] [PubMed] [Google Scholar]
- Mora T, Walczak AM, Bialek W, and Callan CG Jr. 2010. Maximum entropy models for antibody diversity. Proceedings of the National Academy of Sciences of the United States of America. 107:5405–5410. [DOI] [PMC free article] [PubMed] [Google Scholar]
- Murugan A, Mora T, Walczak AM, and Callan CG Jr. 2012. Statistical inference of the generation probability of T-cell receptors from sequence repertoires. Proceedings of the National Academy of Sciences of the United States of America. 109:16161–16166. [DOI] [PMC free article] [PubMed] [Google Scholar]
- Pasqual N, Gallagher M, Aude-Garcia C, Loiodice M, Thuderoz F, Demongeot J, Ceredig R, Marche PN, and Jouvin-Marche E 2002. Quantitative and qualitative changes in V-J alpha rearrangements during mouse thymocytes differentiation: implication for a limited T cell receptor alpha chain repertoire. The Journal of experimental medicine. 196:1163–1173. [DOI] [PMC free article] [PubMed] [Google Scholar]
- Picelli S, Faridani OR, Bjorklund AK, Winberg G, Sagasser S, and Sandberg R 2014. Full-length RNA-seq from single cells using Smart-seq2. Nat Protoc. 9:171–181. [DOI] [PubMed] [Google Scholar]
- Qi Q, Liu Y, Cheng Y, Glanville J, Zhang D, Lee JY, Olshen RA, Weyand CM, Boyd SD, and Goronzy JJ 2014. Diversity and clonal selection in the human T-cell repertoire. Proceedings of the National Academy of Sciences of the United States of America. 111:13139–13144. [DOI] [PMC free article] [PubMed] [Google Scholar]
- Rempala GA, and Seweryn M 2013. Methods for diversity and overlap analysis in T-cell receptor populations. J Math Biol. 67:1339–1368. [DOI] [PMC free article] [PubMed] [Google Scholar]
- Robins HS, Campregher PV, Srivastava SK, Wacher A, Turtle CJ, Kahsai O, Riddell SR, Warren EH, and Carlson CS 2009. Comprehensive assessment of T-cell receptor beta-chain diversity in alphabeta T cells. Blood. 114:4099–4107. [DOI] [PMC free article] [PubMed] [Google Scholar]
- Robinson WH 2015. Sequencing the functional antibody repertoire--diagnostic and therapeutic discovery. Nat Rev Rheumatol. 11:171–182. [DOI] [PMC free article] [PubMed] [Google Scholar]
- Schroeder HW Jr. 2006. Similarity and divergence in the development and expression of the mouse and human antibody repertoires. Dev Comp Immunol. 30:119–135. [DOI] [PubMed] [Google Scholar]
- Shugay M, Britanova OV, Merzlyak EM, Turchaninova MA, Mamedov IZ, Tuganbaev TR, Bolotin DA, Staroverov DB, Putintseva EV, Plevova K, Linnemann C, Shagin D, Pospisilova S, Lukyanov S, Schumacher TN, and Chudakov DM 2014. Towards error-free profiling of immune repertoires. Nature methods. 11:653–655. [DOI] [PubMed] [Google Scholar]
- Tas JM, Mesin L, Pasqual G, Targ S, Jacobsen JT, Mano YM, Chen CS, Weill JC, Reynaud CA, Browne EP, Meyer-Hermann M, and Victora GD 2016. Visualizing antibody affinity maturation in germinal centers. Science. 351:1048–1054. [DOI] [PMC free article] [PubMed] [Google Scholar]
- Tonegawa S 1983. Somatic generation of antibody diversity. Nature. 302:575–581. [DOI] [PubMed] [Google Scholar]
- Tonegawa S 1988. Nobel lecture in physiology or medicine−−1987. Somatic generation of immune diversity. In Vitro Cell Dev Biol. 24:253–265. [DOI] [PubMed] [Google Scholar]
- Turchaninova MA, Davydov A, Britanova OV, Shugay M, Bikos V, Egorov ES, Kirgizova VI, Merzlyak EM, Staroverov DB, Bolotin DA, Mamedov IZ, Izraelson M, Logacheva MD, Kladova O, Plevova K, Pospisilova S, and Chudakov DM 2016. High-quality full-length immunoglobulin profiling with unique molecular barcoding. Nat Protoc. 11:1599–1616. [DOI] [PubMed] [Google Scholar]
- Vollmers C, Sit RV, Weinstein JA, Dekker CL, and Quake SR 2013. Genetic measurement of memory B-cell recall using antibody repertoire sequencing. Proceedings of the National Academy of Sciences of the United States of America. 110:13463–13468. [DOI] [PMC free article] [PubMed] [Google Scholar]
- Warren RL, Freeman JD, Zeng T, Choe G, Munro S, Moore R, Webb JR, and Holt RA 2011. Exhaustive T-cell repertoire sequencing of human peripheral blood samples reveals signatures of antigen selection and a directly measured repertoire size of at least 1 million clonotypes. Genome Res. 21:790–797. [DOI] [PMC free article] [PubMed] [Google Scholar]
- Wendel BS, He C, Qu M, Wu D, Hernandez SM, Ma KY, Liu EW, Xiao J, Crompton PD, Pierce SK, Ren P, Chen K, and Jiang N 2017. Accurate immune repertoire sequencing reveals malaria infection driven antibody lineage diversification in young children. Nature communications. 8:531. [DOI] [PMC free article] [PubMed] [Google Scholar]
- Zhang J, Kobert K, Flouri T, and Stamatakis A 2014. PEAR: a fast and accurate Illumina Paired-End reAd mergeR. Bioinformatics. 30:614–620. [DOI] [PMC free article] [PubMed] [Google Scholar]
Associated Data
This section collects any data citations, data availability statements, or supplementary materials included in this article.


