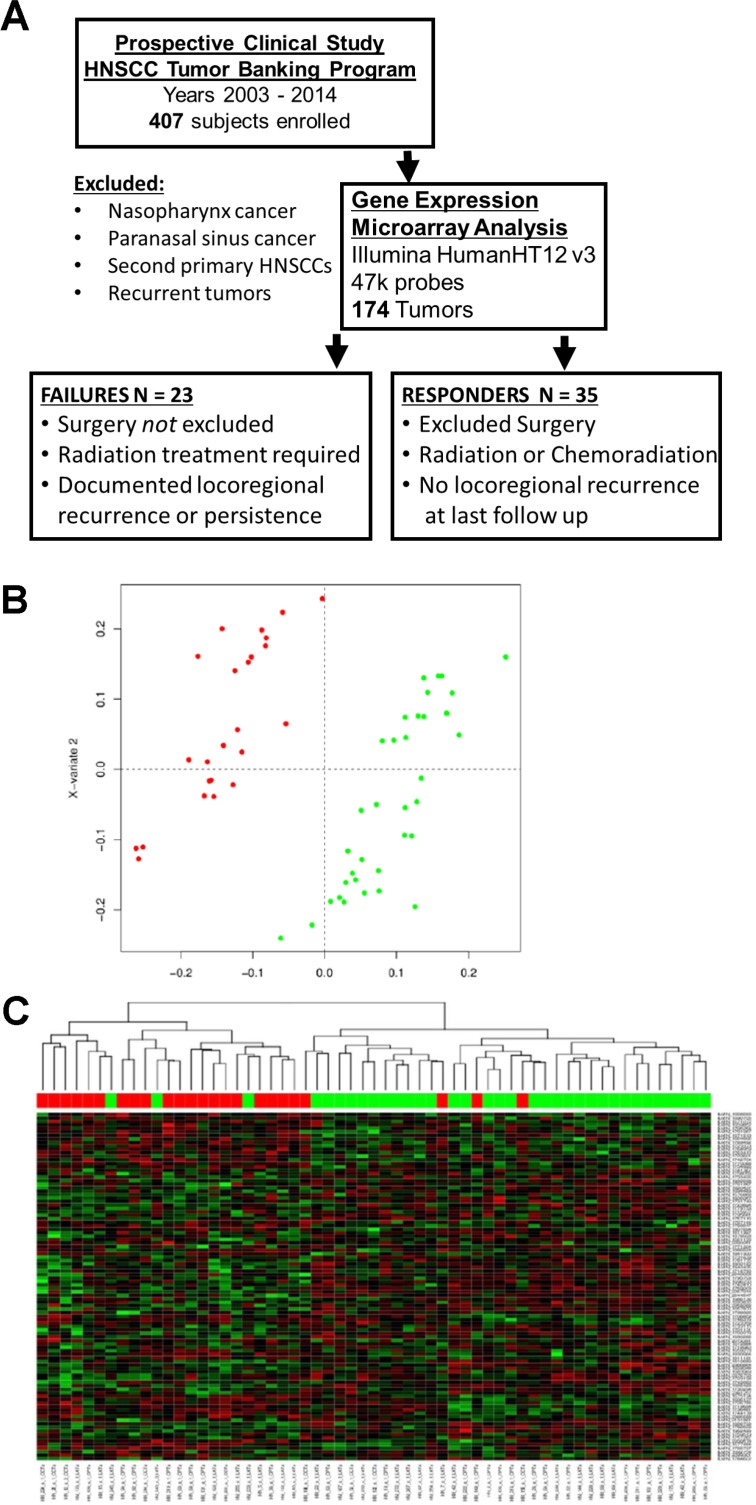
Figure 1. Patient cohort and gene expression data.
(A) Diagram describing the selection process for patients deemed failures and responders used for gene expression analysis. (B) Diagram of results from sparse Partial Least Squares-Discriminant Analysis (sPLS-DA). Red – failure cases, green – responder cases. (C) Heatmap of gene expression profiles from genes selected on the first component of the sPLS-DA model shows HNSCC treatment responders largely cluster separately from failures.

