Abstract
The terrestrial biosphere absorbs about 25% of anthropogenic CO2 emissions, yet the rate of land carbon uptake remains highly uncertain, leading to uncertainties in climate projections1,2. Understanding the factors that are limiting or driving land carbon storage is therefore important for improved climate predictions. One potential limiting factor for land carbon uptake is soil moisture, which can reduce gross primary production due to ecosystem water stress3,4, cause vegetation mortality5, and further exacerbate climate extremes due to land-atmosphere feedbacks6. Previous work has explored the impact of soil moisture availability on past carbon flux variability3,7,8. However, the magnitude of the effect of soil moisture variability and trends on the long-term carbon sink and the mechanisms responsible for associated carbon losses remain uncertain. Here we use four global land-atmosphere models9, and find that soil moisture variability and trends induce large CO2 sources (~2–3 GtC/year) throughout the twenty-first century; on the order of the land carbon sink itself1. Subseasonal and interannual soil moisture variability generates a CO2 source as a result of the nonlinear response of photosynthesis and net ecosystem exchange to soil water availability and the increased temperature and vapour pressure deficit caused by land-atmosphere interactions. Soil moisture variability reduces the present land carbon sink while soil moisture variability and its drying trend reduce it in the future. Our results emphasize that the capacity of continents to act as a future carbon sink critically depends on the nonlinear response of carbon fluxes to soil moisture and on land-atmosphere interactions. This suggests that with the drying trend and increase in soil moisture variability projected in several regions, the current carbon uptake rate may not be sustained past mid-century and could result in an accelerated atmospheric CO2 growth rate.
The vast divergence in terrestrial carbon flux projections from Earth System Models (ESMs) reflects both the difficulty of observing and modeling biogeochemical cycles, as well as the uncertainty in the response of ecosystems to rising atmospheric CO21,2. Rising atmospheric CO2 can generate a fertilization effect that initially increases the rates of photosynthesis and terrestrial CO2 uptake10. However, this fertilization effect may saturate in the future, due to a maximum ecosystem photosynthesis rate being achieved, or because of other limiting factors, such as nutrient limitation11.
Here we demonstrate that the net biome productivity (NBP) response to soil moisture variability is not a zero-sum game. Reductions in NBP driven by strong dry soil moisture anomalies (through increased water stress, fire frequency and intensity, and heat stress) are not compensated by increased NBP under anomalously wet conditions. Additionally, drying soil moisture trends reduce future global NBP and can transition ecosystem types, thus storing less NBP (e.g. a forest to a grassland)12.
Using the data of four models from the Global Land-Atmosphere Coupling Experiment-Coupled Model Intercomparison Project phase 5 (GLACE-CMIP5)9 (Extended Data Table 1), we isolate the changes in global terrestrial NBP (NBP(LAND))due to soil moisture variations from the climatological annual cycle (NBP(SMVAR)) as well as due to longer-term soil moisture trends (NBP(SMTREND)) (see Methods). These experiments allow for the systematic quantification of the effect of moisture across models. For each model, the same sea surface temperatures and radiative forcing agents (based on historical and Representative Concentration Pathway 8.5 (RCP8.5) coupled simulations) are prescribed in all runs. These experiments uniquely allow us to isolate the role of soil moisture dynamics in the climate system. Previous studies have used these experiments to evaluate various aspects of land-atmosphere interactions including enhanced extremes and aridity9,13,14.
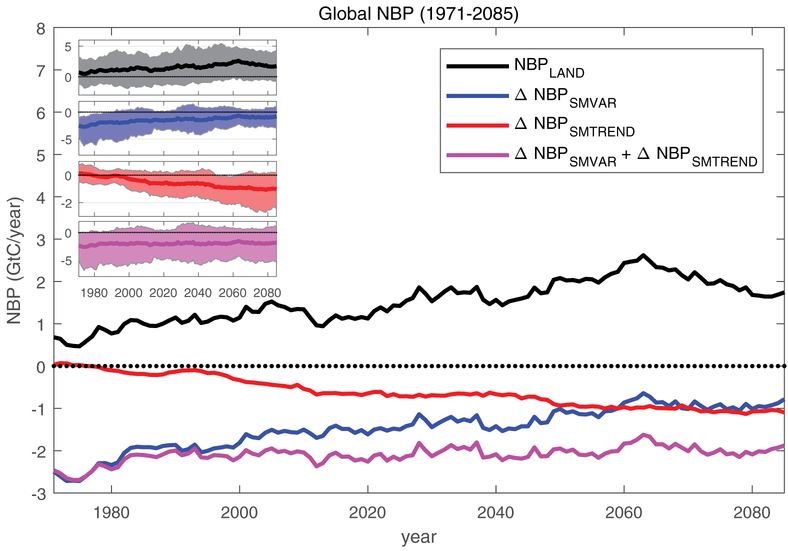
While simulated soil moisture quantitatively differs between models, the models show a robust qualitative agreement on its strong effect on NBP (Fig. 1). Across models, soil moisture variability and trends in mean moisture state strongly reduce the land carbon sink, with their combined effect (NBP(SMVAR) + (NBP(TREND)) being of the same order of magnitude as the land sink (estimated from the CTL runs, (NBP(LAND)) (Fig. 1). It should be noted that in contrast to the Global Carbon Budget1, the land sink term defined by NBP includes emissions from land use and land cover change (LULC).
Figure 1. Global NBP during the 21st century.
The evolution of total global NBP (NBP(LAND)), along with changes in NBP that can be attributed to soil moisture variability (NBP(SMVAR)) and a soil moisture trend (NBP(SMTREND)) through the 21st century. The shaded areas in the figure inset shows the spread of the four model results for each of the NBP components.
Soil moisture variability alone reduces the global terrestrial sink by over twice its absolute magnitude (~2.5GtC/year) at the start of the study period, and by more than half its absolute magnitude (~0.8GtC/year) at the end of the 21st century (NBP(SMVAR)) (Fig. 1). Prior studies have shown that soil moisture variability induced by extreme events (such as droughts and heat waves) can explain a large fraction of the interannual variability in carbon fluxes7,15,16. Here we show that beyond impacts on interannual anomalies, soil moisture variability significantly reduces the mean long-term (multiyear) land CO2 uptake.
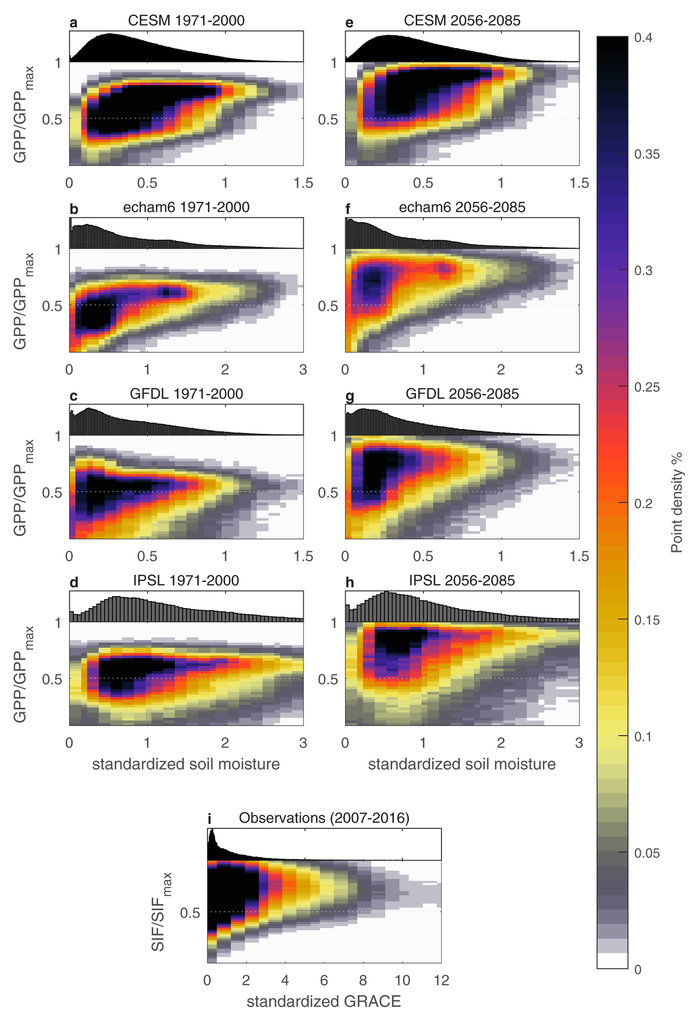
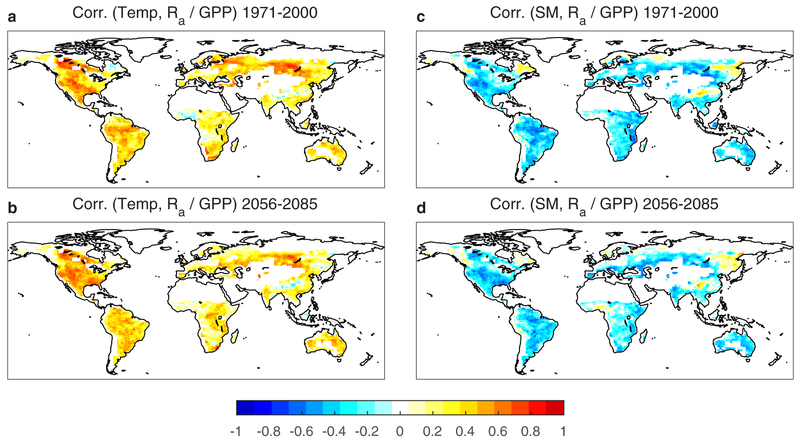
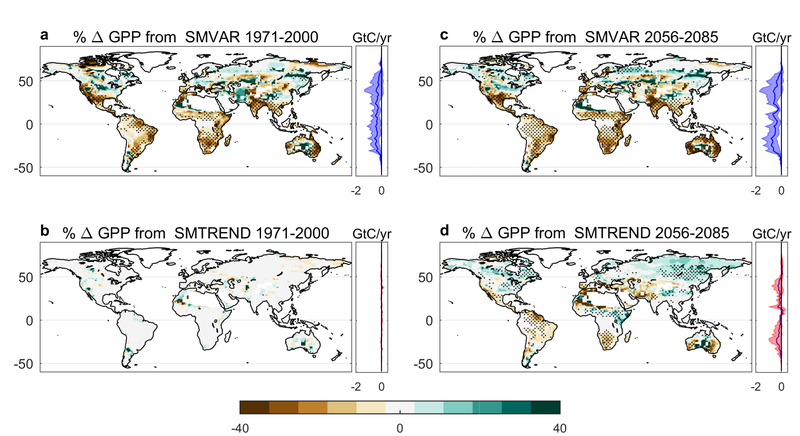
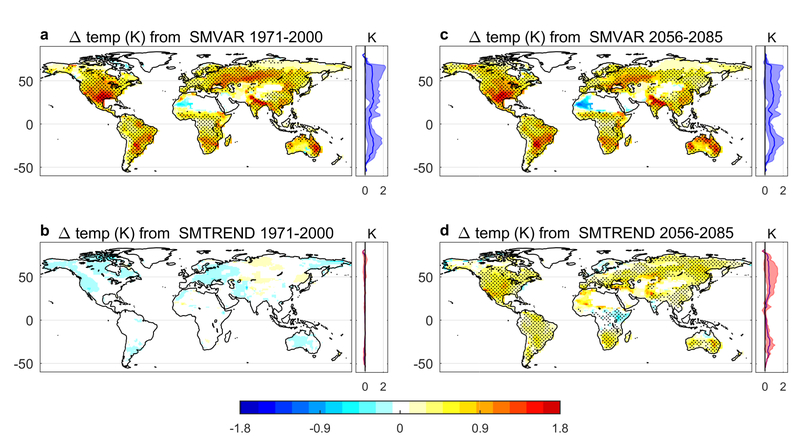
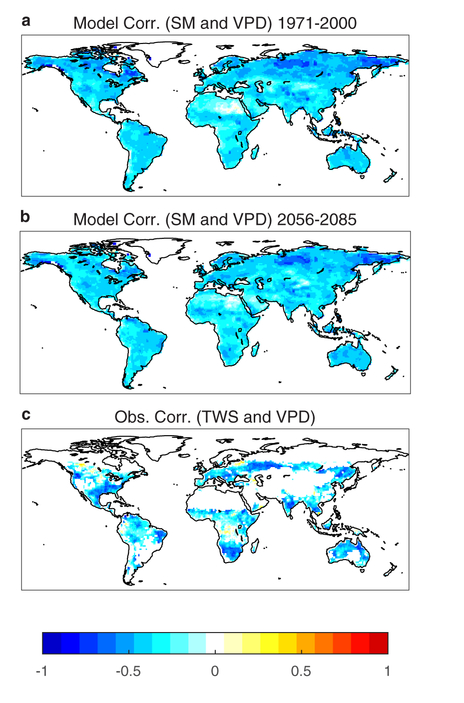
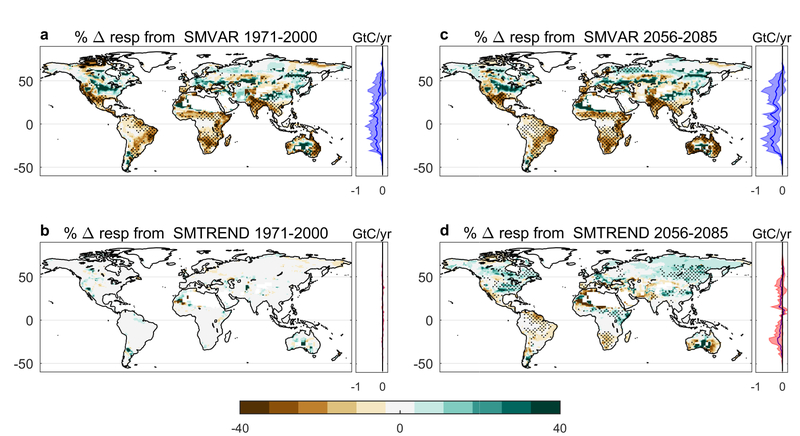
These reductions are due to the nonlinear response of vegetation carbon uptake to water stress: photosynthesis sharply drops off once an ecosystem becomes water limited in models, which is supported by observational data (Fig. 2 and Extended Data Fig. 1). These carbon losses are not recovered during periods with a (similar amplitude) positive moisture anomaly. Indeed, dryness reduces evaporation and therefore surface cooling17, which results in increases in temperature and vapor pressure deficit (VPD) (Extended Data Figs 2 and 3) due to soil moisture-atmosphere feedbacks13,18. These feedbacks further reduce photosynthesis through their effect on vegetation stomatal closure. While respiration also decreases with soil moisture (Extended Data Figs 4 and 5), the land-atmosphere increase in temperature increases the ratio of respiration to GPP (Fig. 4), leading to an overall strong NBP reduction with soil moisture (Fig. 1). In addition, NBP is further reduced by fires during hot and dry spells from the increased prevalence of dead litter from tree mortality and foliage loss as fire fuel12,19.
Fig. 2. Biosphere photosynthetic activity response curves.
Plots of normalized growing season GPP versus standardized soil moisture for a baseline (1971–2000) (a-d) and future period (2056–2085) (e-h) in the GLACE-CMIP5 reference scenario. Normalized and detrended observational solar induced fluorescence (SIF), a proxy for photosynthesis, versus standardized total water storage (TWS) from the Gravity Recovery and Climate Experiment (GRACE) (2007–2016) (i). Probability density functions of the soil moisture and TWS data are plotted at the top of the x-axes. Details on the observational data, as well as of the normalization and standardizations of all datasets can be found in the Methods.
Figure 4. Correlations with the ratio of Autotrophic Respiration to GPP.
The correlations with temperature in a baseline (1971–2000) (a) and future (2056–2085) (b) modeled period. The correlations with soil moisture in a baseline (1971–2000) (c) and future (2056–2085) (d) modeled period. All data are from the GLACE-CMIP5 CTL run.
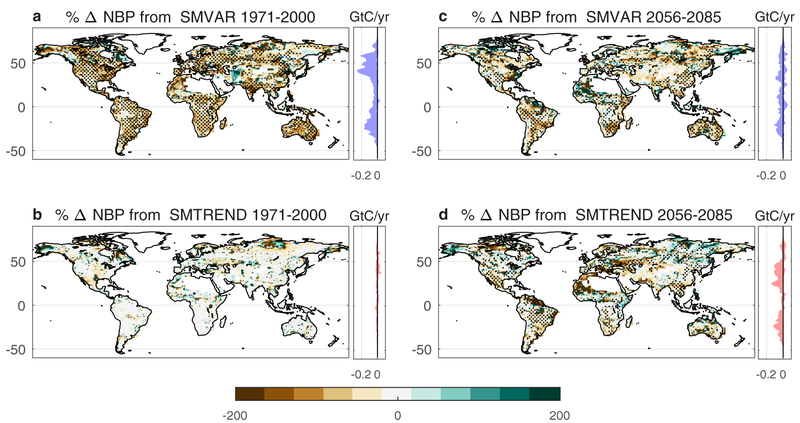
During the baseline period (1971–2000), the reduction in the mean terrestrial carbon sink caused by soil moisture variability is globally widespread (Fig. 3 and Extended Data Fig. 1). There are large NBP reductions in seasonally dry climates (western United States and Central Europe), tropical savannas (Brazil, India and northern Australia), and semi-arid/monsoonal regions (the Sahel, South Africa and Eastern Australia) that are known to be water-limited ecosystems, and which have been shown to be the main drivers of interannual terrestrial CO2 flux variability7,8. In the future (2056–2085) negative impacts on mean NBP remain strong in semi-arid (e.g. the Sahel), humid (e.g. south-eastern United States and Colombia), and monsoonal (e.g. India and northern Australia) climates.
Figure 3. NBP regional changes.
Percentage changes in NBP (NBP(LAND)) due to soil moisture variability (NBP(SMVAR)) and a soil moisture trend (NBP(SMTREND)) during a baseline (1971–2000) (a, b) and a future period (2056–2085) (c, d). Stippling highlights regions where the three models agree on the sign of the change. Latitudinal NBP plots accompany these subplots to show how the percentage changes translates to an overall NBP magnitude across latitudes. The thick line in each represents the model mean while the shaded areas show the model spread.
Soil moisture long-term trends, in most areas displaying a gradual drying (except in some areas of the tropics)9,13 (Extended Data Fig. 6), reduce the global terrestrial sink by over two thirds its absolute magnitude (~1.1GtC/year) at the end of the 21st century (NBP(SMTREND)) (Fig. 1). Regions showing the strongest negative impacts are semi-arid regions bordering deserts (eastern Australia, northern Sahel and northern Mexico), humid subtropical climates (eastern China, and southern Brazil) and Mediterranean Europe (Fig. 3). Under enhanced greenhouse gas forcing within the 21st century, it is expected that these regions will become more strongly water limited6,20, which will result in the simulated drop in GPP (Extended Data Fig. 1).
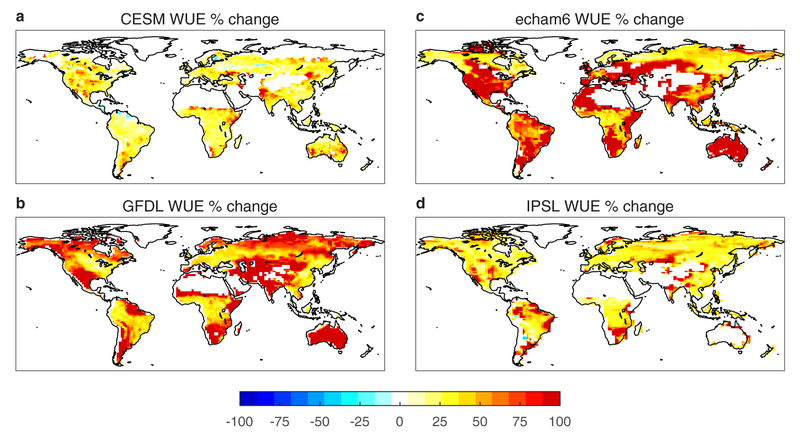
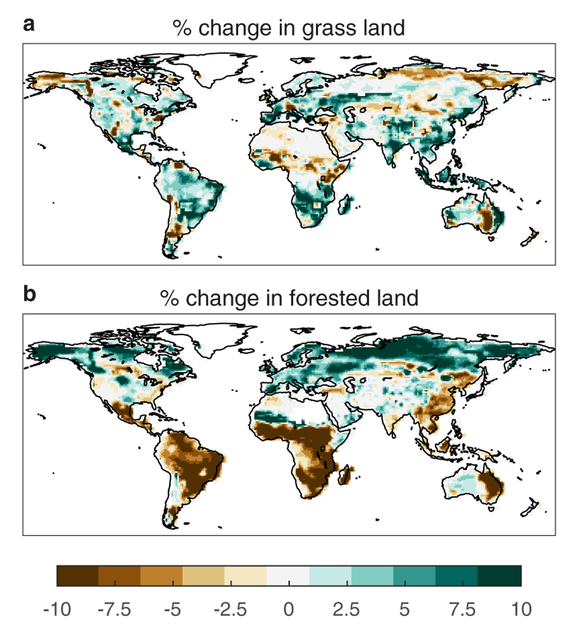
The evolution of (NBP(SMVAR)) and (NBP(TREND)) through the 21st century can be explained by several co-occurring mechanisms. Firstly, increased vegetation water use efficiency due to carbon fertilization effects21 (Extended Data Fig. 7) make ecosystems more resistant to a negative soil moisture anomaly. Secondly, an ecosystem can have decreased NBP response due to the vegetation already being in a severely water stressed environment: in other words, the overall global drying trend in soil moisture shifts several ecosystems into arid conditions, which reduces the influence of soil moisture temporal variability on NBP. Thirdly, insufficient drought recovery time for an ecosystem can shift a forest ecosystem to a grassland (storing less carbon)5 (Extended Data Fig. 8), and thus an NBP loss from a dry year is not necessarily compensated by a wet year (Fig. 2).
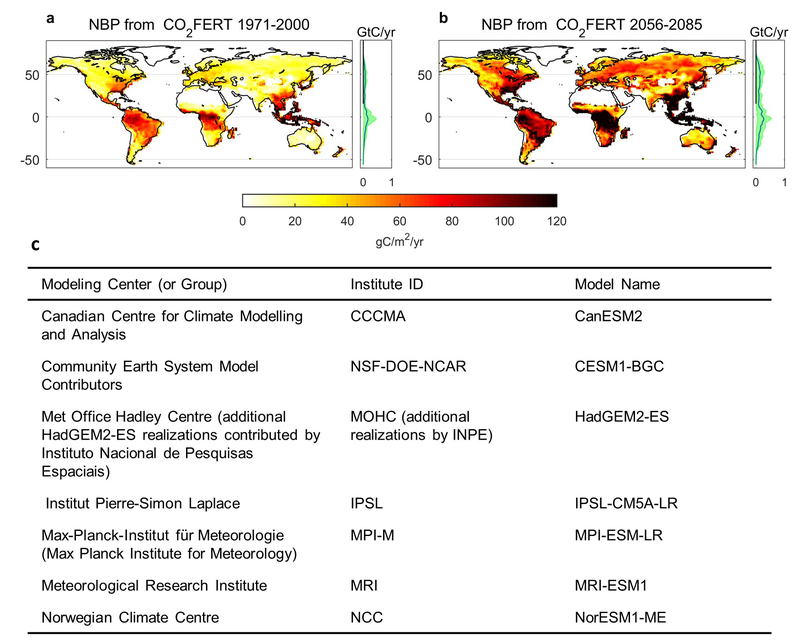
Despite the cumulative negative impact of these soil moisture effects on global NBP (NBP(SMVAR) + (NBP(SMTREND)), (NBP(LAND)) remains a sink throughout the study period, in the mean of the four GLACE-CMIP5 models, mainly due the effects of carbon fertilization10. This is due to the strong simulated response of the tropics to increases in CO2 (Extended Data Fig. 9), the lengthening of the growing seasons in mid- and northern latitudes due to increasing temperatures (Extended Data Fig. 2), as well as to reduced cloud coverage and associated increases in photosynthesis in energy-limited regions22,23. However, despite the continual increase in atmospheric CO2 concentrations in the business-as-usual emission scenario, the modeled global carbon sink reaches a peak shortly following 2060, when the terrestrial biosphere has apparently reached its maximum carbon absorption capacity, similar to a wider range of ESM predictions24.
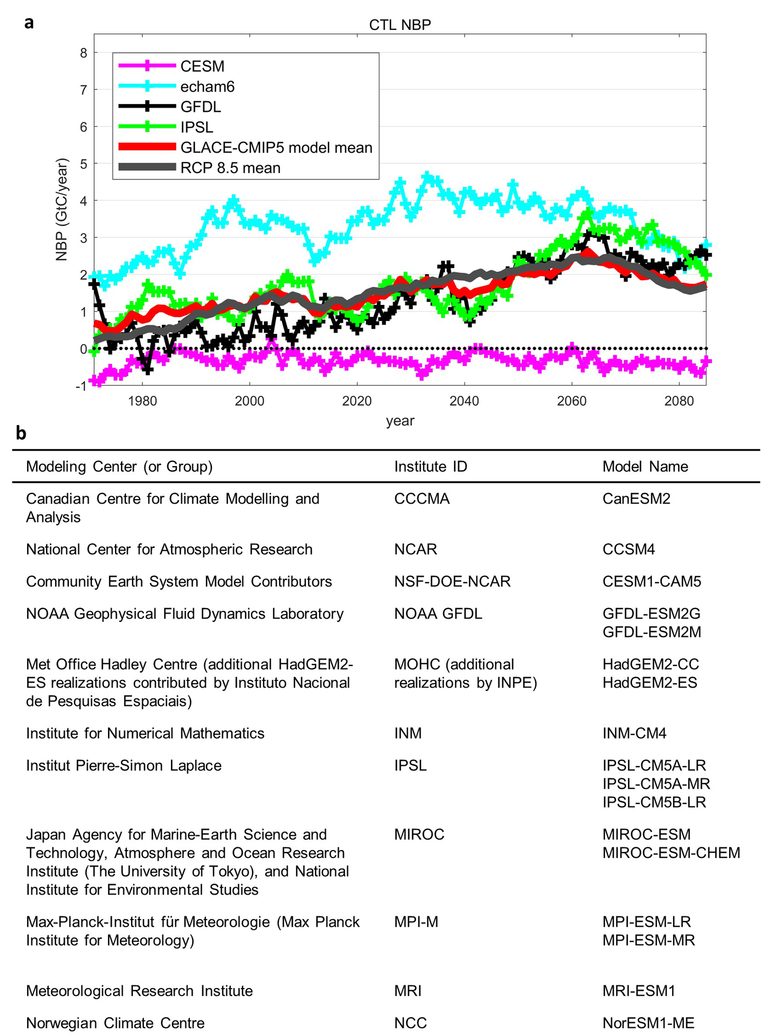
Whether the effect of carbon fertilization on the global carbon sink is exaggerated in models is unclear due the lack of long-term experiments; there has been, however, evidence that the initial increase in photosynthesis rates observed in C3 plants (~97% of plant species) may actually reverse after 15–20 years25. Additionally, many of the factors limiting carbon fertilization have large uncertainty associated with them or are not well represented in models, thus the magnitude of the land carbon sink presented here is likely too high. For example, many free-air CO2 enrichment (FACE) studies have shown limited or no response to elevated [CO2] levels because of nutrient limitations26. Only one of the four GLACE-CMIP5 models (CESM) includes the interaction of the nitrogen and carbon cycles and has CO2 fertilization rates much lower than the other models (Extended Data Fig. 10). A reduced CO2 fertilization effect would mean that our finding regarding the negative effects of soil moisture variability on NBP would be proportionally larger and have a greater potential of turning the land to a carbon source during the 21st century.
Based on our findings it appears critical to correctly assess and simulate the (nonlinear) dependence of GPP and NBP on soil moisture variability in ESMs, as well as the associated land-atmosphere feedbacks. However, most current models only include stomatal limitations on photosynthesis27 and implement empirical formulations of water stress functions related to soil water content and VPD28. They have high degrees of uncertainty associated with their representation of canopy conductance, especially in dry environments29, and do not include several important plant water stress processes related to plant hydraulics, such as xylem embolism30. It has been shown that the vegetation sensitivity to water availability, even within a single plant functional type, can vary between a factor of 3 and 5 during drought, resulting in large variations of plant response and/or mortality to droughts30. Additionally, drought legacy effects, which can last for several years, and drought-related plant mortality are not included in ESMs31. Finally, the strength of land-atmosphere interactions is underestimated in models32, with potential important implications for VPD and temperature. By quantifying the critical importance of soil water variability for the terrestrial carbon cycle, our results highlight the necessity of implementing improved, mechanistic representations of vegetation response to water stress and land-atmosphere coupling in ESMs, to constrain the future terrestrial carbon flux, and better predict future climate.
Methods
GLACE-CMIP5
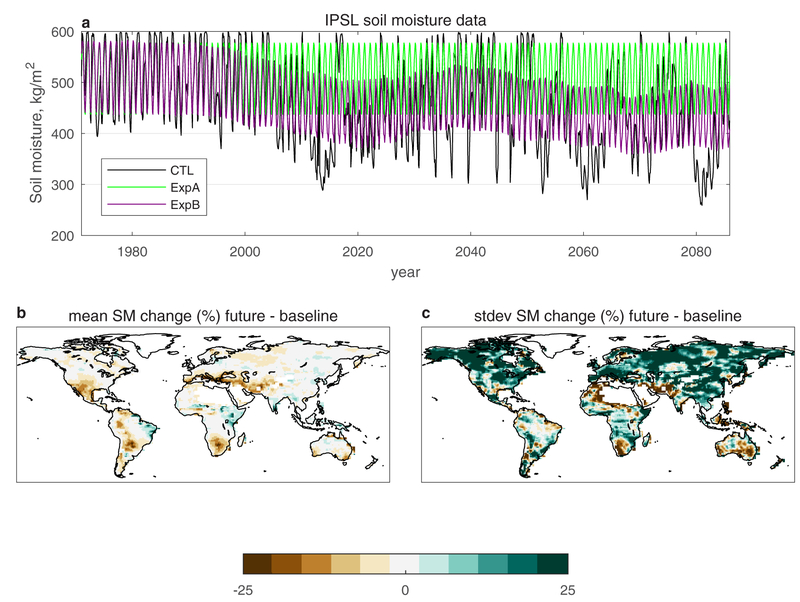
GLACE-CMIP57 is a multi-model series of experiments inspired by the original GLACE experiment33, and designed to investigate land-atmosphere feedbacks along with climate change from 1950–2100. For each model, GLACE-CMIP5 simulations include: (1) a reference run (CTL) based on the CMIP5 historic run until 2005, and the high-emission business as usual Representative Concentration Pathway (RCP) 8.5 scenario thereafter, which accounts for both the indirect impacts of soil moisture and the direct impact of CO2 fertilization, (2) an experiment set-up identically to CTL but where soil moisture is imposed as the mean climatology (i.e. the seasonal cycle) from 1971–2000 throughout the study period (ExpA) in order to remove soil moisture variability (short term and inter-annual); and (3) an experiment set-up identically to CTL but where soil moisture climatology is imposed as a 30-year running mean (ExpB), in order to assess the impact of the trend in soil moisture (Extended Data Fig. 6).
The comparison of the CTL and ExpB allows us to assess the impacts on NBP of soil moisture variability, which during negative anomalies can cause vegetation water stress, resulting in reduced evapotranspiration, warmer temperatures and an increase in the ratio of autotrophic respiration (ra) to GPP. The comparison of ExpB and ExpA isolates the effects of long-term soil moisture changes, which can also induce vegetation water-stress, increases in temperature and the ratio of respiration to GPP if the vegetation cannot adapt quickly enough. NBP time series of a third experiment (set up identically to the CTL but without the effects of carbon fertilization) are examined for trends to ensure that our results are in carbon equilibrium. NBP includes the carbon fluxes due to net primary production, as well as the fluxes due to LULC.
While six modeling groups participated in GLACE-CMIP5, four stored information on NBP for ExpA and ExpB and are used in this analysis (Extended Data Table 1). Multi-model means of NBP are used for the main results to increase robustness. It should be noted that the CESM model is the only of the four that includes a carbon cycle model with a nitrogen limitation which results in the Earth as a carbon source by the end of the 21st century (hence the negative spread in the inset of Fig. 1 inset). However, it has been shown that this version (Community Land Model 4.0) overestimates the nitrogen limitation34. All data analysis and figure generation for this study are performed in MATLAB.
Isolating the effects of soil moisture
To isolate the effects of soil moisture on changes in NBP, an approach from Friedlingstein35 is adapted for use (Equation 1). Here, each term is expressed as their corresponding influence on NBP (ΔNBP(LAND)), where ΔNBP(SMVAR) is the change in NBP due to soil moisture variability, ΔNBP(SMTREND) is due to a change in mean soil moisture state, and ΔNBP(OTHER) is due to CO2 fertilization and changes in temperature. The term ∈ accounts for all other limiting and contributing factors to NBP.
| (1) |
Using monthly data from the multi-model GLACE-CMIP5 simulations9 the CTL, ExpA, and ExpB can be used to isolate the different contributions to ΔNBP due to soil moisture variability ΔNBP(SMVAR) = Δ(NBP(CTL-EXPB)) and a soil moisture trend ΔNBP(SMTREND) = Δ(NBP(EXPB-EXPA)) (Equation 2).
| (2) |
The results from this equation breakdown are used to create Figures 1 and 3. Similarly, Extended Data Figures 1,2 and 4 are generated using the same approach, but instead investigate the effects of soil moisture on temperature, GPP, and ra. Extended Data Figures 1 and 4 use the RCP8.5 GPP and respiration data from IPSL due to data availability. Autotrophic respiration is used in lieu of ecosystem respiration, because of data availability from the GLACE-CMIP5 experiments.
Biosphere photosynthetic activity response curves: models
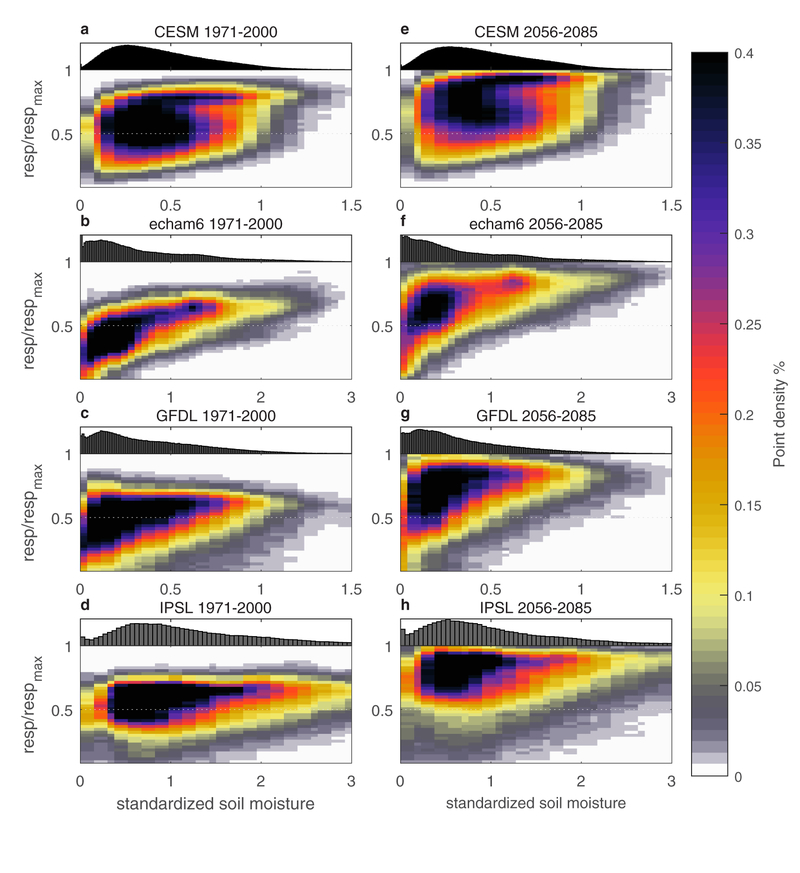
For the curves of GPP and ra versus soil moisture (Fig. 2 and Extended Data Fig. 5), monthly growing season data are used. The growing season is defined for each pixel as the months where the climatological mean is greater than or equal to half of the climatological maximum. For GPP and respiration, each pixel is normalized by its maximum value for better comparability. For soil moisture, due to large differences in magnitude between models36, and within the same model between regions, each pixel is standardized by its minimum value in time, and its standard deviation in space for easier comparison.
| (3) |
In order to ensure that the growing season defined is representative of the entire data record, a second analysis is performed where the growing season for each year is defined as the months greater than or equal to half of a climatological maximum calculated from a thirty-year mean. This does not change the nonlinear relationship between soil moisture and GPP seen in Figure 2.
Biosphere photosynthetic activity response curves: observations
For the observational curve in Figure 2, solar induced fluorescence (SIF) data from the Global Ozone Monitoring Experiment-2 (GOME-2)37 are used to represent photosynthetic activity, while total water storage (TWS) data from the Gravity Recovery and Climate Experiment (GRACE)38 are used to represent soil water availability. Similar to the model analysis, monthly growing season data are used, defined for each pixel as the months where the climatological mean is greater than or equal to half of the climatological maximum.
SIF is a flux byproduct that is mechanistically linked to photosynthesis39, and has been shown to have a near-linear relationship with ecosystem GPP at the monthly and ecosystem scales40–42. Based on this relation, it has been successfully used as a proxy for GPP for numerous applications32,43, and is used in this study as an indicator of biosphere activity. As with the model GPP data, the SIF data are normalized by their maximum value in time. The SIF data are detrended using a convolution to account for signal deterioration over the lifetime of the satellite.
TWS from GRACE is derived from the sum of soil moisture, groundwater, surface water, snow and ice, and has been successfully used as a drought and vegetation activity indicator in previous studies44,45. In this application it is used as a proxy for soil water availability. GRACE data are standardized using the same approach as the soil moisture data for the model analysis (both by its minimum value spatially and standard deviation temporally, Equation 3).
This observational analysis, based on global remote-sensing products, confirms the asymmetric relationship between photosynthetic activity and water availability, as well as the sharp drop at low water contents, qualitatively similar to the functional dependence of photosynthesis on soil moisture represented in the models. As a result, losses in photosynthesis due to dry anomalies are not compensated by a similar magnitude positive anomaly.
CO2 Fertilization experimental setup
To isolate the effects of CO2 fertilization on NBP (Extended Data Fig. 9), data from CMIP5 experiment ESMFixclim1 is used. ESMFixclim1 is an idealized experiment initialized as the pre-industrial control, and where the carbon cycle sees a 1% rise in atmospheric [CO2] per year while radiation sees pre-industrial levels46; seven models are available for this: CanESM2, CESM1-BGC, HadGEM2-ES, IPSL-CM5A-LR, MPI-ESM-LR, MRI-ESM1, NorESM1-ME. Although we use the years with the atmospheric [CO2] equivalent to that of 1950–2100 in RCP8.5, the experimental setup between ESMFixclim1 and RCP8.5 has differences not only related to the CO2 concentration rate of increase, but also to the lack of LULC and aerosols. Due to these differences in setup, these figures are presented to show general NBP trends due to carbon fertilization, but the magnitudes reported should not be compared directly to the soil moisture results.
Extended Data
Extended Data Fig. 1. GPP regional changes.
Percentage changes in GPP due to soil moisture variability and soil moisture trend during a baseline (1971–2000) (a, b) and a future period (2056–2085) (c, d). Stippling highlights regions where the three models agree on the sign of the change. Latitudinal GPP plots accompany these subplots to show how the percentage changes translates to an overall GPP magnitude across latitudes. The thick line in each represents the model mean while the shaded areas show the model spread.
Extended Data Fig. 2. Temperature regional changes.
Temperature changes due to soil moisture variability and soil moisture trend during a baseline (1971–2000) (a, b) and a future modeled period (2056–2085) (c, d). Stippling represents regions where at least three of the four models agree on the sign of the change. Latitudinal temperature plots accompany these subplots to show how the regional changes translate to a temperature change across latitudes. The thick lines in each represents the model mean while the shaded areas show the model spread.
Extended Data Fig. 3. Soil water availability and VPD correlations.
The multi-model GLACE-CMIP5 mean correlations for the CTL run between soil moisture and VPD in the baseline (1971–2000) (a) and future (2056–2085) (b) periods. The correlation between monthly Gravity Recovery and Climate Experiment (GRACE) total water storage (TWS) data (i.e. the sum of soil moisture and groundwater, surface water, snow and ice) and Atmospheric Infrared Sensor (AIRS) VPD data for the period of 2007–2016 (c). Monthly growing season data are used, defined by a SIF (observations) or GPP (models) value greater than half of the maximum climatology per pixel, and seasonal cycles were removed prior to performing the correlations.
Extended Data Fig. 4. Autotrophic respiration regional changes.
Percentage changes in autotrophic respiration due to soil moisture variability and soil moisture trend during a baseline (1971–2000) (a, b) and a future modeled period (2056–2085) (c, d). Stippling represents regions where the three models agree on the sign of the change. Latitudinal respiration plots accompany these subplots to show how the percentage changes translates to an overall respiration magnitude across latitudes. The thick line in each represents the model mean while the shaded areas show the model spread.
Extended Data Fig. 5. Autotrophic respiration response curves.
Plots of normalized growing season autotrophic respiration versus standardized soil moisture for a baseline (1971–2000) (a-d) and future period (2056–2085) (e-h) in the GLACE-CMIP5 reference scenario. Details on the normalization and standardizations can be found in the Methods. Probability density functions of the soil moisture data are plotted at the top of the x-axes.
Extended Data Fig. 6. GLACE-CMIP5 soil moisture.
Monthly soil moisture data from the GLACE-CMIP5 experiment from a pixel in Central Mexico for the IPSL model over the 21st century (a). The CTL is the RCP8.5 soil moisture, while experiment A imposes the mean climatology of soil moisture from 1971–2000, and experiment B imposes soil moisture as the 30-year running mean through the 21st century. The percent change in mean soil moisture between the future and baseline periods in the CTL averaged across the 4 GLACE-CMIP5 models (b), and the percent change in soil moisture variability between the future and baseline periods in the CTL averaged across the 4 GLACE-CMIP5 models (c).
Extended Data Fig. 7. WUE percentage changes.
The percentage change in WUE between the future (2056–2085) and baseline (1971–2000) periods for the CTL run for CESM (a), GFDL (b), echam6 (c) and the IPSL (d) models. WUE is calculated from GPP and evapotranspiration data. GPP data for IPSL are from the RCP8.5 scenario which the CTL run is based.
Extended Data Fig. 8. Percent change in land cover types.
The multi-model mean percentage change between the future (2056–2085) and baseline (1971–2000) periods for grass land (a), and for forested land (b). Data was not available for the CESM model in this analysis.
Extended Data Fig. 9. CO2 fertilization effects on NBP.
Regional and latitudinal changes in NBP during a baseline (1971–2000) (a) and future (2056–2085) (b) period due to the effects of CO2 fertilization. Maps are based on the results from seven CMIP5 models for the ESMFixClim1 scenario that are listed (c).
Extended Data Fig. 10. GLACE-CMIP5 CTL NBP.
NBP predicted through the 21st century for the CTL runs of the GLACE-CMIP5 models listed in Extended Data Table 1 (a). The multi-model mean value of the GLACE-CMIP5 runs, and the multi-model mean of 17 CMIP5 models from RCP8.5 are also displayed. Models used from RCP8.5 are also listed (b).
Extended Data Table 1. GLACE-CMIP5 model information.
Adapted from Seneviratne, S. I. et al. 20139.
| ESM Acronym | Atmospheric Model | Land Surface Model | References |
|---|---|---|---|
| CESM | National Center for Atmospheric Research Community Atmospheric Model (CAM4) | Community Land Model (CLM4) | Neale et al. [2013]47 Lawrence et al. [2011]48 |
| GFDL | Geophysical Fluid Dynamics Laboratory (GFDL) Earth System Model 2 (ESM2) | Land Model 3.0 (LM3.0) | Dunne et al. [2012; 2013]49,50 Milly et al. [2014]51 |
| IPSL* | Laboratoire de Météorologie Dynamique atmospheric model (LMDZ5A) | Organizing Carbon and Hydrology in Dynamic Ecosystems (ORCHIDEE; with two-layer soil hydrology scheme) | Dufresne et al. [2013]52 Hourdin et al. [2013]53 Cheruy et al. [2013]54 |
| MPI-ESM (echam6) | European Centre/Hamburg forecast system | Jena Scheme for Biosphere- Atmosphere Coupling in Hamburg (JSBACH) | Stevens et al. [2013]55 Hagemann et al. [2013]56 Raddatz et al. [2007]57 Brovkin et al. [2009]58 |
In plots of GPP and respiration from the GLACE-CMIP5 CTL run (Figs 2, 4 and Extended Data Figs 1, 4, 5 and 7), results for the IPSL model are based on RCP8.5. Results from IPSL are not included in GPP and respiration results that require the manipulation of ExpA and ExpB from the GLACE-CMIP5 experiments due to data availability. It is unlikely that this should change results significantly.
Acknowledgements
This research was supported by a NASA Earth and Space Science Fellowship. We acknowledge the World Climate Research Programme (WCRP) Working Group on Coupled Modelling, which is responsible for CMIP, and we thank the climate modeling groups (listed in Extended Data Table 1 and Extended Data Figures 9 and 10 of this paper) for producing and making available their model output. For CMIP the U.S. Department of Energy’s Program for Climate Model Diagnosis and Intercomparison provides coordinating support and led development of software infrastructure in partnership with the Global Organization for Earth System Science Portals. The GLACE-CMIP5 project was co-sponsored by WCRP’s Global Energy and Water Exchanges Project (GEWEX) Land-Atmosphere System Study (GLASS) and the International Geosphere-Biosphere Programme (IGBP) Integrated Land-Ecosystem-Atmosphere Processes Study (ILEAPS). SIS acknowledges the European Research Council (ERC) DROUGHT-HEAT project funded by the European Community’s Seventh Framework Programme (grant agreement FP7-IDEAS-ERC-617518).
Footnotes
Competing financial interests
The authors declare no competing financial interests.
Data availability
The GLACE-CMIP5 simulations are available from ETH Zurich (S.I.S., sonia.seneviratne@ethz.ch) and the climate modeling groups upon reasonable request.
- CMIP5 model data: https://pcmdi.llnl.gov/
- GRACE TWS: https://grace.jpl.nasa.gov/data/get-data/
- AIRS temperature and relative humidity: https://airs.jpl.nasa.gov/data/get_data
Main Text References
- 1.Le Quéré C et al. Global Carbon Budget 2017. Earth Syst. Sci. Data 10, 405–448 (2018). [Google Scholar]
- 2.Ballantyne AP et al. Audit of the global carbon budget: Estimate errors and their impact on uptake uncertainty. Biogeosciences 12, 2565–2584 (2015). [Google Scholar]
- 3.Zhao M & Running SW Drought-Induced Reduction in Global Terrestrial Net Primary Production from 2000 Through 2009. Science. 329, 940–943 (2010). [DOI] [PubMed] [Google Scholar]
- 4.Humphrey V et al. Sensitivity of atmospheric CO2 growth rate to observed changes in terrestrial water storage. Nature 560, 628–631 (2018). [DOI] [PubMed] [Google Scholar]
- 5.Schwalm CR et al. Global patterns of drought recovery. Nature 548, 202–205 (2017). [DOI] [PubMed] [Google Scholar]
- 6.Seneviratne SI et al. Investigating soil moisture-climate interactions in a changing climate: A review. Earth-Science Rev. 99, 125–161 (2010). [Google Scholar]
- 7.Poulter B et al. Contribution of semi-arid ecosystems to interannual variability of the global carbon cycle. Nature 509, 600–603 (2014). [DOI] [PubMed] [Google Scholar]
- 8.Ahlström A et al. The dominant role of semi-arid ecosystems in the trend and variability of the land CO2 sink. Science. 348, 895–899 (2015). [DOI] [PubMed] [Google Scholar]
- 9.Seneviratne SI et al. Impact of soil moisture-climate feedbacks on CMIP5 projections: First results from the GLACE-CMIP5 experiment. Geophys. Res. Lett 40, 5212–5217 (2013). [Google Scholar]
- 10.Schimel D, Stephens BB & Fisher JB Effect of increasing CO 2 on the terrestrial carbon cycle. Proc. Natl. Acad. Sci 112, 436–441 (2015). [DOI] [PMC free article] [PubMed] [Google Scholar]
- 11.Wieder WR, Cleveland CC, Smith WK & Todd-Brown K Future productivity and carbon storage limited by terrestrial nutrient availability. Nat. Geosci 8, 441–444 (2015). [Google Scholar]
- 12.McDowell NG & Allen CD Darcy’s law predicts widespread forest mortality under climate warming. Nat. Clim. Chang 5, 669–672 (2015). [Google Scholar]
- 13.Berg A et al. Land–atmosphere feedbacks amplify aridity increase over land under global warming. Nat. Clim. Chang 6, 1–7 (2016). [Google Scholar]
- 14.Lorenz R et al. Influence of land-atmosphere feedbacks on temperature and precipitation extremes in the GLACE-CMIP5 ensemble. J. Geophys. Res. Atmos 121, 607–623 (2016). [Google Scholar]
- 15.Schwalm CR et al. Reduction in carbon uptake during turn of the century drought in western North America. Nat. Geosci 5, 551–556 (2012). [Google Scholar]
- 16.Reichstein M et al. Climate extremes and the carbon cycle. Nature 500, 287–295 (2013). [DOI] [PubMed] [Google Scholar]
- 17.Bateni SM & Entekhabi D Relative efficiency of land surface energy balance components. Water Resour. Res 48, 1–8 (2012). [Google Scholar]
- 18.Seneviratne SI, Lüthi D, Litschi M & Schär C Land-atmosphere coupling and climate change in Europe. Nature 443, 205–209 (2006). [DOI] [PubMed] [Google Scholar]
- 19.Brando PM et al. Abrupt increases in Amazonian tree mortality due to drought-fire interactions. Proc. Natl. Acad. Sci 111, 6347–6352 (2014). [DOI] [PMC free article] [PubMed] [Google Scholar]
- 20.Orlowsky B & Seneviratne SI Elusive drought: Uncertainty in observed trends and short-and long-term CMIP5 projections. Hydrol. Earth Syst. Sci 17, 1765–1781 (2013). [Google Scholar]
- 21.Greve P, Roderick ML & Seneviratne SI Simulated changes in aridity from the last glacial maximum to 4xCO2. Environ. Res. Lett 12, (2017). [Google Scholar]
- 22.Peñuelas J & Filella I Responses to a Warming World. Science. 294, 793–795 (2001). [DOI] [PubMed] [Google Scholar]
- 23.Nemani RR et al. Climate-driven increases in global terrestrial net primary production from 1982 to 1999. Science 300, 1560–1563 (2003). [DOI] [PubMed] [Google Scholar]
- 24.Friedlingstein P et al. Uncertainties in CMIP5 climate projections due to carbon cycle feedbacks. J. Clim 27, 511–526 (2014). [Google Scholar]
- 25.Hovenden M & Newton P Plant responses to CO2 are a question of time. Science. 360, 263–264 (2018). [DOI] [PubMed] [Google Scholar]
- 26.Reich PB, Hobbie SE & Lee TD Plant growth enhancement by elevated CO2 eliminated by joint water and nitrogen limitation. Nat. Geosci 7, 920–924 (2014). [Google Scholar]
- 27.Egea G, Verhoef A & Vidale PL Towards an improved and more flexible representation of water stress in coupled photosynthesis-stomatal conductance models. Agric. For. Meteorol 151, 1370–1384 (2011). [Google Scholar]
- 28.Verhoef A & Egea G Modeling plant transpiration under limited soil water: Comparison of different plant and soil hydraulic parameterizations and preliminary implications for their use in land surface models. Agric. For. Meteorol 191, 22–32 (2014). [Google Scholar]
- 29.Franks PJ, Berry JA, Lombardozzi DL & Bonan GB Stomatal Function across Temporal and Spatial Scales: Deep-Time Trends, Land-Atmosphere Coupling and Global Models. Plant Physiol. 174, 583–602 (2017). [DOI] [PMC free article] [PubMed] [Google Scholar]
- 30.Konings AG, Williams AP & Gentine P Sensitivity of grassland productivity to aridity controlled by stomatal and xylem regulation. Nat. Geosci 10, 284–288 (2017). [Google Scholar]
- 31.Anderegg WRL et al. Pervasive drought legacies in forest ecosystems and their implications for carbon cycle models. Science. 349, 528–532 (2015). [DOI] [PubMed] [Google Scholar]
- 32.Green JK et al. Regionally strong feedbacks between the atmosphere and terrestrial biosphere. Nat. Geosci 10, 410–414 (2017). [DOI] [PMC free article] [PubMed] [Google Scholar]
Methods References
- 33.Koster RD et al. Regions of strong coupling between soil moisture and precipitation. Science 305, 1138–1140 (2004). [DOI] [PubMed] [Google Scholar]
- 34.Oleson KW et al. Technical description of version 4.0 of the Community Land Model (CLM). NCAR/TN-503+STR NCAR Technical Note (2013). doi: 10.5065/D6RR1W7M [DOI] [Google Scholar]
- 35.Friedlingstein P et al. Climate–Carbon Cycle Feedback Analysis: Results from the C 4 MIP Model Intercomparison. J. Clim 19, 3337–3353 (2006). [Google Scholar]
- 36.Koster RD et al. On the nature of soil moisture in land surface models. J. Clim 22, 4322–4335 (2009). [Google Scholar]
- 37.Köhler P, Guanter L & Joiner J A linear method for the retrieval of sun-induced chlorophyll fluorescence from GOME-2 and SCIAMACHY data. Atmos. Meas. Tech 8, 2589–2608 (2015). [Google Scholar]
- 38.Watkins MM, Wiese DN, Yuan D, Boening C & Landerer FW Improved methods for observing Earth’s time variable mass distribution with GRACE using spherical cap mascons. J. Geophys. Res. Solid Earth 120, 2648–2671 (2015). [Google Scholar]
- 39.Porcar-Castell A et al. Linking chlorophyll a fluorescence to photosynthesis for remote sensing applications: Mechanisms and challenges. J. Exp. Bot 65, 4065–4095 (2014). [DOI] [PubMed] [Google Scholar]
- 40.Guanter L et al. Retrieval and global assessment of terrestrial chlorophyll fluorescence from GOSAT space measurements. Remote Sens. Environ 121, 236–251 (2012). [Google Scholar]
- 41.Frankenberg C et al. New global observations of the terrestrial carbon cycle from GOSAT: Patterns of plant fluorescence with gross primary productivity. Geophys. Res. Lett 38, L17706 (2011). [Google Scholar]
- 42.Joiner J et al. Global monitoring of terrestrial chlorophyll fluorescence from moderate spectral resolution near-infrared satellite measurements: methodology, simulations, and application to GOME-2. Atmos. Meas. Tech. Discuss 6, 3883–3930 (2013). [Google Scholar]
- 43.Sun Y et al. OCO-2 advances photosynthesis observation from space via solar-induced chlorophyll fluorescence. Science. 358, (2017). [DOI] [PubMed] [Google Scholar]
- 44.Jiang W et al. Annual variations of monsoon and drought detected by GPS: A case study in Yunnan, China. Sci. Rep 7, 1–10 (2017). [DOI] [PMC free article] [PubMed] [Google Scholar]
- 45.Yang Y et al. GRACE satellite observed hydrological controls on interannual and seasonal variability in surface greenness over mainland Australia. J. Geophys. Res. Biogeosciences 119, 2245–2260 (2014). [Google Scholar]
- 46.Taylor KE, Stouffer RJ & Meehl GA An overview of CMIP5 and the experiment design. Bull. Am. Meteorol. Soc 93, 485–498 (2012). [Google Scholar]
Extended Data References
- 47.Neale RB et al. The mean climate of the Community Atmosphere Model (CAM4) in forced SST and fully coupled experiments. J. Climate 26, 5150–5168 (2013). [Google Scholar]
- 48.Lawrence DM et al. Parameterization improvements and functional and structural advances in version 4 of the Community Land Model. J. Adv. Model. Earth Syst 3, 1–27 (2011). [Google Scholar]
- 49.Dunne JP et al. GFDL’s ESM2 Global Coupled Climate–Carbon Earth System Models. Part I: Physical Formulation and Baseline Simulation Characteristics. J. Climate, 25, 6646–6665 (2012). [Google Scholar]
- 50.Dunne JP et al. GFDL’s ESM2 Global Coupled Climate–Carbon Earth System Models. Part II: Carbon System Formulation and Baseline Simulation Characteristics. J. Climate 26, 2247–2267 (2013). [Google Scholar]
- 51.Milly PC et al. An Enhanced Model of Land Water and Energy for Global Hydrologic and Earth-System Studies. J. Hydrometeor 15, 1739–1761 (2014). [Google Scholar]
- 52.Dufresne J-L et al. Climate change projections using the IPSL-CM5 Earth System Model: from CMIP3 to CMIP5. Clim. Dyn 40, 2123–2165 (2013). [Google Scholar]
- 53.Hourdin F et al. Impact of the LMDZ atmospheric grid configuration on the climate and sensitivity of the IPSL-CM5A coupled model. Clim. Dyn 40, 2167–2192 (2013). [Google Scholar]
- 54.Chéruy F et al. Combined influence of atmospheric physics and soil hydrology on the simulated meteorology at the SIRTA atmospheric observatory. Clim. Dyn 40, 2251–2269 (2013). [Google Scholar]
- 55.Stevens B et al. Atmospheric component of the MPI-M Earth System Model: ECHAM6. J. Adv. Model. Earth Syst 5, 146–172 (2013). [Google Scholar]
- 56.Hagemann S, Loew A & Andersson A Combined evaluation of MPI-ESM land surface water and energy fluxes. J. Adv. Model. Earth Syst. 5, 259–286 (2013). [Google Scholar]
- 57.Raddatz TJ et al. Will the tropical land biosphere dominate the climate–carbon cycle feedback during the twenty- first century? Clim. Dyn 29, 565–574 (2007). [Google Scholar]
- 58.Brovkin V, Raddatz T, Reick CH, Claussen M & Gayler V Global biogeophysical interactions between forest and climate. Geophys. Res. Lett 36, L07405 (2009). [Google Scholar]


