Abstract
Key points
Prior studies have shown variation in the functional properties of cardiomyocytes isolated from different regions of the left ventricular myocardium.
We found that these region‐dependent variations vanish below a tissue volume of ∼7 mm3 in the adult rat myocardium, revealing a fixed level of intrinsic relaxation rate heterogeneity that is independent of tissue volume.
Within these microscopically varying cell populations, fast‐relaxing cells were shown to have elevated phosphorylated troponin I compared to slow‐relaxing cells.
Relaxation rate was also correlated with cardiomyocyte length, in that slow‐relaxing cells were longer than fast‐relaxing cells.
These results show a new relationship between cardiomyocyte morphology and myofilament relaxation, and suggest that functional diversity among individual myocytes at the microscale may contribute to bulk relaxation of the myocardium.
Abstract
The mean contractility and calcium handling properties of cardiomyocytes isolated from different regions of the ventricular myocardium are known to vary significantly. We designed experiments to quantify the variance in contractile properties among cells within the same myocardial region. Longitudinal strips of myocardial tissue were excised from the epicardial left ventricular free walls of adult Sprague–Dawley rats and then treated with collagenase to isolate individual myocytes. Cardiomyocytes were characterized by measuring sarcomere length changes and calcium transients during electrical pacing. Variance of the time from peak sarcomere shortening to 50% re‐lengthening (RT50) was assessed in each cell population. Isolating cells from progressively shorter strips allowed an estimate of the myocardial volume below which regional variation vanished and only microscale heterogeneity remained (∼7 mm3). The SD of RT50 within this myocardial volume was 28% of the mean. In a series of follow‐up experiments, RT50 was shown to correlate significantly with resting myocyte length, suggesting a connection between cell morphology and intrinsic relaxation behaviour. To explore the mechanistic basis of varying RT50, a novel single‐cell aspirator was employed to collect small batches of cardiomyocytes grouped according to their relaxation rates (fast or slow). Western blot analysis of the two groups revealed significantly elevated troponin I phosphorylation in fast‐relaxing cells. Our observations suggest that cell‐to‐cell heterogeneity of active contractile properties is substantial, with implications for how we understand myocardial relaxation and design drug therapies intended to alter relaxation rate.
Keywords: myocardial relaxation, myocardial heterogeneity, cardiomyocytes
Key points
Prior studies have shown variation in the functional properties of cardiomyocytes isolated from different regions of the left ventricular myocardium.
We found that these region‐dependent variations vanish below a tissue volume of ∼7 mm3 in the adult rat myocardium, revealing a fixed level of intrinsic relaxation rate heterogeneity that is independent of tissue volume.
Within these microscopically varying cell populations, fast‐relaxing cells were shown to have elevated phosphorylated troponin I compared to slow‐relaxing cells.
Relaxation rate was also correlated with cardiomyocyte length, in that slow‐relaxing cells were longer than fast‐relaxing cells.
These results show a new relationship between cardiomyocyte morphology and myofilament relaxation, and suggest that functional diversity among individual myocytes at the microscale may contribute to bulk relaxation of the myocardium.
Introduction
The heart must generate co‐ordinated contractions to efficiently pump blood, yet the ventricular myocardium itself is highly inhomogeneous (Bogaert et al. 2001). Regional myocardial heterogeneity is evident from significant differences in the mean electrophysiological, calcium handling and contractile properties of cardiomyocytes isolated from different locations within the ventricle. These include transmural (epicardium–endocardium) and longitudinal (apex–base) differences amongst others (Wan et al. 2003; Cordeiro et al. 2004). The amount of functional heterogeneity that naturally exists among cardiomyocytes within the same small volume of myocardium is less clear, and was the object of the present study.
It could be reasonably assumed that the contractile properties of neighbouring cells would be similar. Yet, when measured individually, cardiomyocytes isolated from the same myocardial region can exhibit markedly different mechanical behaviours, notably in their rates of relaxation (Campbell et al. 2013). Varying gene expression could explain these cell‐to‐cell differences, although the extent of contractile variation within macroscopic regions of the myocardium has not been reported, and its contribution to the bulk mechanics of these regions is not known.
Gene expression in cardiomyocytes is a stochastic process influenced by the specific chemical and mechanical environment of each cell, such that neighbouring cells may not express genes in precisely the same way (Elowitz et al. 2002). Logically, this could serve as a source of intrinsic cardiomyocyte behavioural heterogeneity. For example, increased variability in cell‐to‐cell gene expression in ageing mouse hearts (Bahar et al. 2006) is reminiscent of increasing variability of relaxation rate in cardiomyocytes isolated from ageing rats (Campbell et al. 2013). Nevertheless, a detailed characterization of microscale cardiomyocyte heterogeneity and its potential causes has yet to be reported.
In the present study, we quantified the native variation of relaxation rate among cardiomyocytes isolated from the same myocardial region. Far from being an experimental artefact, cell‐to‐cell differences in relaxation were shown to relate to the level of troponin I phosphorylation in each cardiomyocyte. The evidence further suggests that phosphorylation and relaxation rate are linked to cell morphology. Taken together, our results support the view that the myocardium is far more heterogeneous than commonly assumed.
Methods
Ethical approval
All animal procedures were approved by the Yale University Institutional Animal Care and Use Committee (Approval # 2015‐11528), compliant with the regulations of the Animal Welfare Act, Public Health Service, and the United States Department of Agriculture. Studies were performed using eight female Sprague–Dawley rats, comprising retired breeders 4–6 months of age purchased from Charles River Laboratories (Wilmington, MA, USA). Animals were housed under a standard 12:12 h light/dark cycle and fed ad libitum in accordance with an approved Yale University protocol. Animals were exposed to 15 min of 500 mL min–1 isoflurane inhalation, then were subjected to a terminal bilateral thoracotomy for removal of the heart. All experiments were conducted in accordance with the relevant guidelines and established standards.
Cardiomyocyte isolation
Left ventricular cardiomyocytes were isolated via Langendorff perfusion of the heart with collagenase‐containing solution. Adult female rats were anaesthetized with isoflurane, injected with 0.5 mL of 1000 U mL–1 heparin, and subjected to bilateral thoracotomy for removal of the heart. Excised hearts were cannulated via the aorta and mounted onto a Langendorff perfusion apparatus. Hearts were immediately perfused for 10 min with 37°C calcium‐free perfusion buffer containing (in mm): 118 NaCl, 4.8 KCl, 1.25 KH2PO4, 1.25 MgSO4, 10 2,3‐butanedione monoxime, 25 Hepes and 11 glucose (pH 7.3). Subsequently, the solution was switched to a digestion buffer, consisting of perfusion buffer supplemented with (in mm): 2.5 carnitine, 5 taurine, 2.5 glutamic acid, 0.025 CaCl2, 120 U mL–1 collagenase type II (Worthington Biochemical Corp., Lakewood, NJ, USA) and 0.96 U mL–1 protease (Sigma, St Louis, MO, USA) (pH 7.3) for 20 min. The heart was then cut down and the left ventricular free wall was removed (Fig. 2 A). The sub‐epicardial portion of this left ventricular excision was cut free and the resulting strip segmented into seven equal regions of ∼1 × 1 × 1 mm (length × width × thickness) in size per region. A strip directly adjacent to these regions was divided up in the same manner simultaneously to be imaged by optical coherence tomography and obtain an estimate of tissue volume. Each ∼1 mm3 region then went on to be digested further by being placed into a microcentrifuge tube containing fresh digestion buffer. The tissue was digested through mechanical agitation on a shaking incubator set at 115 r.p.m. for 10 min and 37°C and then gently triturated to liberate individual cells. Undigested tissue chunks were then transferred to fresh digestion buffer in a separate microcentrifuge tube, and the process was repeated as many as four additional times, or until all tissue had been digested. Cells were removed from digestion buffer by centrifugation and resuspended in repeated wash buffers containing fetal bovine serum with gradually increasing calcium concentrations (0.05–1.1 mm). Functional experiments were performed after allowing cells to rest for at least 1 h.
Figure 2. Cardiomyocyte isolation process to create composite regions and examine their RT50 variability.
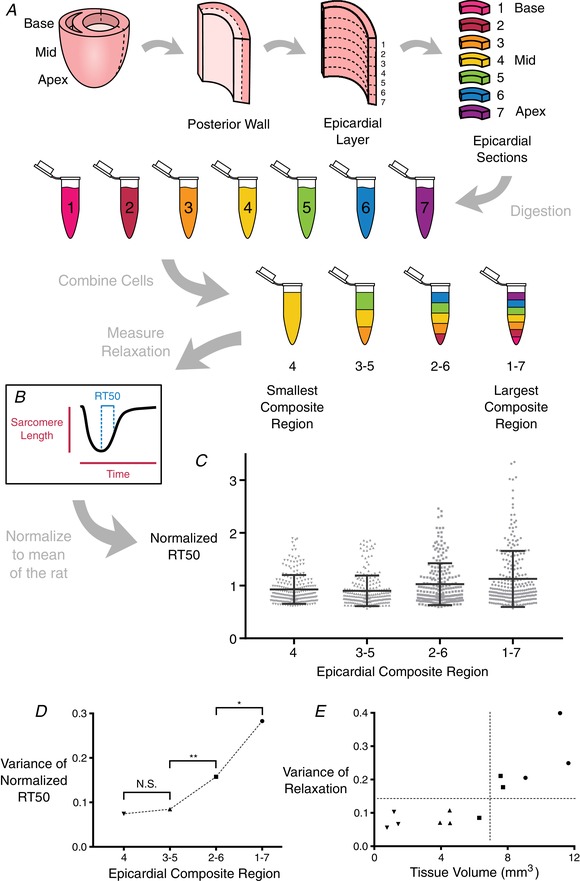
A, whole hearts were removed from adult female rats and cannulated for Langendorff perfusion. The left ventricular free wall was excised, then further dissected to leave only the epicardial layer. The epicardial layer was then segmented from apex to base into seven equally‐sized sections, and each section was subjected to additional enzymatic digestion to release individual cardiomyocytes. The cells from these sections were then combined in equal proportions to form composite regions of cells, where the largest composite region (composite region 1–7, or CR1–7) consisted of cardiomyocytes from each of the seven sections, and the smallest composite region (CR4) consisted of only cardiomyocytes from the innermost section. B, sarcomere length shortening and calcium transient records were taken from ∼80 cells from each composite region from each of three rats. C, RT50 values were normalized across animals and plotted together to compare the distribution of values within each composite region. Bars indicate the SD in each group. D, variance of normalized RT50 values from each CR was compared with those of CRs immediately larger or smaller (Levene's test for equality of variance); * P ≤ 0.05, ** P ≤ 0.001. The RT50 variances of CR3–5 and CR4 were not different. E, variance of RT50 for each CR can be plotted as a function of the volume of cardiac tissue from which the CR was obtained, highlighting the myocardial volume below which variation ceases to diminish. [Color figure can be viewed at wileyonlinelibrary.com]
Formation of cells into composite regions
To mimic a reduction in epicardial tissue volume at the same time as maintaining a consistent cell population from the same isolated strip, cells from the seven equally divided regions were mixed together to create four different composite regions (CR). The largest CR, denoted CR1–7, consisted of cardiomyocytes from each of the seven regions in equal amounts. The next composite (CR2–6) consisted of the inner five regions’ cells mixed together in equal proportions. The second smallest composite (CR3–5) was made up of only the inner three regions, and the smallest composite (CR4) consisted of only the innermost region. In this way, using the same overall population of cells we were able to mimic four different tissue sizes to then observe how the time from peak shortening to 50% re‐lengthening (RT50) within these composites changed as the tissue volume decreased. Once it was determined that the variance no longer decreased below CR3–5 (∼7 mm3 in volume), the remaining experiments were conducted only on CR3–5 cardiomyocytes.
Functional testing of cardiomyocytes
Cardiomyocytes were imaged in Tyrode's solution (containing in mm: 140 NaCl, 5.4 KCl, 1.8 CaCl2, 1 MgCl2, 25 Hepes and 10 glucose; pH 7.3). Prior to study, cells incubated in darkness for 10 min with Tyrode's solution supplemented with 2.2 μm Fura‐2AM and with Pluronic F‐127 (0.022%) for calcium fluorescence imaging. After loading, cells were resuspended in fresh Tyrode's solution and allowed to settle until imaging. Cardiomyocyte calcium transients and unloaded shortening contractions were measured using an inverted microscope (Eclipse Ti‐U; Nikon, Tokyo, Japan) equipped with a temperature‐controlled perfusion bath (Cell MicroControls, Norfolk, VA, USA) under constant perfusion of 36 ± 1°C Tyrode's solution (Fig. 1). Cells were field‐stimulated at 1 Hz. Contractile events were imaged in real time using a sarcomere‐length camera system (HVSL; Aurora Scientific, Aurora, ON, Canada). Calcium transient measurements were recorded using a low‐pass filtered illumination with oscillating excitation wavelengths of 340 and 380 nm controlled by a RatioMaster fluorescence system (PTI; Horiba, Edison, NJ, USA), with the wavelengths switched every 10 ms. Data signals were recorded with a DAP5216a data acquisition system (Microstar Laboratories, Redmond, WA, USA) and processed with custom software written in MATLAB (MathWorks Inc., Natick, MA, USA). Only rod‐shaped cells with well‐defined sarcomere striations were measured. Cells that did not respond to 1 Hz pacing were excluded regardless of appearance. From each recording, peak sarcomere length shortening, time to peak shortening, RT50, diastolic sarcomere length, calcium fluorescence ratio at diastole, magnitude of calcium transient and calcium time from peak to 50% decay (Ca‐DT50) were computed. Normalized RT50 variance was computed from the distribution of individual normalized RT50 values, obtained by dividing the RT50 value of each cell by the mean RT50 of all cells measured in each rat. An image was captured of each cell during the diastolic interval using a digital camera (Basler, Ahrensburg, Germany). Images were processed offline with ImageJ (NIH, Bethesda, MD, USA) to find the major cell length, width, aspect ratio (width/length) and area. In some experiments, (–)‐blebbistatin (5 μm) was superfused over cells for 30 min after the collection of initial contractility records. Cells were subsequently re‐imaged to measure the effect of blebbistatin on resting sarcomere length.
Figure 1. Cardiomyocyte functional testing set‐up and cell sorting via computer‐controlled single cell aspirator.
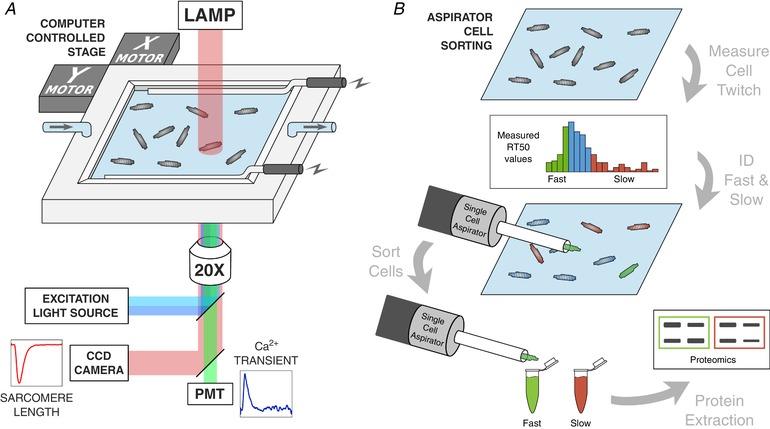
A, schematic diagram of the testing set‐up for measuring the function of unloaded, single cell cardiomyocytes. After loading with the Ca2+ fluorescent indicator Fura‐2 AM, cells were field‐stimulated at 1 Hz in a superfused temperature‐controlled bath containing Tyrode's solution. Sarcomere length shortening records were taken simultaneously with alternating 340 and 380 nm light excitation for Fura‐2 measurement of the Ca2+ transient. B, following record capture of many cardiomyocytes in the testing bath, the distribution of cell RT50 values was segmented into fast and slow cells based on the outer quartiles of the non‐normal distribution. A computer‐controlled single cell aspirator was used to collect fast‐relaxing and slow‐relaxing cells and sort them into microcentrifuge tubes. These small batches of cells were then subjected to western blot assays to compare troponin I phosphorylation between fast‐ and slow‐relaxing cells. [Color figure can be viewed at wileyonlinelibrary.com]
Cell sorting
A custom automated aspirating pipette system was constructed for collecting and sorting individual cardiomyocytes after functional testing. The system was constructed using a 1 μL Hamilton syringe, a linear voice coil actuator (BEI Kimco, Vista, CA, USA), an actuator controller (BEI Kimco) and a custom laser‐cut acrylic housing. The aspirator was mounted to a manipulatable stage with six degrees of freedom, allowing for quick movement to the centre of the testing stage where the cells are located for contractility and calcium handling measurements. The aspirated cell was then deposited by computer control into a microcentrifuge tube corresponding to its contractile attributes and temporarily stored in the same testing conditions prior to cell lysis. In this way, it was possible to accumulate groups of 30–40 myocytes sharing similar contractile behaviour. Specifically, cells were pooled into fast and slow relaxing groups according to whether their RT50 values lay above or below the inner quartile range of a large selection of cardiomyocytes.
Protein analysis
Western blotting was conducted using small batches of cardiomyocytes sorted into fast‐ or slow‐relaxing groups. Cells were centrifuged at 1000 g for 5 min at 20°C and resuspended in PBS, and then the process was repeated an additional two times where the last resuspension was with 7.5 μL of PBS. Next, 2.5 μL of 4 × Laemmli buffer was added to the microcentrifuge tube and vortexed three times until it was thoroughly mixed. The tubes were placed into a freezer at –80°C overnight to lyse the cells and thawed prior to denaturing and reducing the loading mixture at 100°C for 5 min. This protein extraction process for single fibres was adapted from Murphy et al. (2012). Then, 12% polyacrylamide gels (Bio‐Rad, Hercules, CA, USA) were loaded with the samples and ran for 75 min at 130 V. Protein was transferred to polyvinylidene difluoride membranes (Immobilon‐FL; Millipore, Billerica, MA, USA) over 90 min at 70 V in a transfer buffer containing 20% methanol. Membranes were incubated overnight in Phospho‐Troponin I (Cardiac Ser23/24; Cell Signaling Technology, Beverly, MA, USA; Cat# 4004S, Lot#4 RRID: AB_2206275) primary antibodies, and then incubated in the appropriate secondary solution before imaging. Membranes were then stripped and incubated overnight in Troponin I (Cell Signaling Technology; Cat# 4002S, Lot#2 RRID: AB_2206278) primary antibodies, incubated in the appropriate secondary solution, and then re‐imaged. Membranes were imaged at an 800 nm wavelength on a quantitative fluorescence scanner (Odyssey; Li‐Cor, Lincoln, NE, USA). As a positive control, isoproterenol (ISO) (100 nm) was added to small batches of cardiomyocytes for 30 min before preparation for protein extraction.
Statistical analysis
For comparison of variances between groups, Levene's test (assuming non‐Gaussian distributions) was used. This allowed comparison of RT50 variance between composite regions, where the null hypothesis was that the variances of the regions were the same. Regression analysis was conducted on CR3–5 between RT50 values and measurements of calcium handling, cell morphology, experimental variables and resting sarcomere length. The null hypotheses for these tests were that the slope of the line of best fit did not differ from zero. An F test was used with significance set to αadjusted = 0.005 after Bonferroni correction to account for 10 total post hoc correlations of variables against RT50 (αnormal = 0.05). Two‐tailed unpaired t tests were conducted on fluorescence data from western blotting (fast vs. slow cells) with α = 0.05 for the F tests. Two‐way ANOVA with repeated measures was used to determine the significance of blebbistatin addition on fast‐ and slow‐relaxing cells. Significance between groups was considered only after the interaction between all groups was found to have a P value below α = 0.05.
Results
The initial objective of the present study was to quantify the amount of contractile heterogeneity among rat left ventricular cardiomyocytes isolated from the same myocardial tissue region. Accordingly, we amassed hundreds of sarcomere shortening and Ca2+ transient records from Fura‐2 loaded cardiomyocytes isolated from successively smaller myocardial volumes (in order from largest to smallest: CR1–7, CR2–6, CR3–5 and CR4) (Fig. 2 A). This was repeated independently in tissue from three adult rats (a linear mixed effect model confirmed no significant animal‐to‐animal variation). We focused on RT50 (time from peak sarcomere shortening to 50% re‐lengthening) as a primary contractile performance metric. Other parameters, such as time to peak shortening, also showed a reduction in variation with decreasing tissue size (data not shown). From the data collected, it was determined that there is a limit beyond which RT50 variance does not change significantly with a reduction of tissue sample volume (n = 940 cells) (Fig. 2 C). That limit was observed to occur between CR2–6 and CR3–5 in terms of the cumulative normalized variance of RT50 (Fig. 2 B). RT50 variance was different between CR1–7 and CR2–6. It was also different between CR2–6 and CR3–5 but not between CR3–5 and CR4 (Fig. 2 D). Plotting normalized RT50 variance measured in each CR of each rat against tissue volume measured by optical coherence tomography, this plateau becomes more distinct (Fig. 2 E). These data suggest that RT50 variation does not diminish below a tissue volume of 7 mm3, retaining a SD of around 28% of mean RT50 even for tissue volumes below 1 mm3.
Before seeking a natural source of RT50 variability, we attempted to eliminate the possibility that the observed cardiomyocyte variation merely reflected random measurement noise or another uncontrolled variable. Bath temperature at the time of recording was logged with each record, and enabled a comparison of RT50 against temperature. These values were not significantly correlated (Fig. 3 A). We also considered the possibility that the duration of time spent by each cell at 1 Hz pacing conditions might be a source of variation. Cells were measured one at a time as the whole field of cells was stimulated, meaning that, at the time of record collection, each cell had spent a different amount of time under continuous stimulation (raising the prospect of cell rundown). The total amount of time each cell had spent undergoing 1 Hz pacing was plotted against the RT50 data, although this did not reveal a significant correlation (Fig. 3 B). We also looked at the relationship between peak sarcomere shortening and RT50 to determine whether cells with larger contractions simply required more time to return to resting length (Fig. 3 C). Peak shortening and RT50 were strongly correlated (P < 0.0001), although cells with the strongest contractions had the shortest relaxation times, in contrast to expectations. Finally, we stained isolated cardiomyocytes with trypan blue to look for compromised membranes. Isolations showed only a small number of obviously compromised cells, although none of the morphologically intact cells showed discernible dye accumulation (Fig. 3 D, inset). Diastolic [Ca2+]i (via Fura‐2 fluorescence) was also examined as a more quantitative measure of any artificially induced membrane damage, although this parameter was not correlated with RT50 (Fig. 3 D).
Figure 3. Correlation analysis of factors potentially impacting RT50 variations among cells isolated from CR3–5 and CR4 .
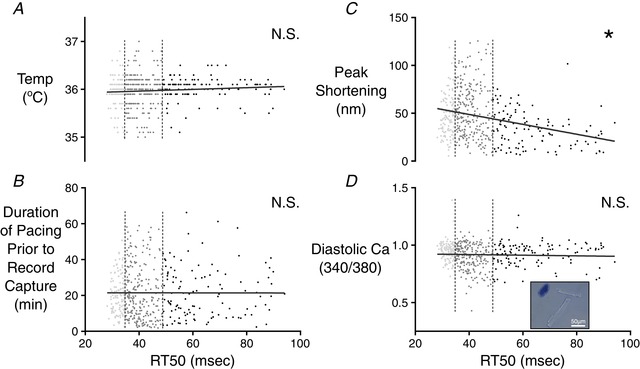
The first quartile (fast‐relaxing delineation) and third quartile (slow‐relaxing delineation) of RT50 values are indicated by the vertical dashed lines. Neither bath temperature values at the time of measurement (A), nor the duration of time from the beginning of cell pacing to the capture of the cell record (B) was correlated with RT50. C, peak sarcomere shortening of each cell was compared with the RT50 value of the same cell. The slope of the linear correlation was found to be significantly different from zero (* P ≤ 0.0001). D, to further examine potential effects of membrane integrity on relaxation time, the diastolic fluorescence ratio of the Fura‐2 Ca2+ indicator was compared with RT50 values. These two properties were not correlated. A representative image is shown in the inset to demonstrate a lack of trypan blue absorption in the healthy, rod‐like cells used for testing. A collapsed cell that has absorbed the dye can be seen in the top left indicating the compromised membrane of cells that were excluded from testing. [Color figure can be viewed at wileyonlinelibrary.com]
Further analyses focused on linking variance of RT50 with other randomly varying cellular properties, including Ca2+ handling characteristics and cellular morphology. These correlations were performed on cells isolated from CR3–5. Neither the time from peak to 50% decay of intracellular Ca2+ (Ca‐DT50), nor the magnitude of the [Ca2+]i transient showed a significant correlation with RT50 (Fig. 4 A). Indeed, representative records were easily identified, showing two cells with an almost 3‐fold difference in RT50 values that had essentially identical Ca2+ transients (Fig. 4 B).
Figure 4. Correlation analysis of calcium parameters among cells isolated from CR3–5 and CR4 .
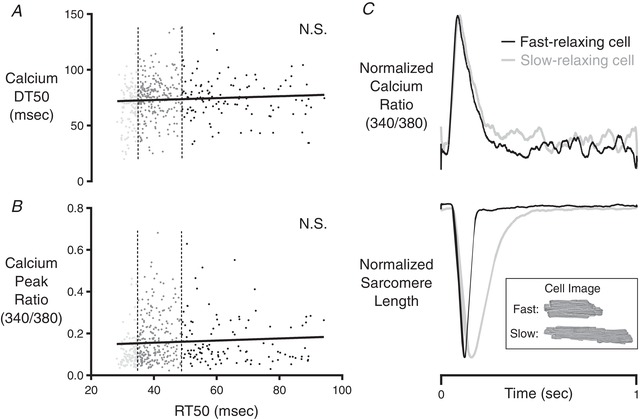
The first quartile (fast‐relaxing delineation) and third quartile (slow‐relaxing delineation) of RT50 values are indicated by the vertical dashed lines. Neither Ca‐DT50 (A), nor the peak fluorescence ratio (B) of the Fura‐2 Ca2+ indicator was correlated with RT50. C, representative records showing independence of RT50 from the shape of the intracellular calcium transient. These records were obtained in fast‐relaxing and slow‐relaxing cells within CR4 of the same rat. The normalized Ca2+ transients of these two cells were almost identical, yet their relaxation behaviours were strikingly different. The inset shows bright‐field images of the cells from which these records were taken.
Looking at cell morphology, we noted that the cells measured from CR3–5 varied widely in terms of length, width and observed area (Fig. 5 A); however, comparison between RT50 and the width of the cell, area of the cell and aspect ratio (width/length) yielded no significant correlation (Fig. 5 D–F). The length of the cell was weakly correlated to RT50, with longer cells tending to have larger RT50 values (Fig. 5 B). As a result of the multiple comparisons used in the process of identifying factors relating to RT50, this correlation was not found to be significant after using a post hoc Bonferroni correction.
Figure 5. Correlation analysis of morphological properties among cells isolated from CR3–5 and CR4 .
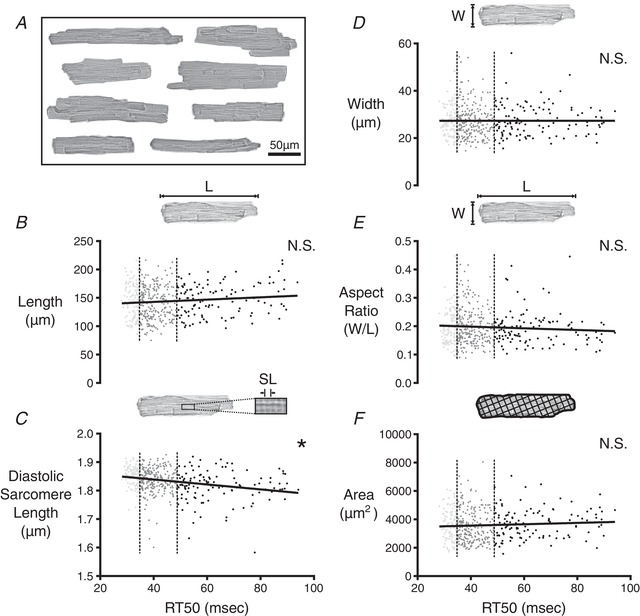
A, composite image showing a sample of the wide variety of cell shapes and sizes observed in CR4 of a single rat. B, 2‐D morphology of cardiomyocytes from CR3–5 and CR4 was analysed to find the major length (L) of each cell at rest. L values were plotted against RT50 values from the same cell. The slope of the linear correlation had a P value of ≤0.05 but was not found to be significantly different from zero as a result of the post hoc Bonferroni correction for multiple comparisons that shifted the threshold of statistical significance to α = 0.005. The first quartile (fast‐relaxing delineation) and third quartile (slow‐relaxing delineation) of RT50 values are marked by the vertical dashed lines. C, diastolic sarcomere length of each cell was compared with the RT50 value of the same cell. The slope of the linear correlation was found to be significantly different from zero (* P ≤ 0.0001). Width (W) of each cell at rest (D), aspect ratio of each cell (W/L) (E) and 2‐D area of each cell (F) were each compared with RT50. None of these properties were significantly correlated with RT50.
Most interestingly, we found a strong correlation between resting sarcomere length and RT50 (Fig. 5 C). In particular, cells with shorter resting sarcomere lengths displayed larger RT50 values. Recalling the lack of association between RT50 and diastolic Ca2+, it is clear that this behaviour is independent of Ca2+. Phosphorylation of cardiac troponin I (TnI) at sites near the N‐terminus (Ser23/24) is well known to decrease myofilament Ca2+ sensitivity and speed relaxation (Zhang et al. 1995). We therefore hypothesized that cell‐to‐cell variation in TnI could explain the link between resting sarcomere length and RT50. Specifically, we anticipated that cells displaying shorter resting sarcomere length and slow relaxation would have significantly lower TnI phosphorylation levels.
To test this hypothesis, we first ran a positive control by treating cells with ISO to artificially phosphorylate TnI. Small numbers of cells (n = 30–40) were collected and subjected to western blot analysis to quantify the ratio of phosphorylated TnI to total TnI (Fig. 6 A). As expected, ISO‐treated myocytes had significantly increased levels of phosphorylated TnI (pTnI). Subsequently, RT50 values were measured in a large field of isolated cardiomyocytes and cells were selectively pooled according to relaxation characteristics. Cells with RT50 below the first quartile of the spread (<35 ms) were considered as fast‐relaxing cells or ‘fast cells’, whereas cells with RT50 above the third quartile of the spread (>49 ms) were considered as slow‐relaxing cells or ‘slow cells’. Sorting of single cells was accomplished using an automated aspirating system, which then allowed groups of 30–40 fast or slow cells to be analysed via western blotting (Fig. 1 B). Blots revealed that fast‐relaxing cells had higher ratios of pTnI/TnI compared to slow‐relaxing cells (Fig. 6 B), yet the difference in phosphorylation ratio was not as dramatic as in the ISO‐treated experiment. Hence, it is important to note that intrinsic variation in RT50 is smaller in scale than changes in relaxation rate elicited by treatment with ISO (Dweck et al. 2014). This is a strong indication that the observed variance in RT50 was not merely an experimental artefact but, instead, comprised a naturally occurring phenomenon driven by differing myofilament properties that include variable levels of pTnI.
Figure 6. Phosphorylated troponin I levels in fast‐ and slow‐relaxing cells.
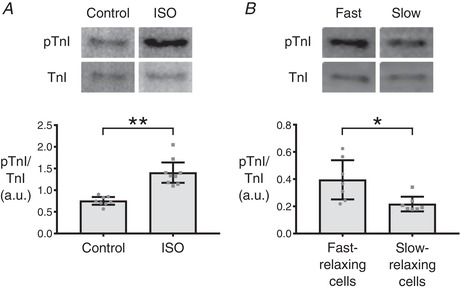
A, small batches of 30–40 cardiomyocytes were collected via the single cell aspirator from CR4 and either treated with ISO to induce phosphorylation of troponin I (TnI) or left untreated as a control. The aim was to test the efficacy of the protocol used for small batch western blotting with cardiomyocytes. ISO‐treated cells exhibited a significant elevation in phosphorylated TnI (pTnI; ** P ≤ 0.0001). B, small batches of 30–40 cardiomyocytes that fell into either the fast‐relaxing or slow‐relaxing groups were collected from CR4 via the single cell aspirator. Western blotting revealed an increased pTnI in the fast‐relaxing group compared to the slow‐relaxing group (* P ≤ 0.05). Bars indicate 95% confidence intervals.
Having seen that varying RT50 can be explained by differences in pTnI levels, the next question was whether pTnI levels are simply stochastic in each cell or whether other identifiable cellular characteristics are driving this variability. Two possibilities were suggested from our morphological analysis, namely resting sarcomere length and overall cardiomyocyte length (although the latter did not reach statistical significance in our initial data set). We hypothesized that shorter resting sarcomere length in slow cells was actually a consequence (and not a driver) of lower pTnI. In isolated unloaded cells, a lower pTnI would lead to increased myofilament Ca2+ sensitivity, partial engagement of actin‐myosin cross‐bridges even at rest, and therefore a shorter resting sarcomere length. To test this, we measured resting sarcomere length before and after introduction of the myosin inhibitor blebbistatin (n = 28 and 30, respectively, for fast and slow cells) (Fig. 7 A). Slow cells had a lower diastolic sarcomere length compared to fast cells before treatment, but after 30 min of incubation in blebbistatin the sarcomere lengths were equalized. This is indicative of higher sensitivity to diastolic calcium in the myofilaments of the slow cells because no difference in diastolic Ca2+ concentration was observed between fast and slow cells (Fig. 3 D).
Figure 7. Diastolic sarcomere lengths before and after treatment with blebbistatin, and a repeated experiment focused on cell length.
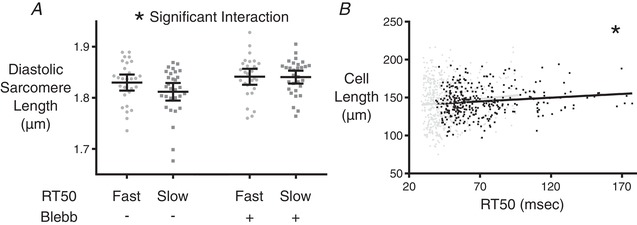
A, diastolic sarcomere length was measured in cardiomyocytes classified as either fast‐ or slow‐relaxing. The measurement was performed before and after the addition of blebbistatin for each group. Two‐way ANOVA shows a significant interaction among the test groups (* P ≤ 0.05), meaning that fast and slow cells reacted differently to blebbistatin. Bars indicate 95% confidence intervals. B, separate examination of the relationship between resting cell length and RT50 was conducted on 327 cells from CR3–5 of two additional rats. The slope of the linear correlation was found to be significantly different from zero (* P ≤ 0.05). Black markers and line indicate the separate examination, whereas the data from Fig. 5B are underlaid in grey for reference.
This still left the possibility of cardiomyocyte length as a property associated with pTnI levels and RT50 behaviour. A follow‐up experiment on CR3–5 cells from two additional adult rats was conducted where the only correlation analysed was resting cell length as a function of RT50 (n = 327 cells) (Fig. 7 B). These data showed significant correlation between RT50 and resting cell length (P < 0.05), with longer cells showing slower relaxation behaviour.
Having characterized microscale heterogeneity in the central regions of the left ventricular epicardium, it remained unclear whether intrinsic variability of RT50 might be different in outer regions (apex and base). To examine this, we conducted a follow‐up experiment on one additional rat to observe the inherent RT50 variation within each of the seven epicardial sections (Fig. 8). Variation in RT50 was similar among groups despite the expected region‐specific differences in mean RT50. The notable exception was the extreme apical region, which had a significantly higher RT50 variance. This may be the result of complex fibre geometry in that region.
Figure 8. A separate experiment was conducted in one additional rat to look at the mean relaxation behaviour among cells from each epicardial section.
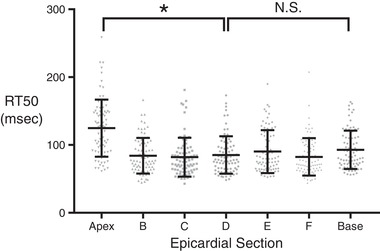
Eighty cells from each epicardial section were tested, and a one‐way ANOVA was conducted to assess whether there were significant differences in mean RT50. The outcome of the one‐way ANOVA was highly significant (P ≤ 0.0001), indicating that regional differences in mean contractile properties were present. The variance of RT50 values between the apex‐adjacent section and innermost section (Levene's test for equality of variance) was highly significant (* P ≤ 0.0001). The same test for difference in variance between the base‐adjacent section and the innermost section was not found to be significant.
Discussion
Functional differences between distinct spatial regions of the myocardium are well known (Cordeiro et al. 2004). The present study shows that variation of relaxation time among cardiomyocytes within small regions is also significant. Within a myocardial tissue volume of 7 mm3, RT50 was found to have a SD of 28% of the mean, and this degree of variation persisted even within tissue volumes as small as 1 mm3. Within CR3–5, RT50 values of the slowest and fastest cells differed by a factor of three. The sources of this stark variation, as well as its potential impact on our understanding of myocardial relaxation, are worth careful consideration.
Although our exploration of the causes of microscale cardiomyocyte heterogeneity was not exhaustive, two important objectives were attained. The first is the elimination of experimental artefact as the primary source of variation. RT50 values were not correlated with temperature or factors representing cell integrity. On the other hand, RT50 was directly related to TnI phosphorylation levels. This crucial causative link reinforces the notion that cell‐to‐cell differences are intrinsic and therefore exist in situ within the intact myocardium. The existence of microscale cardiomyocyte heterogeneity is also supported by a second key result, namely that cardiomyocyte relaxation is correlated with the overall length of the cell. Cardiomyocyte length and volume have been shown to vary significantly even among directly adjacent cells (Lasher et al. 2009). In that study, a small region of intact myocardium was imaged to reveal that neighbouring ventricular cardiomyocytes have a SD of 12.7% of the mean cell length and 34.9% of the mean cell volume. In light of the cell length–RT50 correlation reported in the present study (Fig. 7 B), these directly adjacent cells should possess a diverse set of intrinsic relaxation rates matching their morphological diversity.
The emerging picture is one in which cardiomyocytes adapt to their microenvironment, which includes a variety of chemical and mechanical factors. These presumably lead to the diversity of cell morphologies and functional characteristics we and others have documented (Lichter et al. 2016). There are a number of studies in non‐cardiac cells that establish a link between cellular morphology and cell phenotype. Padovan‐Merhar et al. (2015) have shown that the quantity of mRNA in an individual cell scales with cell volume via increased transcriptional activity in larger cells. Although the exact mechanism for detecting and responding to cell volume was not found, it was possible to localize this effect to events within the nucleus. Other studies have also found a positive correlation between mRNA variability and cell volume that can explain the ‘noise’ found in certain experimental records (Kempe et al. 2015). It was suggested that the variation could be attributed to cell growth. It is not difficult to imagine cardiomyocytes experiencing similar effects as they grow into particular geometric niches. An intriguing possibility is that the observed morphological and functional diversity reflects cardiomyocytes of varying ages within the myocardium (Senyo et al. 2013).
The variation in TnI phosphorylation could partly be a result of unique mechanical stresses experienced by each cardiomyocyte. Rodriguez et al. (1993) observed changes in the resting sarcomere lengths of cells in intact cardiac sections before and after they relieved the residual stresses in the plane of the section. Residual stresses are certain to vary with the local geometry surrounding each cell. Just as global changes in myocardial load affect the average volume of cardiomyocytes (Ibrahim et al. 2012), heterogeneous loading of individual cells appears to be capable of driving microscopic variation in cell volumes. Driscoll et al. (2015) have shown direct mechanosignalling pathway activation in the nuclear membrane via strain transmitted through the cytoskeleton. Numerous signalling pathways related to mechanical interactions through the sarcolemma could link mechanical forces to increased TnI‐targeted kinase activity (Hu et al. 2013). It is interesting to note that this is not the first study to suggest a link between TnI phosphorylation and cardiomyocyte heterogeneity. Hanft and McDonald (2010) observed that cells isolated from the rat left ventricle were bi‐modally distributed in terms of their length‐dependent activation response. These differences were erased by treating cells with protein kinase A, whose targets include Ser23/24 of cardiac TnI.
In some ways, it is surprising that neighbouring cells having significantly different characteristics can function together effectively. It is true that electrotonic coupling of cardiomyocytes via gap junctions tend to minimize electrophysiological differences between cells (Quinn et al. 2016). Similarly, mechanical connections between cells at costameres and intercalated discs may attenuate mechanical heterogeneity at the microscale. Even so, a significant degree of mechanical variability now appears probable in the intact myocardium. Indeed, it is fascinating to consider the idea that a certain amount of inhomogeneity may actually facilitate cardiac relaxation. Computational modelling of interacting half‐sarcomeres of different compliances has shown that series compliance is critical for producing rapid relaxation (Campbell 2016). In the intact myocardium, varied cellular relaxation rates may provide an effective series compliance that promotes proper relaxation. New computational models that make use of the realistic RT50 variations reported in the present study may lend new insight into myocardial relaxation.
The work reported in the present study identifies microscale heterogeneity as a consistently observable phenomenon, although it does not resolve all the mechanistic questions entailed by these observations. Answering such questions would require the design of additional studies. For example, it is not clear whether the differences in TnI phosphorylation observed in isolated cells would be identical if observed in situ. Mean TnI phosphorylation levels in isolated cells may be reduced on average from the in vivo setting (Najafi et al. 2016). Furthermore, we have not considered the effects that TnI phosphorylation level could have on buffering of free Ca2+ by the troponin complex. This may explain the puzzling lack of correlation between Ca‐DT50 and RT50; however, the natural variation of the calcium transient among cells obscures any such effect in the present data set. Another curiosity is the negative correlation seen between RT50 and peak sarcomere length shortening. Ordinarily, the cells with the largest contractions would have the slowest relaxation rates. The unexpected behaviour in our data set could be indicative of further effects of additional phosphorylation changes within the myofilament. Finally, given that proteomic observations are subject to change over relatively short periods of time, the correlation between cell length and RT50 is critical. This provides a durable link between our in vitro observations and in vivo function because differences in cell size are essentially maintained between these two states; however, we have not clarified the mechanisms by which morphological differences influence proteomic changes and, ultimately, cell function.
In conclusion, we have identified significant variation in the relaxation rate of cardiomyocytes isolated from the same small myocardial volume. The diverse relaxation rates appear to be explained by differences in TnI phosphorylation, and are correlated with cell length. These results suggest that morphology and microenvironment are drivers of phenotypic diversity among cardiomyocytes, raising the possibility that cell‐to‐cell heterogeneities play an important role in myocardial relaxation.
Additional information
Competing interests
The authors declare that they have no competing interests.
Author contributions
JAC and SGC designed the experiments and experimental apparatus, prepared the figures, and wrote the manuscript. JAC performed the experiments and analysed data. Both authors have approved the final version of the manuscript submitted for publication.
Funding
This work was supported by a National Science Foundation Grant (CMMI‐1562587) to SGC.
Acknowledgements
The authors would like to thank Lorenzo R. Sewanan for bringing our attention to the technique for processing single fibres for western blotting.
Biography
J. Alexander Clark earned a BS at The Ohio State University, an MS at Yale University, and is pursuing a PhD at Yale University, all in Biomedical Engineering. These experiments have laid the foundation for further investigation into the implications of cellular heterogeneity on the overall relaxation of the myocardium. Computational modelling of the myocardium using the data from this study is currently being investigated to better understand cell‐to‐cell co‐operativity. He hopes to work in research and development in the industrial sector designing biomedical devices or engineered tissues.

Edited by: Don Bers & Bjorn Knollmann
Linked articles: This article is highlighted in a Perspectives article by Kuster. To read this article, visit https://doi.org/10.1113/JP277287.
References
- Bahar R, Hartmann CH, Rodriguez KA, Denny AD, Busuttil RA, Dollé ME, Calder RB, Chisholm GB, Pollock BH, Klein CA, Vijg J (2006). Increased cell‐to‐cell variation in gene expression in ageing mouse heart. Nature 441, 1011. [DOI] [PubMed] [Google Scholar]
- Bogaert J & Rademakers FE (2001). Regional nonuniformity of normal adult human left ventricle. Am J Physiol Heart Circ Physiol 280, H610–H620. [DOI] [PubMed] [Google Scholar]
- Campbell KS (2016). Compliance accelerates relaxation in muscle by allowing myosin heads to move relative to actin. Biophys J 110, 661–668. [DOI] [PMC free article] [PubMed] [Google Scholar]
- Campbell SG, Haynes P, Snapp K, W. N, KE & Campbell KS (2013). Altered ventricular torsion and transmural patterns of myocyte relaxation precede heart failure in aging F344 rats. Am J Physiol Heart Circ Physiol 305, H676–H686. [DOI] [PMC free article] [PubMed] [Google Scholar]
- Cordeiro JM, Greene L, Heilmann C, Antzelevitch D & Antzelevitch C (2004). Transmural heterogeneity of calcium activity and mechanical function in the canine left ventricle. Am J Physiol Heart Circ Physiol 286, H1471–H1479. [DOI] [PubMed] [Google Scholar]
- Driscoll TP, Cosgrove BD, Heo S‐J, Shurden ZE & Mauck RL (2015). Cytoskeletal to nuclear strain transfer regulates YAP signaling in mesenchymal stem cells. Biophys J 108, 2783–2793. [DOI] [PMC free article] [PubMed] [Google Scholar]
- Dweck D, Sanchez‐Gonzalez MA, Chang AN, Dulce RA, Badger C‐D, Koutnik AP, Ruiz EL, Griffin B, Liang J, Kabbaj M et al. (2014). Long‐term ablation of PKA‐mediated cardiac troponin I phosphorylation leads to excitation‐contraction uncoupling and diastolic dysfunction in a knock‐in mouse model of hypertrophic cardiomyopathy. J Biol Chem jbc–M114. [DOI] [PMC free article] [PubMed] [Google Scholar]
- Elowitz MB, Levine AJ, Siggia ED & Swain PS (2002). Stochastic gene expression in a single cell. Science 297, 1183–1186. [DOI] [PubMed] [Google Scholar]
- Hanft LM & McDonald KS (2010). Length dependence of force generation exhibit similarities between rat cardiac myocytes and skeletal muscle fibres. J Physiol 588, 2891–2903. [DOI] [PMC free article] [PubMed] [Google Scholar]
- Hu Z, Xiong Y, Han X, Geng C, Jiang B, Huo Y & Luo J (2013). Acute mechanical stretch promotes eNOS activation in venous endothelial cells mainly via PKA and Akt pathways. PLoS ONE 8, e71359. [DOI] [PMC free article] [PubMed] [Google Scholar]
- Ibrahim M, Kukadia P, Siedlecka U, Cartledge JE, Navaratnarajah M, Tokar S, Van Doorn C, Tsang VT, Gorelik J, Yacoub MH et al. (2012). Cardiomyocyte Ca2+ handling and structure is regulated by degree and duration of mechanical load variation. J Cell Mol Med 16, 2910–2918. [DOI] [PMC free article] [PubMed] [Google Scholar]
- Kempe H, Schwabe A, Crémazy F, Verschure PJ & Bruggeman FJ (2015). The volumes and transcript counts of single cells reveal concentration homeostasis and capture biological noise. Mol Biol Cell 26, 797–804. [DOI] [PMC free article] [PubMed] [Google Scholar]
- Lasher RA, Hitchcock RW & Sachse FB (2009). Towards modeling of cardiac micro‐structure with catheter‐based confocal microscopy: a novel approach for dye delivery and tissue characterization. IEEE Trans Med Imaging 28, 1156–1164. [DOI] [PubMed] [Google Scholar]
- Lichter J, Li H & Sachse FB (2016). Measurement of strain in cardiac myocytes at micrometer scale based on rapid scanning confocal microscopy and non‐rigid image registration. Ann Biomed Eng 44, 3020–3031. [DOI] [PMC free article] [PubMed] [Google Scholar]
- Murphy RM, Xu H, Latchman H, Larkins NT, Gooley PR & Stapleton DI (2012). Single fiber analyses of glycogen‐related proteins reveal their differential association with glycogen in rat skeletal muscle. Am J Physiol Cell Physiol 303, C1146–C1155. [DOI] [PubMed] [Google Scholar]
- Najafi A, Sequeira V, Helmes M, Bollen IA, Goebel M, Regan JA, Carrier L, Kuster DW & Van Der Velden J (2016). Selective phosphorylation of PKA targets after β‐adrenergic receptor stimulation impairs myofilament function in Mybpc3‐targeted HCM mouse model. Cardiovasc Res 110, 200–214. [DOI] [PubMed] [Google Scholar]
- Padovan‐Merhar O, Nair GP, Biaesch AG, Mayer A, Scarfone S, Foley SW, Wu AR, Churchman LS, Singh A & Raj A (2015). Single mammalian cells compensate for differences in cellular volume and DNA copy number through independent global transcriptional mechanisms. Mol Cell 58, 339–352. [DOI] [PMC free article] [PubMed] [Google Scholar]
- Quinn TA, Camelliti P, Rog‐Zielinska EA, Siedlecka U, Poggioli T, O'Toole ET, Knöpfel T & Kohl P (2016). Electrotonic coupling of excitable and nonexcitable cells in the heart revealed by optogenetics. Proc Natl Acad Sci U S A 113, 14852–14857. [DOI] [PMC free article] [PubMed] [Google Scholar]
- Rodriguez EK, Omens JH, Waldman L & McCulloch A (1993). Effect of residual stress on transmural sarcomere length distributions in rat left ventricle. Am J Physiol Heart Circ Physiol 264, H1048–H1056. [DOI] [PubMed] [Google Scholar]
- Senyo SE, Steinhauser ML, Pizzimenti CL, Yang VK, Cai L, Wang M, Wu T‐D, Guerquin‐Kern J‐L, Lechene CP & Lee RT (2013). Mammalian heart renewal by pre‐existing cardiomyocytes. Nature 493, 433. [DOI] [PMC free article] [PubMed] [Google Scholar]
- Wan X, Bryant S & Hart G (2003). A topographical study of mechanical and electrical properties of single myocytes isolated from normal guinea‐pig ventricular muscle. J Anat 202, 525–536. [DOI] [PMC free article] [PubMed] [Google Scholar]
- Zhang R, Zhao J, Mandveno A & Potter JD (1995). Cardiac troponin I phosphorylation increases the rate of cardiac muscle relaxation. Circ Res 76, 1028–1035. [DOI] [PubMed] [Google Scholar]


