Abstract
As an important component of innate immunity, human circulating γδ T cells function in rapid responses to infections and tumorigenesis. MicroRNAs (miRNAs) play a critical regulatory role in multiple biological processes and diseases. Therefore, how the functions of circulating human γδ T cells are regulated by miRNAs merits investigation. In this study, we profiled the miRNA expression patterns in human peripheral γδ T cells from 21 healthy donors and identified 14 miRNAs that were differentially expressed between peripheral αβ T cells and γδ T cells. Of the 14 identified genes, 7 miRNAs were downregulated, including miR-150-5p, miR-450a-5p, miR-193b-3p, miR-365a-3p, miR-31-5p, miR-125b-5p and miR-99a-5p, whereas the other 7 miRNAs were upregulated, including miR-34a-5p, miR-16-5p, miR-15b-5p, miR-24-3p, miR-22-3p, miR-22-5p and miR-9-5p, in γδ T cells compared with αβ T cells. In subsequent functional studies, we found that both miR-125b-5p and miR-99a-5p downregulated γδ T cell activation and cytotoxicity to tumor cells. Overexpression of miR-125b-5p or miR-99a-5p in γδ T cells inhibited γδ T cell activation and promoted γδ T cell apoptosis. Additionally, miR-125b-5p knockdown facilitated the cytotoxicity of γδ T cells toward tumor cells in vitro by increasing degranulation and secretion of IFN-γ and TNF-α. Our findings improve the understanding of the regulatory functions of miRNAs in γδ T cell activation and cytotoxicity, which has implications for interventional approaches to γδ T cell-mediated cancer therapy.
Introduction
γδ T cells, T-cell subunits with a T cell receptor (TCR) composed of γ and δ chains, constitute only a small proportion (3–10%) of circulating CD3+ T lymphocytes in human peripheral blood.1 Compared with conventional αβ T cells, γδ T cells differ in their distribution, antigen recognition and biological function.2,3,4,5 They respond polyclonally in a major histocompatibility complex (MHC)-unrestricted manner.6,7 Thus, γδ T cells convert innate immune pattern recognition into a quick response to pathogens and tumors.8,9 Simultaneously, γδ T cells can also serve as antigen-presenting cells (APCs) to participate in the adaptive immune response.10,11
MicroRNAs (miRNAs) are endogenous, small, non-coding RNAs (approximately 18–25 nucleotides) that are naturally occurring and evolutionarily highly conserved. They usually negatively regulate post-transcriptional gene expression by binding to the 3′ untranslated region (UTR) of their target mRNAs to degrade or inhibit their translation.12,13 Increasing evidence has demonstrated that miRNAs play crucial roles in immune cell development and immune responses to pathogens and cancer.14 For example, miR-150 regulates the transcription factor c-Myb,15 miR-181 modulates T-cell antigen receptor sensitivity,16 and miR-155 affects the differentiation of CD4+ T lymphocytes into T helper type 1 (Th1) cells.17 In human tonsil germinal centers, miR-125b is upregulated in B lymphocytes, and its target is the transcriptional repressor Blimp-1.18 miR-125b is overexpressed in human hematological tumors, such as acute lymphoblastic leukemia and acute myeloid leukemia, and miR-125b overexpression in hematopoietic stem cells causes myeloid leukemia in mice.19,20
miRNA analysis has been performed using mouse lymphocyte subsets and 17 different highly purified human lymphocyte subsets.21 However, the miRNA expression profiles and functions in γδ T cells have not been fully characterized. In this study, we characterized the miRNAs expression profiles of peripheral γδ T cells and αβ T cells, and 14 differentially expressed miRNAs were identified. Of these miRNAs, 7 were upregulated and 7 were downregulated in γδ T cells. Functional studies revealed that miR-125b-5p and miR-99a-5p exhibited negative regulatory roles in γδ T cell activation and cytotoxicity.
Materials and methods
Sample collection
Peripheral blood samples from healthy donors were collected at the Institute of Basic Medical Sciences at the Chinese Academy of Medical Sciences. All samples were collected with informed consent and approved by the ethical board of the Institute of Basic Medical Sciences at the Chinese Academy of Medical Sciences.
Cell isolation
Peripheral blood mononuclear cells (PBMCs) were isolated by density gradient centrifugation using a Ficoll density gradient (GE Healthcare, United Kingdom) as described previously.22,23 αβ T cells and γδ T cells were simultaneously purified from PBMCs using magnetic-activated cell sorting (MACS). In brief, we separated donor PBMCs into two portions to purify either γδ T cells using a human TCRγ/δ+ T cell isolation kit (Miltenyi Biotechnology Incorporation, Cologne, Bergisch Gladbach, Germany) or αβ T cells using a human TCRα/β+ T-cell isolation kit (Miltenyi Biotechnology Incorporation). The purity of the separated T cells was detected by flow cytometry (FCM). A purity >90% for both T-cell subsets was considered qualifiable for the experiments.
RNA isolation and quantitative real-time PCR analysis
RNA was isolated using TRIzol LS Reagent (Life Technologies, USA) according to a previously described protocol.24 Briefly, the cell pellets were resuspended in TRIzol LS Reagent and homogenized by pipetting. Chloroform was then added to induce phase separation, and the top, clear, aqueous phase containing RNA was precipitated and washed several times. All extracted RNAs were measured with a NanoDrop 8000 spectrophotometer. The synthesized C. elegans miRNAs cel-miR-67 and cel-miR-356 were supplied extrinsically together with U1 and U6 as normalization controls for miRNA quantification. cDNA was quantified using the QuantoBio three-step quantitative PCR method. First, polyA tails were added to the pre and mature forms of the miRNAs with A-Plus bacterial polyA polymerase. The miRNAs were then reverse-transcribed and universally tagged; an oligo dT and universal tag were added, and reverse transcription was initiated by MuLV retrotranscriptase. The first strands of the cDNAs were then synthesized, and 5′-end universal tags were produced. Finally, real-time PCR quantification was performed using miRNA-specific primers and 3′ universal primer mix.
Data treatment and statistical analyses
The raw Ct values were calculated and exported using the ABI 7500 instrument as ‘Amplification Data’ text files. In the first screening, 6 samples and 353 detectors (347 miRNAs detectors+6 control detectors) were loaded. Candidate endogenous control(s) were analyzed using Genorm and normalized using cel-mir-356, cel-miR-67, U1 and U6. All samples were normalized according to the M-value analysis. The second validation was loaded on 36 samples and 21 detectors. All samples were normalized according to their U6 value based on the m-value analysis. The △Ct hierarchical clustering was then analyzed using the complete linkage method, Euclidean distance and z-score normalization. Differential expression was tested using the paired tests (Student’s t-tests) false discovery rate (FDR) method with an adjusted P-value threshold of 0.05. To examine the differentially expressed γδ T cells, αβ T cells were used as the background.
γδ T-cell activation
γδ T-cell activation and expansion were performed as described previously.25,26 Briefly, 24-well plates were coated with 0.5 μg of anti-pan γδ TCR mAb (Immunotech, Beckman Coulter, Brea, CA, USA). After removal of this solution, PBMCs were added to the plates and cultured in RPMI 1640 medium (Corning, Corelle City, NY, USA) supplemented with 10% fetal bovine serum (FBS) (Gibco BRL company, USA), 200 IU/ml recombinant human IL-2 (Beijing Read United Cross Pharmaceutical Co., Ltd., China), 100 mg/ml penicillin and 100 U/ml streptomycin at 37 °C and 5% CO2 for 5 days. The PBMCs were then transferred to culture bottles and passaged based on their growth until a purity >90% was achieved. IL-2 was removed after 24 h to obtain rested γδ T cells. For the isoprenyl pyrophosphate activation pathway, 10 μM pamidronate (PAM, Novartis, Switzerland) was added to PBMCs in complete medium followed by passaging every 1–3 days.
Cytotoxicity assay
Daudi and Raji (human Burkitt’s lymphoma) tumor cell lines were cultured in complete RPMI 1640 medium with 10% FBS, which was obtained from the Cell Culture Center of the Institute of Basic Medicine at the Chinese Academy of Medical Sciences. We used the CytoTox 96 Non-radioactive Cytotoxicity Assay (Promega, Madison, WI, USA) to determine specific cytotoxicity, which is based on the colorimetric detection of the released lactate dehydrogenase enzyme. Daudi and Raji cells were co-cultured with activated γδ T cells without IL-2 at 37 °C at an E:T ratio of 1:1 after γδ T cells were cultured and expanded by anti-pan γδ TCR antibodies for 10 days and the purity reached >90%. After 6 h, the culture supernatants were collected to detect the lactate dehydrogenase activity according to the manufacturer’s instructions.
DNA transfection by electroporation
miR-125b-5p and miR-99a-5p mimics or inhibitors were commercial products purchased from Life Technologies (miRIDIAN microRNA mimic/miRIDIAN hairpin inhibitor). Activated γδ T cells were transfected with either 100 pmol, mimic or inhibitor using the Amaxa Nucleofector Kit V, program T-23. The transfected cells were assayed after a rest period of 24 h. Dead cells were removed using the Dead Cell Removal Kit (Miltenyi Biotechnology Incorporation, Germany).
FCM
Cells were collected and sustained with different fluorochrome-conjugated monoclonal antibodies (Biolegend, San Diego, CA, USA). For intracellular cytokine detection, BFA (brefeldin A, eBioscience, San Diego, CA, USA) was added to the culture medium to inhibit protein transport from the endoplasmic reticulum to the Golgi apparatus. Cytometric data were acquired using a BD Accuri C6 flow cytometer (BD Biosciences, Franklin Lakes, NJ, USA). The data were analyzed with FlowJo Software (TreeStar Inc., Redmond, WA, USA), and either the percentage of positively stained cells or the mean fluorescence intensity is presented.
Proliferation and apoptosis analysis
The CellTrace™ CFSE Cell Proliferation Kit (Life Technologies, Carlsbad, CA, USA) and the Cell Counting Kit 8 (CCK-8) (DOJINDO, Tokyo, Japan) were employed to detect cell proliferation according to the associated user manuals as described previously.27,28 Briefly, 5 mM CFSE stock solution was added to 106 γδ T cells for 15 min at 37 °C. Then, γδ T cells were centrifuged and resuspended in fresh medium. After staining, cell division in which CFSE was incorporated was detected by FCM. To detect apoptosis, CCK-8 was added to 105 γδ T cells for 4 h at 37 °C, and the OD450 value was measured using a microplate reader. Apoptosis was detected using the Annexin V Apoptosis Detection Kit (Life Technologies), caspase 3 (active) the FITC Staining Kit (Abcam, Cambridge, UK), and the In situ BrdU-Red DNA Fragmentation (TUNEL) Assay Kit (Abcam). Cells undergoing early apoptosis were FITC Annexin V-positive and PI-negative, and cells undergoing late apoptosis and cells that were already dead were positive for both FITC Annexin V and PI.
Lentiviral-mediated microRNA overexpression
miR-125b-5p (primer: 5′--3′, 5′--3′) and miR-99a-5p (primer: 5′--3′, 5′--3′) were amplified such that they consisted of the stem loop structure plus 300–500 base pairs of upstream and downstream flanking genomic sequences. After purification, the DNA segments were ligated into the pCDH-CMV-MCS-EF1-copGFP vector (System Biosciences, Palo Alto, CA, USA). Then, the constructed lentiviral vectors were co-transfected into 293T cells with a packaging plasmid mix using Lipofectamine 2000 (ThermoFisher, USA). After 48 and 72 h, the culture supernatants were collected as pseudoviral particles by filtration and ultracentrifugation and then used to activate γδ T cells, which were cultured with anti-pan γδ TCR antibodies for 10 days and reached a purity of >90%, to overexpress the microRNAs. C. elegans miRNA was used as a negative control.
Statistical analysis
Data are expressed as the means±s.e.m. Paired Student’s t-tests (SPSS version 16.0 software) were used to determine significant differences between groups. A P-value <0.05 was considered statistically significant.
Results
Identification of differentially expressed miRNAs between human primary αβ T and γδ T lymphocytes
To characterize the differences in miRNA expression profiles between αβ T cells and γδ T cells, αβ T and γδ T cells were purified from 3 healthy donors, respectively. (Supplementary Figure 1 and Supplementary Table 1). Based on the expression levels (Supplementary Table 2), 21 differentially expressed miRNAs were identified between γδ T cells and αβ T cells (Figure 1), including the top 9 downregulated miRNAs (miR-99a-5p, miR-370, miR-125b-5p, miR-193b-3p, miR-450a-5p, miR-150-5p, miR-29c-3p, miR-31-5p and miR-365a-3p: the ΔΔCt cutoff value was 1.5; Figure 1b) and the top 12 upregulated miRNAs (miR-34a-5p, miR-24-3p, miR-718, miR-302a-3p, miR-16-5p, miR-15b-5p, miR-22-3p, miR-451a, miR-711, miR-23a-5p, miR-9-5p and miR-22-5p: the ΔΔCt cutoff value was 3.0; Figure 1c) in γδ T cells.
Figure 1.
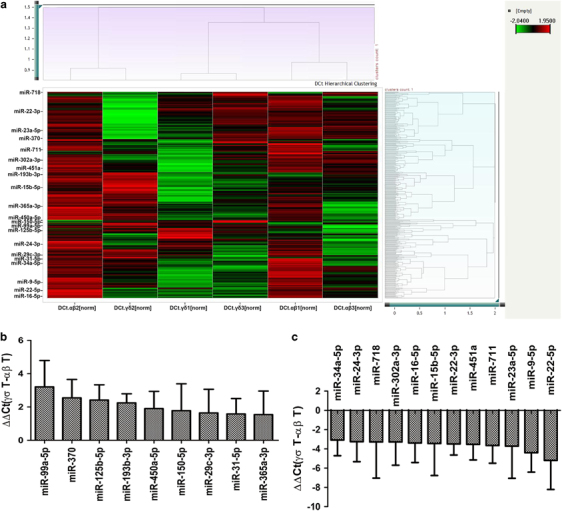
Differentially expressed miRNAs between γδ T cells and αβ T cells. (a) Heat map of the correlated miRNAs between γδ T cells and αβ T cells from three donors. The ΔCt values of 347 detectors and 6 samples were analyzed by hierarchical clustering after real-time RT-PCR. (b) ΔΔCt values of the top 9 downregulated miRNAs in γδ T cells compared with αβ T cells; the ΔΔCt cutoff value was 1.5. (c) ΔΔCt values of the top 12 upregulated miRNAs in γδ T cells compared with αβ T cells; the ΔΔCt cutoff value was 3.0. Data are shown as the means±s.d.
Validation of miRNAs that were differentially expressed between human primary αβ T and γδ T lymphocytes
To verify whether the 21 miRNAs identified were in fact differentially expressed between human primary αβ T and γδ T lymphocytes, we performed real-time RT-PCR in αβ T cells and γδ T cells from 18 healthy donors (Supplementary Table 3) to examine their expression levels (Supplementary Table 4). After real-time PCR, the ΔCt values of 21 detectors and 36 samples were analyzed by hierarchical clustering using the complete linkage method, Euclidean distance and z-score normalization. All samples could be clearly divided into two groups: αβ T cells and γδ T cells (Figures 2a and b). The results showed that the expression levels of 14 miRNAs belonging to 11 miRNA families were significantly different between αβ T cells and γδ T cells (P<0.05). These miRNAs included 7 downregulated miRNAs (miR-125-5p, miR-99a-5p, miR-31-5p, miR-365a-3p, miR-193b-3p, miR-150-5p and miR-450a-5p; Figure 2c) and 7 upregulated miRNAs (miR-34a-5p, miR-16-5p, miR-15b-5p, miR-24-3p, miR-22-5p, miR-22-3p, and miR-9-5p) in γδ T cells (Figure 2d). However, we did not find any miRNAs that were uniquely expressed in either αβ T cells or γδ T cells in our two rounds of screening.
Figure 2.
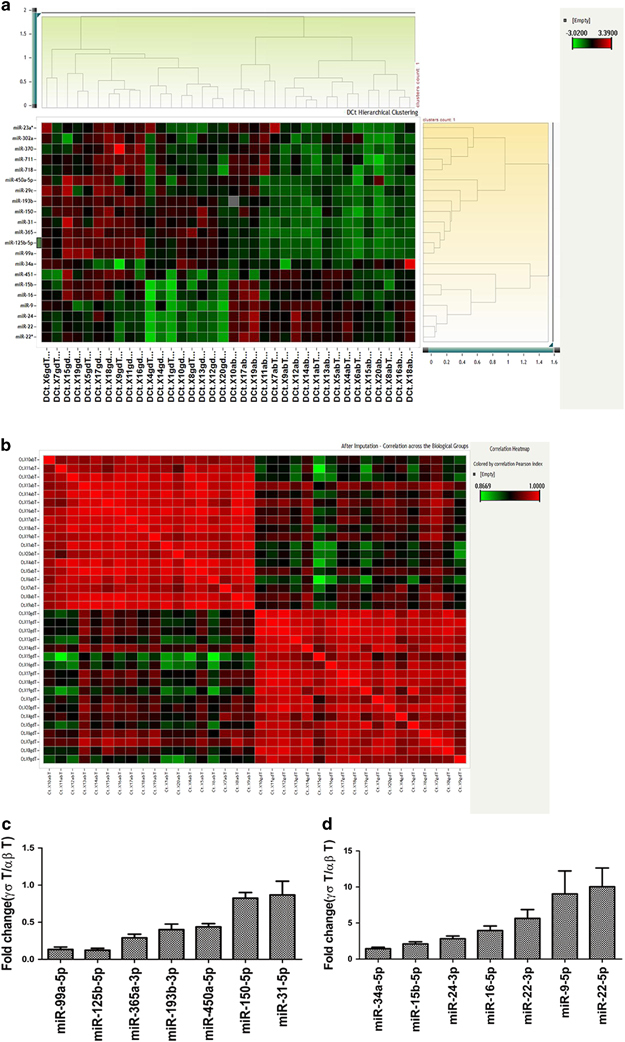
Differentially expressed miRNAs between γδ T cells and αβ T cells. Differential expression was determined using the paired test (Student’s t-tests) false discovery rate (FDR) method with an adjusted P-value threshold of 0.05. (a) Hierarchical clustering of the ΔCt values of the expression of the identified miRNAs between αβ T and γδ T cells. (b) Correlation across biological groups after imputation. (c and d). Fold changes in differentially expressed miRNAs between αβ T cells and γδ T cells. (c) Downregulated miRNAs in γδ T cells. (d) Upregulated miRNAs in γδ T cells. Data are shown as the means±s.e.m.
miR-125b-5p and miR-99a-5p were downregulated in activated γδ T cells
We sought to determine whether the differentially expressed miRNAs varied according to the various stages of γδ T-cell activation. In our preliminary experiments, we found that the isoprenyl pyrophosphate preferably activated Vδ2+ γδ T cells, which could bias the analysis of differences between αβ and γδ T cells. Next, we activated and expanded γδ T cells with anti-pan γδ TCR antibodies, resulting in Vδ1+ and Vδ2+ subsets and a ratio of Vδ1/Vδ2 T similar to peripheral blood γδ T cells (Supplementary Figure 2). Thus, the 14 differentially expressed miRNAs were analyzed in γδ T cells during four different stages of activation using anti-pan γδ TCR antibodies (Figure 3). Freshly isolated γδ T cells from PBMCs were defined as being in the non-activated stage. γδ T cells stimulated by an antibody for 24 h were regarded as being in the early stage of activation. The percentage of γδ T cells reached ~90% after being cultured for 10 days, at which point they were in the late stage of activation. Rested γδ T cells represented activated and proliferated cells cultured in the absence of IL-2 for an additional 24 h. The results showed that miR-34a-5p expression was increased >30-fold in the late-activation stage compared with the non-activated stage. The expression levels of miR-22-3p and miR-9-5p were increased approximately 10-fold in the early-activation stage (Figure 3a), whereas the expression levels of miR-450a-5p, miR-99a-5p, miR-125b-5p and miR-365a-5p were decreased more than twofold in this stage compared with those in the non-activated stage. In addition, the expression of miR-99a-5p, miR-150-5p, miR-125b-5p and miR-22-5p was significantly decreased in the late stage of activation (Figure 3b). Interestingly, the expression levels of miR-125b-5p and miR-99a-5p were consistently decreased in both the early activation and late activation stages (Figure 3b).
Figure 3.
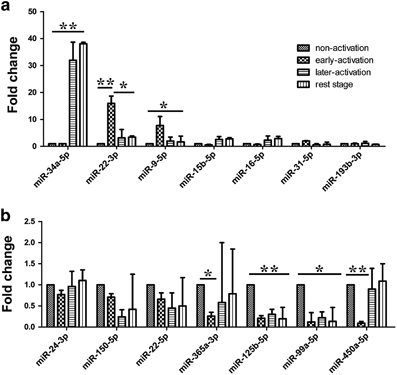
Expression levels of the differentially expressed miRNAs in different stages of γδ T cell activation. Expression levels of upregulated miRNAs (a) and downregulated miRNAs (b) in different stages of γδ T cell activation compared with those in the non-activated stage. Data are shown as the means±s.d. (n=4 independent experiments). The differences (paired Student’s t-tests) were significant (*P<0.05, ** P<0.01).
miR-125b-5p and miR-99a-5p were downregulated in response to γδ T-cell cytotoxicity
Unlike αβ T cells, γδ T cells can directly cytolyze MHC-defective tumor cells, such as Daudi cells.29 Thus, we examined the expression of the 14 identified differentially expressed miRNAs during γδ T-cell lysis of Daudi cells (Supplementary Table 5). To exclude nonspecific signals, we used another type of Burkitt's lymphoma cells, Raji cells, as a negative control, which are resistant to the cytolytic activity of γδ T cells (Supplementary Table 6).30 Because the lytic rate was greater than 80% at an E:T ratio of 1:1 after 4 h of incubation, we set 2 h as the early cytolysis point and 4 h as the late cytolysis point. To exclude individual differences, we performed the experiments with γδ T cells sorted by MACS from three healthy donors. The results showed that the expression levels of most miRNAs were variable during the γδ T cell-mediated cytolysis of Daudi cells (Figure 4). However, the expression levels of miR-125b-5p and miR-99a-5p were consistently reduced.
Figure 4.
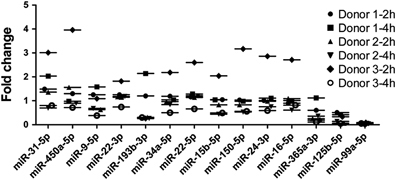
Expression levels of the identified miRNAs in γδ T cells co-cultured with Daudi or Raji cells. After co-culturing γδ T cells with Daudi or Raji cells for 2 and 4 h, the expression levels of the miRNAs were measured by real-time PCR. To exclude nonspecific signals, the miRNA expression levels in γδ T cells co-cultured with Daudi cells were subtracted from those of γδ T cells co-cultured with Raji cells.miR-99a-5p and miR-125b-5p showed the most obvious reduction and displayed good consistency.
Overexpression of miR-125b-5p and miR-99a-5p mimics induce γδ T cell apoptosis
Next, we sought to examine the effects of miR-125b-5p and miR-99a-5p overexpression and knockdown on activated γδ T cells. miR-125b-5p and miR-99a-5p mimics or inhibitors were transfected into γδ T cells by electroporation. Real-time PCR confirmed the expression of miR-125b-5p and miR-99a-5p (Figure 5a). We found that the γδ T-cell density and number of colonies were significantly reduced after they were electroporated with either the miR-125b-5p mimic or the miR-99a-5p mimic, whereas the miR-125b-5p and miR-99a-5p inhibitors dramatically increased the number of γδ T-cell colonies. To rule out the effects of electroporation, we removed the dead cells with the Dead Cell Removal Kit and counted the living cells at 24, 48 and 72 h after electroporation with the miR125b-5p and miR-99a-5p mimics and inhibitors, and we achieved comparable results (Figures 5b and c). Additionally, we confirmed that the mimic negative control and inhibitor negative control consistently showed similar results for γδ T-cell apoptosis (Supplementary Figure 3A). Therefore, we applied the inhibitor negative controls in all related experiments.
Figure 5.
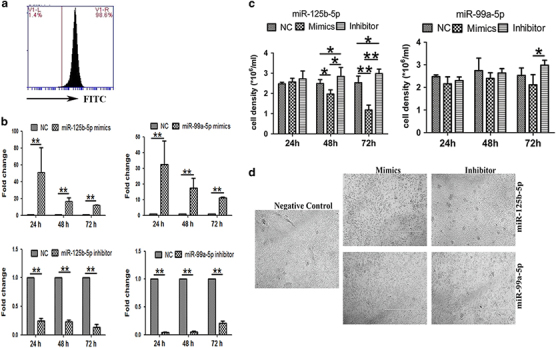
γδ T-cell numbers after miR-125b-5p and miR-99a-5p overexpression and knockdown. (a) Detection of the transfection efficiency of electroporation by FITC-labeled transfection control. (b) Real-time RT PCR analysis of the transcriptional expression of miRNAs in γδ T cells transfected with miR-125b-5p and miR-99a-5p mimics or inhibitors or a negative control (NC) via electroporation. (c) Cell density analysis of living γδ T cells after removing the dead cells with the Dead Cell Removal Kit at 24, 48 and 72 h after being transfection with miR-125b-5p and miR-99a-5p mimics or inhibitors. (d) Representative images of γδ T cells at 72 h after electroporation with miR-125b-5p and miR-99a-5p mimics, inhibitors and the NC. Scale bar: 1 mm. Data are shown as the means±s.d. (n=4 independent experiments). The differences (paired Student’s t-test) were significant (*P<0.05, **P<0.01).
Then, we examined whether the miR125b-5p and miR-99a-5p mimics and inhibitors affected the proliferative activity of γδ T cells with CFSE and CCK-8, but no significant differences were observed (Figure 6a), indicating that miR125b-5p and miR-99a-5p mimics and inhibitors did not affect the proliferative activity of γδ T cells. Next, we examined whether miR125b-5p and miR-99a-5p mimics caused γδ T-cell apoptosis. We found that overexpression of the miR-125b-5p and miR-99a-5p mimics resulted in an increased number of Annexin V+ γδ T cells (Figures 6b and c). We then detected activated caspase 3 (Supplementary Figure 4a) and applied the TUNEL assay (Supplementary Figure 4b) to further evaluate apoptosis. Taken together, the results revealed that miR-125b-5p and miR-99a-5p overexpression enhanced the apoptosis of γδ T cells rather than affected their proliferation. Additionally, miR-125b-5p showed stronger effects than miR-99a-5p (Figure 6c).
Figure 6.
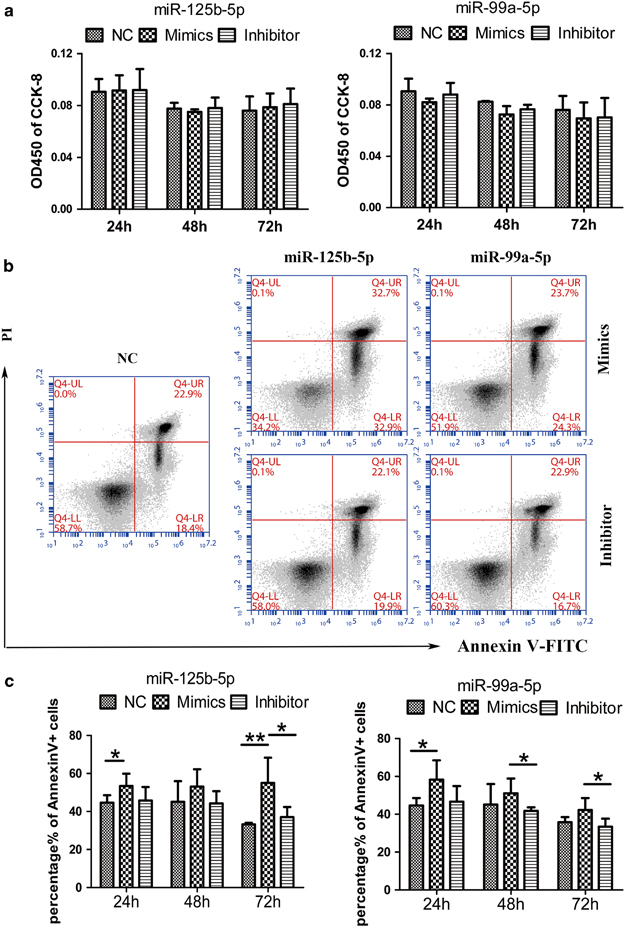
miR-125b-5p and miR-99a-5p overexpression promoted γδ T-cell apoptosis. (a) Proliferative activity analysis of γδ T cells cultured with CCK-8 in complete medium with IL-2 for 2 h at 24, 48 and 72 h after electroporation with miR125b-5p and miR-99a-5p mimics or inhibitors, or the NC. (b) Flow cytometry (FCM) Annexin V-FITC and PI analyses to detect γδ T-cell apoptosis at 48 h in complete medium with IL-2 after electroporation with the NC or the miR125b-5p and miR-99a-5p mimics or inhibitors. (c) Quantitative analysis of the percentages of Annexin V+ cells after electroporation with the miR125b-5p and miR-99a-5p mimics or inhibitors. Data are shown as the means±s.d. (n=5 independent experiments). The differences (paired Student’s t-test) were significant (*P<0.05, **P<0.01).
miR-125b-5p and miR-99a-5p overexpression inhibits γδ T-cell activation
We constructed a lentiviral vector (pCDH-CMV-MCS-EF1-copGFP) to increase the efficiency of miR-125b-5p and miR-99a-5p overexpression in freshly isolated PBMCs (Supplementary Figure 5). We then stimulated the PBMCs with an anti-pan γδTCR antibody and observed their activation. We found that lentiviral overexpression of miR-125b-5p and miR-99a-5p inhibited γδ T-cell activation induced by the anti-pan γδ TCR antibody (Figures 7a and b). The expression levels of the early activation markers CD25 and CD69, as well as those of the late activation marker MHC-II molecules, were significantly reduced in γδ T cells infected by lentivirus expressing miR-125b-5p or miR-99a-5p compared with the lentiviral controls (Figures 7c–e).
Figure 7.
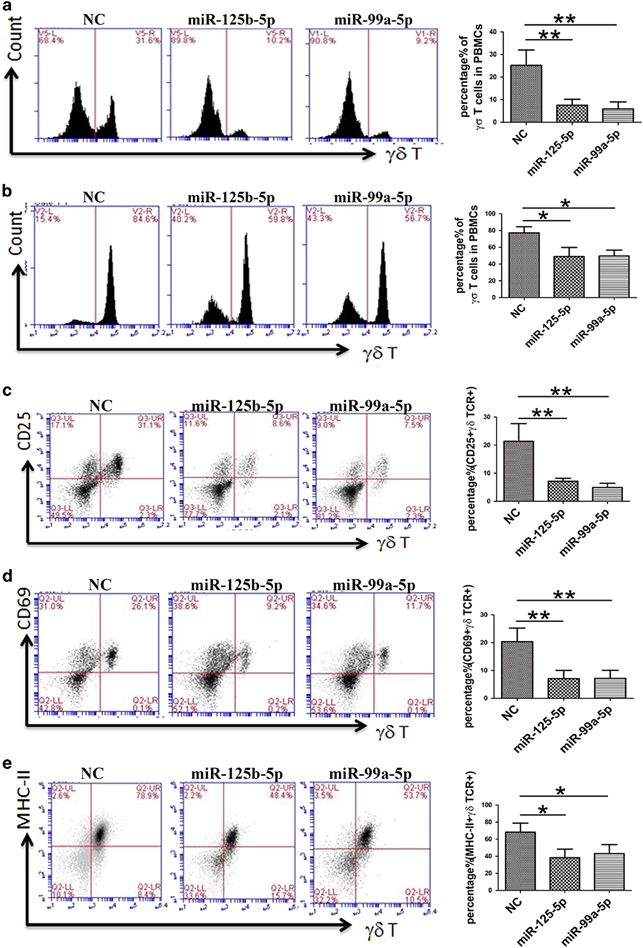
miR-125b-5p and miR-99a-5p overexpression inhibited γδ T-cell activation. PBMCs were isolated from peripheral blood and infected by lentivirus expressing miR-125b-5p and miR-99a-5p. On days 7 (a) and 9 (b) after being stimulated with an anti-pan γδ TCR antibody in complete medium with IL-2, γδ T-cell activation was suppressed. The percentage of γδ TCR+ cells was greatly reduced. Even after 14 days, the γδ T-cell ratio did not exceed 70%. Simultaneously, expression of the activation markers was downregulated. Flow cytometry (FCM) was used to examine the expression levels of CD25 (c) and CD69 (d) on day 5 and of MHC-II (e) on day 9. The image in the right column shows the quantitative results. Data are shown as the means±s.d. (n=4 independent experiments). The differences (paired Student’s t-test) were significant (**P<0.01).
miR-125b-5p and miR-99a-5p inhibitors promote γδ T-cell cytotoxicity to Daudi cells
Next, we examined whether the miR-125b-5p and miR-99a-5p mimics and inhibitors affected the cytotoxicity of γδ T cells. We found that overexpression of the miR-125b-5p and miR-99a-5p inhibitors strongly enhanced the cytotoxicity of γδ T cells to Daudi cells, whereas the opposite result was obtained for γδ T cells when the miR-125b-5p and miR-99a-5p mimics were overexpressed (Figures 8a and b). We further examined whether the miR-125b-5p and miR-99a-5p inhibitors could activate γδ T cells to kill Raji cells. However, the cytotoxicity of γδ T cells to Raji cells remained at <5%, even at an E:T ratio of 10:1 (Figure 8c and d and Supplementary Figure S3B).
Figure 8.
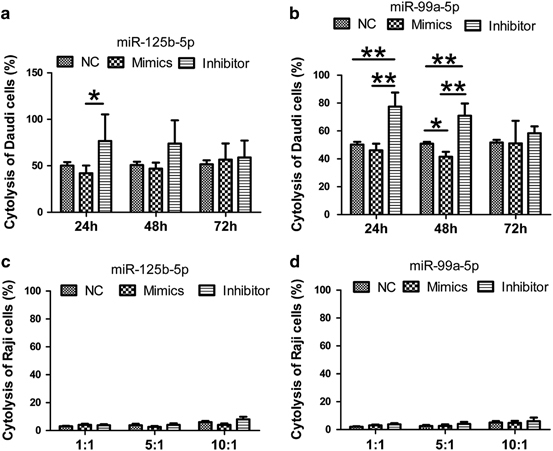
miR-125b-5p and miR-99a-5p regulate γδ T-cell cytotoxicity. (a and b) Analysis of γδ T-cell cytotoxicity to Daudi cells after removing dead cells with the Dead Cell Removal Kit at a ratio of 0.5:1 at 24, 48 and 72 h after electroporation with the NC or the miR125b-5p (a) and miR-99a-5p (b) mimics or inhibitors. The miR-125b-5p and miR-99a-5p inhibitors promoted the cytotoxicity of γδ T cells to Daudi cells. (c and d) Analysis of γδ T-cell cytotoxicity to Raji cells at an E:T ratio of 10:1 at 48 h after electroporation with the NC or the miR125b-5p (c) and miR-99a-5p (d) mimics or inhibitors. Data are shown as the means±s.d. (n=7 independent experiments). The differences (paired Student’s t-test) were significant (*P<0.05, **P<0.01).
miR-125b-5p and miR-99a-5p regulate γδ T cell cytotoxicity by decreasing degranulation and inhibit the secretion of IFN-γ and TNF-α
Next, we attempted to explore the mechanism underlying the regulatory function of miR-125b-5p and miR-99a-5p in the cytotoxicity of γδ T cells. We detected the cytotoxicity-related factors CD107a (lysosomal-associated membrane protein 1, LAMP-1), granzyme B and perforin in γδ T cells (Figure 9) during exposure of to Daudi cells to cytotoxic of γδ T cells. As expected, we observed a significant increase in CD107a expression in γδ T cells after inhibition of miR-125b-5p or miR-99a-5p, even though miR-125b-5p was more statistically significant than miR-99a-5p. However, no significant changes were observed in granzyme B and perforin expression. We subsequently detected the secretion of IFN-γ and TNF-α in the culture supernatant after γδ T cells were co-cultured with Daudi cells. The results showed that overexpression of miR-125b-5p significantly reduced the secretion of IFN-γ after the γδ T cells were co-cultured with Daudi cells for 48 h. In contrast, inhibition of miR-125b-5p expression enhanced the secretion of IFN-γ and TNF-α after γδ T cells were co-cultured with Daudi cells for 48 or 72 h (Figure 10). Interestingly, miR-99a-5p had no effect on the expression of CD107a, granzyme B and perforin in γδ T cells. Taken together, these results suggest that miR-125b-5p regulates the cytotoxicity of γδ T cells by targeting degranulation and the expression of IFN-γ and TNF-α.
Figure 9.
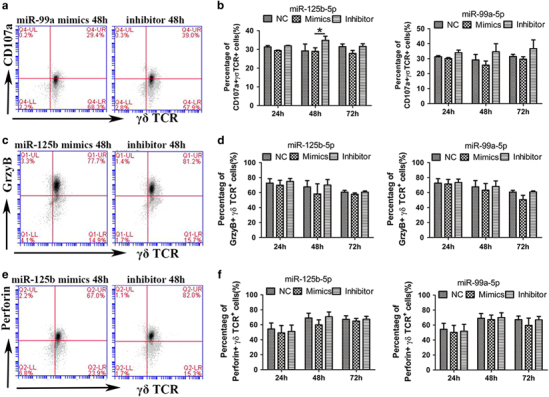
miR-125b-5p and miR-99a-5p regulate the expression of CD107a, but not granzyme B and perforin. The expression levels of CD107a (a and b), granzyme B (c and d) and perforin (e and f) in γδ T cells after co-culturing for 4 h with Daudi cells were measured by flow cytometry (FCM). The cytotoxicity experiments were performed at 24, 48 and 72 h after γδ T cells were electroporated with the NC or microRNAs mimics or inhibitors. A (CD107a), C (granzyme B) and E (perforin) show the FCM analysis of γδ T cells at 48 h in complete medium (with IL-2) after electroporation with miR125b-5p or miR-99a-5p mimics or inhibitors. Data are shown as the means±s.d. (n=3 independent experiments). The differences (paired Student’s t-test) were significant (*P<0.05).
Figure 10.
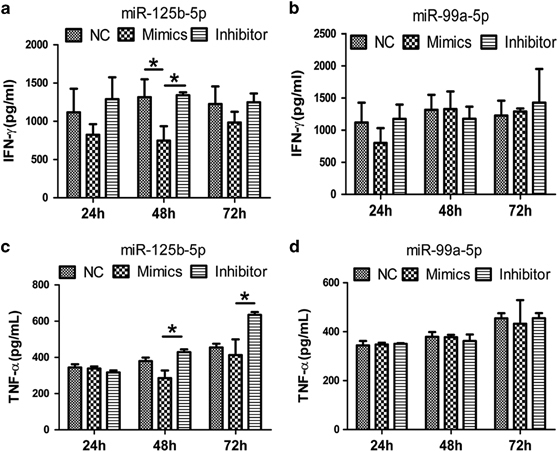
miR-125b-5p, but not miR-99a-5p, regulates the secretion of IFN-γ and TNF-α in γδ T cells during cytotoxicity. (a and b) ELISA was performed to analyze the expression of IFN-γ (a and b) and TNF-α (c and d) in γδ T cells during the killing of Daudi cells at 24, 48 and 72 h after electroporation with the NC, miR125b-5p or miR-99a-5p mimics or inhibitors. Data are shown as the means±s.d. (n=3 independent experiments). *P<0.05, by paired Student’s t-test.
Discussion
In this study, we characterized the miRNA profiles of human peripheral blood γδ T cells and αβ T cells. We discovered that two miRNAs, miR-125b-5p and miR-99a-5p, are differentially expressed between γδ T cells and αβ T cells. We found that miR-125b-5p and miR-99a-5p play crucial roles in regulating the activation and cytotoxicity of γδ T cells.
miR-125b-5p has demonstrated a variety of functions in hematopoietic stem cells (HSCs), B cells, CD4+ T cells and macrophages as a ‘star molecule.’ miR-125b-5p is highly expressed in HSCs and promotes HSC self-renewal.31 The expression of miR-125b-5p has been shown to gradually decrease as HSCs differentiate into a variety of precursor cells.20,32 miR-125b-5p has been shown to be highly expressed in naive CD4+ T cells, but its expression decreases as CD4+ T cells differentiate into effector T cells. Further studies have demonstrated that miR-125b-5p can inhibit CD4+ T cell differentiation and maintain T cells in their naive state by targeting IFN-γ, IL-2 Rβ, IL-10 Rα, PRDM1 (PR domain containing 1 with the ZNF Domain) and other genes.21 The study regarding the inhibition of B-cell activation by miR-125b-5p is more comprehensive. Previous studies have demonstrated that miR-125b-5p can inhibit pro-B cell differentiation by common lymphoid progenitors (CLPs). It can also block the differentiation of pre-B I cells into B cells by inhibiting the immunoglobulin heavy chain transcription activator Bright/Arid3a.33 miR-125b-5p has also been shown to prevent B-cell differentiation in the germinal center by inhibiting transcription factor B lymphocyte-induced maturation protein-1 (BLIMP-1) and IFN regulatory protein-4 (IRF-4).34 However, miR-125b-5p has also been reported to promote macrophage activation. When miR-125b-5p is overexpressed, macrophages express more co-stimulatory molecules and display activated functions.35
miR-99a-5p is similar to miR-125b-5p in that it is highly expressed in HSCs, and its expression is decreased after HSCs differentiate into progenitor cells. Simultaneously, miR-99a-5p has been reported to inhibit cell proliferation and differentiation in other somatic cells, such as keratinocytes,36 mesenchymal cells 37 and cardiomyocytes.38 Collectively, these findings suggest that miR-125b-5p and miR-99a-5p serve as negative regulators in the activation of γδ T cells. To verify this conclusion, we further overexpressed miR-125b-5p and miR-99a-5p in PBMCs by lentiviral infection and found that the activation of γδ T cells was inhibited and the effect of miR-99a-5p was more obvious in the early stage, which is consistent with previous screening data.
miR-99a-5p has been reported to have many roles in cell proliferation and apoptosis. It can inhibit cell growth and promote apoptosis via two pathways.39,40 First, it can target chromatin remodeling elements, such as the SWI/SNF-related, matrix-associated, actin-dependent regulator of chromatin subfamily a member 5 (SMARCA5) and the SWI/SNF-related, matrix-associated, actin-dependent regulator of chromatin subfamily D member 1 (SMARCD1). Second, miR-99a-5p can target growth-regulating kinases, such as mammalian target of rapamycin (mTOR), insulin-like growth factor 1 receptor (IGF-1R) and fibroblast growth factor receptor 3 (FGFR3). miR-99a-5p can also reduce the ability of DNA to repair damage.41,42
miR-125b-5p has also been reported to regulate cell proliferation and apoptosis. For example, in hepatoma cells, miR-125b-5p can inhibit cell proliferation and promote apoptosis by targeting the anti-apoptotic protein gene BCL-2 and the proto-oncogene LIN28B.43,44 In osteosarcoma, miR-125b-5p can downregulate the signal transducer and activator of transcription 3 (STAT3) gene and subsequently inhibit cell proliferation and migration.45 However, in a few cell types, such as human and mouse megakaryocytic progenitors (MPs) and megakaryocytes/erythrocytes (MEPs), miR-125b-5p can promote cell proliferation and self-renewal.46 Predictive analysis of the target genes of miR-125b-5p has identified thousands of candidate genes. Among these candidates, hundreds of genes have been verified, including the p53 gene 47 as the central regulator of apoptosis and proliferation, its functionally opposite gene Bcl-2, and the antagonistic BCL2-antagonist/killer 1 (Bak1) gene.48 Therefore, miR-125b-5p regulation depends on the cell type and stimulatory conditions. By targeting p53, miR-125b-5p can regulate either apoptosis or proliferation. Conversely, miR-125b-5p can also directly regulate the apoptosis regulators and cell cycle regulators of the p53 pathway, such as Igfbp3, Itch, Puma, Prkra, Tp53inp1, Tp53, Zac1 and cyclin C, Cdc25c, Cdkn2c, Edn1, Ppp1ca and Sel1 l, which, respectively, play roles in regulating apoptosis and proliferation.47 In this study, we observed that miR-125b-5p and miR-99a-5p overexpression resulted in more γδ T-cell death due to an increased number of apoptotic cells. Therefore, miR-125b-5p and miR-99a-5p may also play pro-apoptotic roles in γδ T cells, which is consistent with results reported in other cell lines.
The regulatory role of miRNAs in the killing of tumor cells with γδ T cells has not yet been reported. The expression of miR-125b-5p and miR-99a-5p decreased following the lysis of Daudi cells by γδ T cells lysed; thus, reducing their expression could significantly improve the cytotoxicity of γδ T cells. Overexpression of miR-125b-5p and miR-99a-5p reduced γδ T-cell cytotoxicity, although the difference was weak. Cytotoxic T lymphocytes (CTLs) can specifically kill target cells through perforin-granzymes, Fas/FasL, IFN-γ secretion and TNF-related apoptosis, inducing the ligand receptor (TRAILR) under MHC-restricted conditions. Our previous work demonstrated that γδ T cells kill tumor cells mainly through the perforin-granzyme pathway; the killing effects of TNF-α and IFN-γ secreted from γδ T cells were weak.23 Therefore, we examined the effects of miR-125b-5p and miR-99a-5p on the expression levels of CD107a, granzyme B and perforin in γδ T cells during cytotoxicity. However, these two microRNAs only affected the expression of CD107a and degranulation, but not the expression levels of granzyme B and perforin. Previous studies have reported that miR-125b-5p can bind to the 3′ UTR region of TNF-α and IFN-γ mRNA and directly inhibit their transcription.21,49 In the present study, we found that miR-125b-5p could regulate the secretion of IFN-γ and TNF-α during the cytotoxic effects of γδ T cells on Daudi cells. Paradoxically, we observed that the cytotoxicity was more susceptible to the influence of miR-99a-5p, while the changes in CD107a, TNF-α and IFN-γ were susceptible to miR-125b-5p. Thus, factors other than miR-99a-5p must be involved in regulating the cytotoxicity of γδ T cells. Thus, determining the mechanisms by which miR-125b-5p and miR-99a-5p affect the cytotoxicity of γδ T cells to tumor cells is crucial. In our future studies, we will initially use bioinformatics to predict possible target genes associated with cytotoxicity and then confirm the results using a luciferase reporter assay and ‘loss of function’ and ‘gain of function’ experiments.
We further found that miR-125b-5p and miR-99a-5p were simultaneously altered during γδ T cell activation and cytotoxicity. Because miR-125b and miR-99a are both located on chromosome 21 at q21.1, their changes are often consistent,50 and they are therefore usually classified as a gene cluster in the miRbase 18 database. However, later experiments have shown that these two miRNAs are driven by different transcriptional promoters. miR-99a has been confirmed to be in the hsa-let-7c-mir-99a cluster with hsa-let-7c.31 Several questions remain to be addressed in depth regarding miR-125b and miR-99a, such as their relationship as regulators and whether they are involved in regulating the same signaling pathways. Additionally, additional studies are needed to determine whether these two miRNAs affect different target genes, which may have synergistic effects on the same biological events.
In the present study, the miRNA expression profiles of γδ T cells and αβ T cells were analyzed, and 14 differentially expressed miRNAs were identified. Further studies of these miRNAs confirmed that miR-125b-5p and miR-99a-5p promoted γδ T cell apoptosis and inhibited γδ T-cell activation and cytotoxicity to tumor cells. These results suggest that downregulating the expression of miR-125b-5p and miR-99a-5p in vitro may improve the viability of γδ T cells while enhancing their cytotoxicity. Enhancing the quantity and quality of γδ T cells will be very favorable for their use in further adoptive immunotherapy strategies.51
Electronic supplementary material
Acknowledgements
This work was supported by the National Natural Science Foundation of China (31500725, 81673010, 91542117, 81471574 and 31471016), CAMS Central Public Welfare Scientific Research Institute Basal Research Expenses (2016ZX310180-5 and 2017PT31004), the CAMS Initiative for Innovative Medicine (2016-I2M-1-008), the National Key Research and Development Program of China (2016YFA0101001 and 2016YFC0903900), Peking Union Medical College Foundation (No. 3332015111), and Peking Union Medical College Science Foundation for Young Scientists (No. 3332015109). The funders had no role in the study design, data collection and analysis, decision to publish, or preparation of the manuscript. We thank Dr Austin Cape at ASJ Editors for the editing and comments.
Conflict of interest
The authors declare no conflict of interest.
Contributor Information
Jianmin Zhang, Email: jzhang42@163.com.
Wei He, Email: heweingd@126.com.
Electronic supplementary material
Supplementary Information for this article can be found on the Cellular & Molecular Immunology website 10.1038/cmi.2017.164
References
- 1.Girardi M. Immunosurveillance and immunoregulation by gammadelta T cells. J Invest Dermatol. 2006;126:25–31. doi: 10.1038/sj.jid.5700003. [DOI] [PubMed] [Google Scholar]
- 2.Cao W, He W. The recognition pattern of gammadelta T cells. Front Biosci. 2005;10:2676–2700. doi: 10.2741/1729. [DOI] [PubMed] [Google Scholar]
- 3.Wiest DL. Development of gammadelta T Cells, the Special-Force Soldiers of the Immune System. Methods Mol Biol. 2016;1323:23–32. doi: 10.1007/978-1-4939-2809-5_2. [DOI] [PubMed] [Google Scholar]
- 4.Chen H, He W. Human regulatory γδT cells and their functional plasticity in the tumor microenvironment. Cell Mol Immunol, e-pub ahead of print 28 August 2017 doi:10.1038/cmi.2017.73. [DOI] [PMC free article] [PubMed]
- 5.Mao Y, Yin S, Zhang J, Hu Y, Huang B, Cui L, et al. A new effect of IL-4 on human γδ T cells: promoting regulatory Vδ1 T cells via IL-10 production and inhibiting function of Vδ2 T cells. Cell Mol Immunol. 2016;13:217–228. doi: 10.1038/cmi.2015.07. [DOI] [PMC free article] [PubMed] [Google Scholar]
- 6.Kabelitz D, Glatzel A, Wesch D. Antigen recognition by human gammadelta T lymphocytes. Int Arch Allergy Imm. 2000;122:1–7. doi: 10.1159/000024353. [DOI] [PubMed] [Google Scholar]
- 7.Sireci G, Espinosa E, Di Sano C, Dieli F, Fournié JJ, Salerno A, et al. Differential activation of human gammadelta cells by nonpeptide phosphoantigens. Eur. J. Immunol. 2001;31:1628–1635. doi: 10.1002/1521-4141(200105)31:5<1628::AID-IMMU1628>3.0.CO;2-T. [DOI] [PubMed] [Google Scholar]
- 8.Beetz S, Wesch D, Marischen L, Welte S, Oberg HH, Kabelitz D, et al. Innate immune functions of human gammadelta T cells. Immunobiology. 2008;213:173–182. doi: 10.1016/j.imbio.2007.10.006. [DOI] [PubMed] [Google Scholar]
- 9.Kobayashi H, Tanaka Y, Yagi J, Osaka Y, Nakazawa H, Uchiyama T, et al. Safety profile and anti-tumor effects of adoptive immunotherapy using gamma-delta T cells against advanced renal cell carcinoma: a pilot study. Cancer Immunol Immunother. 2007;56:469–476. doi: 10.1007/s00262-006-0199-6. [DOI] [PMC free article] [PubMed] [Google Scholar]
- 10.Brandes M, Willimann K, Moser B. Professional antigen-presentation function by human gammadelta T Cells. Science (New York, N.Y.) 2005;309:264–268. doi: 10.1126/science.1110267. [DOI] [PubMed] [Google Scholar]
- 11.Zhu Y, Wang H, Xu Y, Hu Y, Chen H, Cui L, et al. Human gammadelta T cells augment antigen presentation in Listeria Monocytogenes infection. Mol Med. 2016;22:737–746. doi: 10.2119/molmed.2015.00214. [DOI] [PMC free article] [PubMed] [Google Scholar]
- 12.Ambros V. The functions of animal microRNAs. Nature. 2004;431:350–355. doi: 10.1038/nature02871. [DOI] [PubMed] [Google Scholar]
- 13.Huang Y, Shen X, Zou Q, Wang S, Tang S, Zhang G. Biological functions of microRNAs: a review. J Physiol Biochem. 2010;67:129–139. doi: 10.1007/s13105-010-0050-6. [DOI] [PubMed] [Google Scholar]
- 14.O'Connell RM, Rao DS, Chaudhuri AA, Baltimore D. Physiological and pathological roles for microRNAs in the immune system. Nat Rev Immunol. 2010;10:111–122. doi: 10.1038/nri2708. [DOI] [PubMed] [Google Scholar]
- 15.Xiao C, Calado DP, Galler G, Thai TH, Patterson HC, Wang J, et al. MiR-150 controls B cell differentiation by targeting the transcription factor c-Myb. Cell. 2007;131:146–159. doi: 10.1016/j.cell.2007.07.021. [DOI] [PubMed] [Google Scholar]
- 16.Li Q, Chau J, Ebert PJ, Sylvester G, Min H, Liu G, et al. miR-181a is an intrinsic modulator of T cell sensitivity and selection. Cell. 2007;129:147–161. doi: 10.1016/j.cell.2007.03.008. [DOI] [PubMed] [Google Scholar]
- 17.Rodriguez A, Vigorito E, Clare S, Warren MV, Couttet P, Soond DR, et al. Requirement of bic/microRNA-155 for normal immune function. Science. 2007;316:608–611. doi: 10.1126/science.1139253. [DOI] [PMC free article] [PubMed] [Google Scholar]
- 18.Malumbres R, Sarosiek KA, Cubedo E, Ruiz JW, Jiang X, Gascoyne RD, et al. Differentiation stage-specific expression of microRNAs in B lymphocytes and diffuse large B-cell lymphomas. Blood. 2009;113:3754–3764. doi: 10.1182/blood-2008-10-184077. [DOI] [PMC free article] [PubMed] [Google Scholar]
- 19.Bousquet M, Harris MH, Zhou B, Lodish HF. MicroRNA miR-125b causes leukemia. Proc Natl Acad Sci USA. 2010;107:21558–21563. doi: 10.1073/pnas.1016611107. [DOI] [PMC free article] [PubMed] [Google Scholar]
- 20.Ooi AG, Sahoo D, Adorno M, Wang Y, Weissman IL, Park CY. MicroRNA-125b expands hematopoietic stem cells and enriches for the lymphoid-balanced and lymphoid-biased subsets. Proc Natl Acad Sci USA. 2010;107:21505–21510. doi: 10.1073/pnas.1016218107. [DOI] [PMC free article] [PubMed] [Google Scholar]
- 21.Rossi RL, Rossetti G, Wenandy L, Curti S, Ripamonti A, Bonnal RJ et al. Distinct microRNA signatures in human lymphocyte subsets and enforcement of the naive state in CD4+ T cells by the microRNA miR-125b. Nat Immunol 2011; 12. [DOI] [PubMed]
- 22.Kang N, Zhou J, Zhang T, Wang L, Lu F, Cui Y, et al. Adoptive immunotherapy of lung cancer with immobilized anti-TCRgammadelta antibody-expanded human gammadelta T-cells in peripheral blood. Cancer Biol Ther. 2009;8:1540–1549. doi: 10.4161/cbt.8.16.8950. [DOI] [PubMed] [Google Scholar]
- 23.Yin S, Zhang J, Mao Y, Hu Y, Cui L, Kang N, et al. Vav1-phospholipase C-gamma1 (Vav1-PLC-gamma1) pathway initiated by T cell antigen receptor (TCRgammadelta) activation is required to overcome inhibition by ubiquitin ligase Cbl-b during gammadeltaT cell cytotoxicity. J Biol Chem. 2013;288:26448–26462. doi: 10.1074/jbc.M113.484600. [DOI] [PMC free article] [PubMed] [Google Scholar]
- 24.Xiao B, Wang Y, Li W, Baker M, Guo J, Corbet K, et al. Plasma microRNA signature as a noninvasive biomarker for acute graft-versus-host disease. Blood. 2013;122:3365–3375. doi: 10.1182/blood-2013-06-510586. [DOI] [PMC free article] [PubMed] [Google Scholar]
- 25.Dai Y, Chen H, Mo C, Cui L, He W. Ectopically expressed human tumor biomarker MutS homologue 2 is a novel endogenous ligand that is recognized by human gammadelta T cells to induce innate anti-tumor/virus immunity. J Biol Chem. 2012;287:16812–16819. doi: 10.1074/jbc.M111.327650. [DOI] [PMC free article] [PubMed] [Google Scholar]
- 26.Zhou J, Kang N, Cui L, Ba D, He W. Anti-gammadelta TCR antibody-expanded gammadelta T cells: a better choice for the adoptive immunotherapy of lymphoid malignancies. Cell Mol Immunol. 2012;9:34–44. doi: 10.1038/cmi.2011.16. [DOI] [PMC free article] [PubMed] [Google Scholar]
- 27.Tanaka H, Kono E, Tran CP, Miyazaki H, Yamashiro J, Shimomura T, et al. Monoclonal antibody targeting of N-cadherin inhibits prostate cancer growth, metastasis and castration resistance. Nat Med. 2010;16:1414–1420. doi: 10.1038/nm.2236. [DOI] [PMC free article] [PubMed] [Google Scholar]
- 28.Hua F, Kang N, Gao Y, Cui L, Ba D, He W, et al. Potential regulatory role of in vitro-expanded Vdelta1 T cells from human peripheral blood. Immunolo Res. 2013;56:172–180. doi: 10.1007/s12026-013-8390-2. [DOI] [PubMed] [Google Scholar]
- 29.Rothenfusser S, Buchwald A, Kock S, Ferrone S, Fisch P. Missing HLA class I expression on Daudi cells unveils cytotoxic and proliferative responses of human gammadelta T lymphocytes. Cell Immunol. 2002;215:32–44. doi: 10.1016/S0008-8749(02)00001-1. [DOI] [PubMed] [Google Scholar]
- 30.Schilbach KE, Geiselhart A, Wessels JT, Niethammer D, Handgretinger R. Human gammadelta T lymphocytes exert natural and IL-2-induced cytotoxicity to neuroblastoma cells. J Immunother. 2000;23:536–548. doi: 10.1097/00002371-200009000-00004. [DOI] [PubMed] [Google Scholar]
- 31.So A, Zhao J, Baltimore D. The Yin and Yang of microRNAs: leukemia and immunity. Immunol Rev. 2013;253:129–145. doi: 10.1111/imr.12043. [DOI] [PMC free article] [PubMed] [Google Scholar]
- 32.O'Connell RM, Chaudhuri AA, Rao DS, Gibson WS, Balazs AB, Baltimore D. MicroRNAs enriched in hematopoietic stem cells differentially regulate long-term hematopoietic output. Proc Natl Acad Sci USA. 2010;107:14235–14240. doi: 10.1073/pnas.1009798107. [DOI] [PMC free article] [PubMed] [Google Scholar]
- 33.Puissegur MP, Eichner R, Quelen C, Coyaud E, Mari B, Lebrigand K, et al. B-cell regulator of immunoglobulin heavy-chain transcription (Bright)/ARID3a is a direct target of the oncomir microRNA-125b in progenitor B-cells. Leukemia. 2012;26:2224–2232. doi: 10.1038/leu.2012.95. [DOI] [PubMed] [Google Scholar]
- 34.Gururajan M, Haga CL, Das S, Leu CM, Hodson D, Josson S, et al. MicroRNA 125b inhibition of B cell differentiation in germinal centers. Int Immunol. 2010;22:583–592. doi: 10.1093/intimm/dxq042. [DOI] [PMC free article] [PubMed] [Google Scholar]
- 35.Chaudhuri AA, So AY, Sinha N, Gibson WS, Taganov KD, O'Connell RM, et al. MicroRNA-125b potentiates macrophage activation. J Immunol. 2011;187:5062–5068. doi: 10.4049/jimmunol.1102001. [DOI] [PMC free article] [PubMed] [Google Scholar]
- 36.Lerman G, Avivi C, Mardoukh C, Barzilai A, Tessone A, Gradus B, et al. MiRNA expression in psoriatic skin: reciprocal regulation of hsa-miR-99a and IGF-1R. PLoS ONE. 2011;6:e20916. doi: 10.1371/journal.pone.0020916. [DOI] [PMC free article] [PubMed] [Google Scholar]
- 37.Vimalraj S, Selvamurugan N. MicroRNAs expression and their regulatory networks during mesenchymal stem cells differentiation toward osteoblasts. Int J Biol Macromol. 2014;66:194–202. doi: 10.1016/j.ijbiomac.2014.02.030. [DOI] [PubMed] [Google Scholar]
- 38.Coppola A, Romito A, Borel C, Gehrig C, Gagnebin M, Falconnet E, et al. Cardiomyogenesis is controlled by the miR-99a/let-7c cluster and epigenetic modifications. Stem Cell Res. 2014;12:323–337. doi: 10.1016/j.scr.2013.11.008. [DOI] [PubMed] [Google Scholar]
- 39.Sun J, Chen Z, Tan X, Zhou F, Tan F, Gao Y, et al. MicroRNA-99a/100 promotes apoptosis by targeting mTOR in human esophageal squamous cell carcinoma. Med Oncol. 2013;30:411. doi: 10.1007/s12032-012-0411-9. [DOI] [PubMed] [Google Scholar]
- 40.Li X, Luo X, Han B, Duan F, Wei P, Chen Y. MicroRNA-100/99a, deregulated in acute lymphoblastic leukaemia, suppress proliferation and promote apoptosis by regulating the FKBP51 and IGF1R/mTOR signalling pathways. Br J Cancer. 2013;109:2189–2198. doi: 10.1038/bjc.2013.562. [DOI] [PMC free article] [PubMed] [Google Scholar]
- 41.Mueller AC, Sun D, Dutta A. The miR-99 family regulates the DNA damage response through its target SNF2H. Oncogene. 2013;32:1164–1172. doi: 10.1038/onc.2012.131. [DOI] [PMC free article] [PubMed] [Google Scholar]
- 42.Rane JK, Erb HH, Nappo G, Mann VM, Simms MS, Collins AT, et al. Inhibition of the glucocorticoid receptor results in an enhanced miR-99a/100-mediated radiation response in stem-like cells from human prostate cancers. Oncotarget. 2016;7:51965–51980. doi: 10.18632/oncotarget.10207. [DOI] [PMC free article] [PubMed] [Google Scholar]
- 43.Liang L, Wong CM, Ying Q, Fan DN, Huang S, Ding J, et al. MicroRNA-125b suppressesed human liver cancer cell proliferation and metastasis by directly targeting oncogene LIN28B2. Hepatology. 2010;52:1731–1740. doi: 10.1002/hep.23904. [DOI] [PubMed] [Google Scholar]
- 44.Gong J, Zhang JP, Li B, Zeng C, You K, Chen M, et al. MicroRNA-125b promotes apoptosis by regulating the expression of Mcl-1, Bcl-w and IL-6R. Oncogene. 2013;32:3071–3079. doi: 10.1038/onc.2012.318. [DOI] [PubMed] [Google Scholar]
- 45.Liu L, Li H, Li JP, Zhong H, Zhang H, Chen J, et al. miR-125b suppresses the proliferation and migration of osteosarcoma cells through down-regulation of STAT3. Biochem Biophys Res Commun. 2011;416:31–38. doi: 10.1016/j.bbrc.2011.10.117. [DOI] [PubMed] [Google Scholar]
- 46.Klusmann JH, Li Z, Böhmer K, Maroz A, Koch ML, Emmrich S, et al. miR-125b-2 is a potential oncomiR on human chromosome 21 in megakaryoblastic leukemia. Genes Dev. 2010;24:478–490. doi: 10.1101/gad.1856210. [DOI] [PMC free article] [PubMed] [Google Scholar]
- 47.Le M, Shyh-Chang N, Khaw SL, Chin L, Teh C, Tay J, et al. Conserved regulation of p53 network dosage by microRNA-125b occurs through evolving miRNA-target gene pairs. PLoS genetics. 2011;7:e1002242. doi: 10.1371/journal.pgen.1002242. [DOI] [PMC free article] [PubMed] [Google Scholar]
- 48.Li Q, Wu Y, Zhang Y, Sun H, Lu Z, Du K, et al. miR-125b regulates cell progression in chronic myeloid leukemia via targeting BAK1. Am J Transl Res. 2016;8:447–459. [PMC free article] [PubMed] [Google Scholar]
- 49.Tili E, Michaille JJ, Cimino A, Costinean S, Dumitru CD, Adair B, et al. Modulation of miR-155 and miR-125b levels following lipopolysaccharide/TNF-alpha stimulation and their possible roles in regulating the response to endotoxin shock. J Immunol. 2007;179:5082–5089. doi: 10.4049/jimmunol.179.8.5082. [DOI] [PubMed] [Google Scholar]
- 50.Lin K, Ye H, Han B, Wang W, Wei P, He B, et al. Genome-wide screen identified let-7c/miR-99a/miR-125b regulating tumor progression and stem-like properties in cholangiocarcinoma. Oncogene. 2016;35:3376–3386. doi: 10.1038/onc.2015.396. [DOI] [PMC free article] [PubMed] [Google Scholar]
- 51.Chen H, Z M, Teng D, Hu Y, Zhang J, He W. Profiling the pattern of the human T cell receptor γδ complementary determinant region 3 repertoire in patients with lung carcinoma via high-throughput sequencing analysis. Cell Mol Immunol 2018 in press. [DOI] [PMC free article] [PubMed]
Associated Data
This section collects any data citations, data availability statements, or supplementary materials included in this article.


