

FtsX is a ubiquitous bacterial integral membrane protein involved in cell division that regulates the activity of peptidoglycan (PG) hydrolases. FtsX is representative of a large group of ABC3 superfamily proteins that function as “mechanotransmitters,” proteins that relay signals from the inside to the outside of the cell. Here, we present a structural characterization of the large extracellular loop, ECL1, of FtsX from the opportunistic human pathogen S. pneumoniae. We show the molecular nature of the direct interaction between the peptidoglycan hydrolase PcsB and FtsX and demonstrate that this interaction is essential for cell viability. As such, FtsX represents an attractive, conserved target for the development of new classes of antibiotics.
KEYWORDS: NMR structure, Streptococcus pneumoniae, cell division, peptidoglycan hydrolases, protein-protein interactions
ABSTRACT
Streptococcus pneumoniae is a leading killer of infants and immunocompromised adults and has become increasingly resistant to major antibiotics. Therefore, the development of new antibiotic strategies is desperately needed. Targeting bacterial cell division is one such strategy, specifically by targeting proteins that are essential for the synthesis and breakdown of peptidoglycan. One complex important to this process is FtsEX. FtsEX comprises a cell division-regulating integral membrane protein (FtsX) and a cytoplasmic ATPase (FtsE) that resembles an ATP-binding cassette (ABC) transporter. Here, we present nuclear magnetic resonance (NMR) solution structural and crystallographic models of the large extracellular domain of FtsX, denoted extracellular loop 1 (ECL1). The structure of ECL1 reveals an upper extended β-hairpin and a lower α-helical lobe, each extending from a mixed α-β core. The helical lobe mediates a physical interaction with the peptidoglycan hydrolase PcsB via the coiled-coil domain of PcsB (PscBCC). Characterization of S. pneumoniae strain D39-derived strains harboring mutations in the α-helical lobe shows that this subdomain is essential for cell viability and required for proper cell division of S. pneumoniae.
INTRODUCTION
Streptococcus pneumoniae is a Gram-positive, opportunistic respiratory pathogen (1–3) that has acquired antibiotic resistance worldwide (4–6). This ovococcal bacterium relies on highly conserved cell wall machinery to divide and grow (7, 8). The cell wall is primarily composed of peptidoglycan (PG), a macromolecule composed of repeating subunits of N-acetylglucosamine and N-acetylmuramic acid linked by PG peptide side chains (9, 10). Regulation of the synthesis and remodeling of PG is essential for bacterial growth and viability, due to the turgor pressure bacterial cells must withstand (10–12). One vital process for the synthesis of PG is the controlled insertion of new strands of PG. This process requires timed cleavage of the old PG matrix to allow incorporation of new nascent strands (13). PG hydrolases are the primary enzymes that carry out PG cleavage and remodeling (14, 15). Thus, regulation of these hydrolases and activation at specific times during the cell cycle is required for proper cell growth. Specific protein complexes are utilized by bacterial cells to regulate these enzymes. This work focuses on understanding the structure and function of one of these protein complexes.
From Mycobacterium tuberculosis to Caulobacter crescentus, the ATP-binding cassette (ABC) transporter-like protein complex FtsEX acts as a key regulator of PG hydrolysis and divisome assembly (16–19). The proposed mechanism of FtsEX activation of PG hydrolases is as follows. FtsE, upon sensing an unknown signal from inside the cell, hydrolyzes ATP to ADP. Hydrolysis causes a conformational change that is transmitted through the membrane via FtsX, an integral membrane protein with two extracellular loops (ECLs), denoted the large (ECL1) and small (ECL2) loops. These extracellular loops interact with either cell wall hydrolases or effector proteins, which results in activation of PG hydrolysis via an unknown mechanism (16, 18, 20–25). In Escherichia coli, it has been demonstrated that FtsX interacts with the effector protein EnvC to activate the PG amidases AmiA and AmiB (24, 25). In addition, FtsX interacts with other division proteins, such as FtsA, where it regulates the polymerization of FtsA and recruitment of downstream division proteins (26). In other organisms, including Bacillus subtilis and M. tuberculosis, FtsEX also activates PG hydrolases (16, 23). Interestingly, FtsEX is nonessential in rod-shaped bacteria like E. coli and B. subtilis (23, 24, 26–28). However, in S. pneumoniae, FtsEX is absolutely essential (21) and depletion of FtsEX results in cell rounding and cessation of growth (20, 21).
In the case of S. pneumoniae, genetic experiments suggest that both outward-facing domains of FtsX, ECL1 and ECL2, interact with the essential PG hydrolase PcsB via its long coiled-coil (CC) domain (20, 21). However, there is little direct biochemical evidence for this interaction. ECL1 and ECL2 are thought to allosterically activate the catalytic activity of the cysteine, histidine-dependent amidohydrolase/peptidase (CHAP) domain of PcsB (20). The crystal structure of full-length PcsB, including the CC domain, an alanine-rich linker region, and the CHAP domain, provides insight into the mechanism of how this may occur (22). While the PcsB structure implies that FtsEX activates PcsB by displacing the catalytic domain from the CC domain, the exact nature of the FtsX-PcsB interaction remains unknown.
In order to understand how FtsX activates PcsB, we determined the structure of the large extracellular loop of FtsX (FtsXECL1) by both multidimensional nuclear magnetic resonance (NMR) spectroscopy and X-ray crystallography. FtsXECL1 harbors a conserved mixed α-β core and a lower α-helical lobe extending from the core, identified previously in M. tuberculosis FtsX (16), and S. pneumoniae FtsXECL1 has a unique extended β-hairpin. The N-terminal β1 and C-terminal β6 strands are adjacent in the core and connect ECL1 to the transmembrane 1 (TM1) and TM2 helices, respectively, in the membrane. PscBCC-mediated chemical shift perturbations of spectra obtained by 1H-15N heteronuclear single quantum coherence (HSQC) spectroscopy of FtsXECL1 reveal that the helical lobe consisting of the α2 helix and the α2-β5 linker (residues 107 to 134) of FtsXECL1 interacts with PscBCC. To determine if this interaction is required for FtsX function in bacterial cells, we constructed a merodiploid strain that allows for conditional expression of mutant ftsX. We demonstrate that specific amino acid substitutions in the FtsX-PcsB interface are lethal or cause pronounced morphological defects despite the fact that these FtsXECL1 mutant proteins are expressed at nearly wild-type levels. These findings support the model that a direct physical interaction between FtsX and PcsB is required for activation of PcsB PG hydrolytic activity.
RESULTS
The three-dimensional structure of FtsXECL1.
The three-dimensional structure of FtsXECL1 (residues 46 to 168) was solved by both NMR spectroscopy (Fig. 1A) and X-ray crystallography (Fig. 1B). The folded structure (residues 57 to 166) reveals a central core composed of a four-stranded antiparallel β-sheet (β1, β6, β4, and β5) and two helices (α1 and α3), an α-helical lobe (residues 107 to 135) harboring the α2 helix, and an extended β-hairpin (β2 and β3). The β-hairpin and helical lobes are connected to the central core by hinges. Details for structural determination of FtsXECL1 by NMR in the absence of detergent are presented in Materials and Methods, and structure statistics are summarized in Table 1. The solution structure shows that while the central mixed α-β core adopts a well-defined conformation, the two appended lobes are highly dynamic on multiple timescales (see below), presenting a range of conformations among the 20 members of the FtsXECL1 NMR structural ensemble (Fig. 1A).
FIG 1.

The structure of FtsXECL1 from Streptococcus pneumoniae. (A) Stereoview of the 20 conformers of the FtsXECL1 NMR structure as backbone traces, with helices shown in blue and β-strands shown in yellow. N and C termini of the domain are indicated by the residue numbers 57 and 166. (B) Cartoon representation of the FtsXECL1 structure obtained by X-ray crystallography (chain B in FtsXECL1-D1) in which the different secondary structure elements have been numbered and labeled. N and C termini of the domain are indicated by the residue numbers 49 and 166. β-HP, β-hairpin. (C) Stereoview showing changes in helical lobe upon interaction with dodecyltrimethylammonium chloride. Apo form (chain B) is colored in pale brown, and holo form (chain A) is colored in green. Relevant residues affected by the presence of the detergent are depicted as sticks. The polar interaction is represented by a dashed line. (D) Surface representation of the FtsXECL1 crystal structure in which the three different detergent molecules are superimposed and shown in sticks, as follows: dodecyltrimethylammonium chloride, n-undecyl-β-d-maltoside, and n-decyl-β-d-maltoside are colored in green, orange, and purple, respectively. (E) Overlay of the backbone traces for the six FtsXECL1 crystal structures (colored in green, orange, and purple in the presence of dodecyltrimethylammonium chloride, n-undecyl-β-d-maltoside, and n-decyl-β-d-maltoside, respectively) with the backbone traces of the 20 FtsXECL1 NMR conformers (in gray). (F) Cartoon representation of the FtsXECL1 crystallographic structure (in cyan) overlaid on the M. tuberculosis FtsXECD structure (in orange) (PDB code 4N8N). Cysteine residues involved in disulfide bond formation are shown as yellow sticks and indicated with an arrow. (G) Structure-based sequence alignment (54) of extracellular domains from S. pneumoniae (Spn ECL1) (PDB code 6HFX, chain A) and M. tuberculosis (Mtb ECD) (PDB code 4N8N, chain B). Secondary structure elements from each protein are indicated and numbered.
TABLE 1.
Structural statistics for NMR solution structure of FtsXECL1a
| Parameter | Value |
|---|---|
| NMR distance and angle restraints | |
| Total NOE-based distance constraints | 1,711 |
| Intraresidue (i = j) | 232 |
| Sequential (|i − j| = 1) | 499 |
| Medium range (1 < |i − j| < 5) | 365 |
| Long range (|i − j| ≥ 4) | 615 |
| Maximum distance violation (Å) | 0.49 |
| Dihedral angle restraints | 110 |
| Maximum dihedral angle violation (°) | 7 |
| Total number of RDCs used (measured) | 82 (112) |
| Q factor | 0.11 (0.39) |
| Correlation (experimental to calculated) | 0.99 (0.89) |
| RMS deviations from idealized covalent geometry | |
| Covalent bond lengths (Å) | 0.011 |
| Covalent angle values (°) | 1.3 |
| Ramachandran analysis (%)b ,c | |
| Most favored | 86.5 |
| Additionally allowed | 8.4 |
| Generously allowed | 1.8 |
| Disallowed | 3.3 |
| RMSD values (Å) | |
| Backbone atoms (all) | 1.5 |
| All heavy atoms (all) | 1.9 |
| Backbone atoms (coreb ) | 0.4 |
| All heavy atoms (coreb ) | 0.9 |
From the ensemble of the 20 best NMR structures. PDB code 6MK7; BMRB code 30523.
Calculated over the core of the structure, excluding the helical lobe and β-hairpin, residues 59 to 65, 89 to 108, and 134 to 165.
As computed by Procheck.
Three different structures, with resolutions ranging from 2.0 to 2.3 Å, were solved by X-ray crystallography, each in the presence of a different detergent. The detergents used were dodecyltrimethylammonium chloride (detergent 1 [D1]), n-undecyl-β-d-maltoside (detergent 2 [D2]), and n-decyl-β-d-maltoside (detergent 3 [D3]). The presence of detergents was critical, as in their absence, crystals diffracted at very low resolution (≤4 Å), suggesting significant mobility in some protein regions. Details from the crystallographic determination are provided in Materials and Methods, and structure statistics are summarized in Table 2. In all cases, two independent protein molecules are present in the asymmetric unit (Fig. S1 in the supplemental material), arranged in such a way as to keep hydrophobic residues from their α-helical lobes buried. As explained below, the α-helical-lobe region is relevant for PcsB interaction. In total, six independent structures were determined for both the protein structure and associated detergent molecules (Fig. S2). Different conformations were observed for the β-hairpin and the helical lobe among the six structures, depending on the presence and identity of the detergent molecule bound to FtsXECL1 (Fig. S1B). The structural variations observed in these crystallographic structures, however, are less dramatic than those observed in the NMR conformer bundle obtained in the absence of ligand (Fig. 1E). As expected, regions presenting structural variations in crystal structures correspond to those showing a highly dynamic behavior by NMR.
TABLE 2.
Crystallographic data collection and refinement statistics
| Parameter | Values fora
: |
||
|---|---|---|---|
| FtsXECL1-D1 | FtsXECL1-D2 | FtsXECL1-D3 | |
| Data collection statistics | |||
| Wavelength (Å) | 0.97934 | 0.97934 | 0.97934 |
| Space group | P 43 21 2 | P 43 21 2 | P 43 21 2 |
| Unit cell dimensions | |||
| a, b, c (Å) | 75.87, 75.87, 97.93 | 84.61, 84.61, 106.19 | 75.49, 75.49, 95.31 |
| α, β, γ (º) | 90, 90, 90 | 90, 90, 90 | 90, 90, 90 |
| Temp (K) | 100 | 100 | 100 |
| X-ray source | Synchrotron | Synchrotron | Synchrotron |
| Resolution range (Å) | 47.05–(2.05–2.0) | 44.97–(2.38–2.3) | 46.58–(2.23–2.16) |
| No. of unique reflections | 19,992 (1,436) | 17,781 (1,700) | 15,360 (1,496) |
| Completeness (%) | 100 (100) | 100 (100) | 99.85 (99.93) |
| Multiplicity | 24.4 (25.9) | 22.1 (22.5) | 16.6 (21.8) |
| Rpimb | 0.013 (0.535) | 0.007 (0.123) | 0.010 (0.241) |
| <I/σ(I)> | 21.9 (1.5) | 41.7 (4.6) | 24.6 (2.55) |
| CC1/2c | 1.00 (0.67) | 1.00 (0.98) | 1.00 (0.89) |
| Refinement statistics | |||
| Resolution range (Å) | 41.14–2.0 | 42.31–2.3 | 46.58–2.16 |
| Rwork/Rfreed | 0.24/0.28 | 0.26/0.30 | 0.25/0.31 |
| No. of atoms | |||
| Protein | 1,888 | 1,732 | 1,856 |
| Water | 25 | 21 | 23 |
| Ligand | 16 | 47 | 33 |
| RMS deviations | |||
| Bond length (Å) | 0.008 | 0.009 | 0.010 |
| Bond angles (°) | 1.27 | 1.22 | 1.29 |
| Ramachandran plot | |||
| Favored/outlier regions (%) | 95.65/0.43 | 93.20/2.43 | 92.41/0.00 |
| Monomers per AU | 2 | 2 | 2 |
| PDB code | 6HE6 | 6HEE | 6HFX |
Values between parentheses correspond to the highest-resolution shells.
Rpim measures the precision of averaged intensities. Rpim = Σhkl[1/(N − 1)] 1/2 Σi | Ii(hkl) − [I(hkl)] | /ΣhklΣiIi(hkl), where ΣiIi(hkl) is the ith measurement of reflection hkl, [I(hkl)] is the weighted mean of all measurements, and N is the redundancy for the hkl reflection.
CC1/2 is the correlation coefficient between intensity estimates from half data sets.
Rwork/Rfree = Σhkl| Fo − Fc | /Σhkl | Fo |, where Fc is the calculated and Fo is the observed structure factor amplitude of reflection hkl for the working/free (5%) set, respectively.
FtsXECL1 crystal structures solved in this work. (A) Cartoon representation of the asymmetric unit of the FtsXECL1-D1 crystal structure, with chain B colored blue to red from the N terminus to the C terminus of the domain, and chain A shown in gray. The detergent 1 molecule (D1) is represented as sticks. (B) Structural superposition of the six independent crystal structures of FtsXECL1 solved in this work. All chains are presented with a ligand attached, except for chain B in complexes FtsXECL1-D1 and FtsXECL1-D3. (C) Structural superposition of the six independent structures. Color coding is as described for panel B. (D) Polar interactions in the N-terminal region of FtsXECL1-D1 (chain A). The N-terminal region (residues 49 to 59) is represented as sticks. Polar interactions are represented as dashed lines. (E) Stabilization of detergent 2 (D2) by the helical lobe of FtsXECL1. FtsXECL1-D2 complex. n-Undecyl-β-d-maltoside (D2) is represented as white sticks. Relevant residues in the protein are represented as green sticks. (F) Stabilization of detergent 3 (D3) by the helical lobe of FtsXECL1. FtsXECL1-D3 complex. n-Decyl-β-d-maltoside (D3) is represented as white sticks. Relevant residues in the protein are represented as green sticks. Polar interactions are represented by dashed lines. (G) Full stabilization of the detergent tail in FtsXECL1-D3 complex (green ribbon) requires hydrophobic residues from the helical lobe of a second monomer in the crystal (yellow ribbon). Similar packing was observed for the other complexes. Download FIG S1, EPS file, 13.2 MB (13.5MB, eps) .
Copyright © 2019 Rued et al.
This content is distributed under the terms of the Creative Commons Attribution 4.0 International license.
Electron density maps for FtsXECL1. (A) Electron density map for the 2.0-Å-resolution structure of FtsXECL1 monomer (chain A). (B) Electron density map (2Fo − Fc map contoured at 0.8σ) for detergent D1 (dodecyltrimethylammonium chloride). (C) Electron density map (2Fo − Fc map contoured at 1σ) for detergent D2 (n-undecyl-β-d-maltoside). (D) Electron density map (2Fo − Fc map contoured at 1σ) for detergent D3 (n-decyl-β-d-maltoside). Detergents are represented as sticks. Download FIG S2, EPS file, 2.9 MB (3MB, eps) .
Copyright © 2019 Rued et al.
This content is distributed under the terms of the Creative Commons Attribution 4.0 International license.
In any case, the crystal structures suggest that changes in the protein backbone and side chains of the helical lobe occur when a detergent ligand is bound (Fig. 1C). These changes create a cavity in which the detergent molecules insert (Fig. 1D), with a large part of the helical lobe (from Q111 to E127) affected by the interaction with detergent (Fig. 1C). Residues Y112, W123, E127, and F126 are strongly perturbed upon detergent ligand binding (Fig. 1C), with the hydroxyl moiety of Y112 interacting with carboxylate of E127. Changes in W123 and F126 stabilize the hydrophobic region of detergent 1. A similar interaction pattern is observed for detergents 2 and 3; additional interactions are observed in N131 with detergents 2 and 3, which are characterized by a larger hydrophilic head (maltose) (Fig. S1E and F). Full stabilization of the hydrophobic tail of the detergents is completed by the same hydrophobic residues (W123 and F126) but from a symmetry-related molecule (Fig. S1G). Although a physiological role for detergent binding to the helical lobe is unknown, many of these same residues are important for the interaction with PcsB (see below).
A structural comparison with the M. tuberculosis FtsXECL1 (PDB code 4N8N) (16) reveals differences in both the overall structure (root mean square deviation [RMSD] of 2.2 Å) and the appended lobes of the core domain (Fig. 1F). The main differences between the mycobacterial and pneumococcal FtsXECL1 domains are the presence of an extra helix (α1) and a disulfide bond in the M. tuberculosis ECL1 that are absent in the pneumococcal ECL1 and an extended β-hairpin (residues 71 to 87) that is unique to the pneumococcal ECL1 domain. Of note, this β-hairpin was conserved among aligned streptococcal species sequences (see Fig. S7A for species list), with β3 being more conserved than β2. It is also worth noting that in the M. tuberculosis ECL1, the upper and lower lobes form a large hydrophobic cleft with four exposed Phe residues (F61, F110, F113, and F122), and this region was suggested as a strong candidate for the interaction surface between FtsX and PG hydrolase RipC (16). These phenylalanine residues are not conserved in the pneumococcal ECL1 (Fig. 1F and G), but the hydrophobic nature of this region is preserved (Y63, I118, W123, and L133).
FtsXECL1 is dynamic in solution.
We also performed additional NMR experiments to explore the mobility of the FtsXECL1 domain, both to validate the heterogeneity of the structural ensemble in solution and to elucidate function. The 1DHN residual dipolar couplings (RDCs) obtained by weak alignment in Pf1 filamentous phage correspond well to previously determined secondary structure elements (29), with uniform values for the entire length of α1 and α2, as expected for straight helices. In contrast, 1DHN values near 0 for the N-terminal tail, the very C terminus, and the nonhelical part of the helical lobe between α2 and β5 are suggestive of significant conformational disorder in solution (Fig. S3A). These regions of small or zero RDCs are regions of very high RMSD in the NMR structure bundle (Fig. S3B). As anticipated, the correlation between experimentally measured RDCs and predicted RDCs back-calculated from the structures (30) is high, but only in the core subdomain, and the experimental and predicted RDCs match poorly in the β-hairpin for most of the crystal structures (Fig. S3C and D).
Dynamics of FtsXECL1 in solution and crystal. (A) 1DHN residual dipolar couplings (RDCs) measured in Pf1 filamentous phage, plotted against the FtsXECL1 sequence. (B) Cα RMSD of the solution structure, mapped onto a representative structure from the NMR ensemble, with increased RMSD shown as increased tube width and redness. (C) Box-and-whisker plot showing the distribution of differences between measured and predicted values for the NMR structure for all measured RDCs, including those that were not used as restraints. Outliers are shown as circles. The dashed line shows the median difference for all NMR structures, and the gray-shaded region contains 95% of difference values for all NMR structures, excluding lightly shaded hypermobile regions with vanishing RDC values (residues 45 to 58, 119 to 133, and 165 to 168). Red X’s mark difference values for the crystal structure with detergent D1. Secondary structure elements are shown above for reference. (D) Average RDC difference values for the crystal structures with D1 mapped onto the structure, with excluded hypermobile regions shown in black. (E) Heteronuclear NOEs (hNOE) for each residue. Secondary structure elements are shown in inset for reference. (F) hNOE values mapped onto a representative structure. Increasing fast-timescale motions are shown with increasing redness and increasing tube thickness. Residues omitted due to peak overlap or absence are shown in black in panels D, F, H, and J. (G) Nuclear spin relaxation rates: R2/R1 for each residue. (H) R2/R1 mapped onto a representative structure, with elevated values indicative of slow-timescale motions shown in blue and decreased values indicative of fast-timescale motions shown in red. (I) Rex exchange rates for each residue, at 600 MHz and 800 MHz plotted in black and gray, respectively. (J) Rex rates at 600 MHz mapped onto a representative structure, with increasing slow-timescale motions shown with increasing blueness and increasing tube thickness. (K) Crystallographic B factors plotted as increasing tube width and redness on the FtsXECL1 structure, for chains A and B with detergents D1 and D3. The detergents are shown as sticks. (L) RMSD of the crystal structures mapped onto chain A of the FtsXECL1-D1 structure, with increasing tube thickness and redness indicative of higher RMSDs. Download FIG S3, EPS file, 8.8 MB (9MB, eps) .
Copyright © 2019 Rued et al.
This content is distributed under the terms of the Creative Commons Attribution 4.0 International license.
We previously reported that the 15N-{1H} heteronuclear nuclear Overhauser effect (hNOE) is low or negative at the termini, indicating that they are highly flexible in solution (29). The hNOE is also smaller in the β2-β3 hairpin region, as well as in the C-terminal end of the α2 helix and the subsequent coiled region leading into β5 (Fig. S3E) (29). Mapping these dynamics data onto a representative structure from the solution NMR ensemble shows that these regions with fast-timescale dynamics correspond to the β-hairpin and the helical lobe (Fig. S3F). Information on picosecond-to nanosecond (ps-ns) fast-timescale motions extracted from the R2/R1 ratio also reveals that the α2-β5 linker is highly flexible, while the β1-β2 linker and β-hairpin show elevated R2/R1 ratios, specifically indicative of slow, millisecond (ms) timescale conformational exchange (Fig. S3G and H). These findings were directly confirmed by Carr-Purcell-Meiboom-Gill (CPMG) relaxation dispersion NMR spectroscopy (Fig. S3I and J) (31). We conclude that the β-hairpin exhibits flexibility on both the sub-ns and ms timescales. Interestingly, the β1-β2 linker also shows increased B factors that are qualitatively consistent with the ms timescale conformational exchange observed by NMR.
These complex motions observed in the solution dynamics experiments are reflected in the heterogeneity of the NMR structure, with high Cα RMSDs particularly in the α2-β5 linker but also in the β-hairpin and β1-β2 linker, thus validating the conformational spread in the ECL1 structure in solution (Fig. S3B). The dynamic nature of the helical lobe is also reflected in the heterogeneity and B factors of the crystal structures (Fig. S3K and L). Full-length FtsX itself is likely a dimer in vivo (32), and one can speculate that the flexible helical-lobe and β-hairpin regions may contribute to dimerization or to interactions with a binding partner like PcsB.
The PscBCC domain interacts with FtsXECL1.
The 1H-15N HSQC spectrum for ECL1 has excellent chemical shift dispersion and lends itself readily to studies of protein-protein interactions (Fig. S4A). In contrast, full-length PcsB is 42 kDa and forms a dimer and thus is challenging to study by NMR due to its size. We therefore constructed truncation mutants of PcsB, focusing on the coiled-coil domain (PscBCC), thereby limiting the molecular weight to 23 to 24 kDa. 15N-labeled PscBCC(47–267) (comprising residues 47 to 267) and PscBCC(47–254) (comprising residues 47 to 254) are both characterized by 1H-15N HSQC spectra with limited 1H signal dispersion (Fig. S6A), consistent with the high helical content of this domain. Circular dichroism spectroscopy confirms that these proteins are primarily α-helical, in agreement with the crystal structure (22), indicating that they are properly folded (Fig. S6A) and can be used for ECL1 binding studies.
NMR chemical shift perturbation experiments demonstrate that the PcsB coiled-coil domain interacts with FtsXECL1. (A) 1H-15N HSQC titration of 50 µM 15N-labeled FtsXECL1 with molar equivalents of unlabeled PcsB coiled-coil domain [PscBCC(47–267)]. The legend beside the 1H-15N HSQC spectra indicates the amount of PscBCC added and the spectrum peak color corresponding to this amount. Red peaks indicate no PscBCC added, dark blue peaks indicate 1 molar equivalent PscBCC added, light blue peaks indicate 2 molar equivalents PscBCC added, dark purple peaks indicate 4 molar equivalents PscBCC added, light purple peaks indicate 6 molar equivalents PscBCC added. Labeled peaks on the 1H-15N HSQC indicate residues shifting more than one or two standard deviations from the mean value when 2 molar equivalents of PscBCC were added. (B) Zoomed depiction of residues F126 and M119 from 1H-15N HSQC titration of 15N-labeled FtsXECL1 with unlabeled PscBCC, as examples of peaks with significant shifts (see panel C). The legend to panel A indicates the amount of PscBCC added and the spectrum peak color corresponding to this amount. (C) Chemical shift (Δδ, ppm) per residue of FtsXECL1 upon the addition of 2 molar equivalents of PscBCC is shown in red. The secondary structure is indicated above the plot. The black line on the plot (2 SD) represents the threshold of 2 standard deviations from the average chemical shift upon the addition of 2 equivalents of PscBCC. Peak height change before and after addition of 2 molar equivalents of PscBCC to FtsXECL1 is shown in blue. Download FIG S4, EPS file, 4.3 MB (4.4MB, eps) .
Copyright © 2019 Rued et al.
This content is distributed under the terms of the Creative Commons Attribution 4.0 International license.
To determine if PcsB physically interacts directly with FtsXECL1, we titrated unlabeled PscBCC(47–267) into 15N-labeled FtsXECL1 at molar ratios of 1:1, 2:1, 4:1, and 6:1 and recorded the 1H-15N HSQC spectra (Fig. S4A and B). Numerous crosspeaks move in response to the addition of PscBCC to 15N-labeled FtsXECL1. The largest changes occur in the helical lobe of FtsXECL1 (Fig. 2A, Fig. S4 and S5). In particular, residues M119, W123, I125, F126, and G128 exhibit the greatest changes in crosspeak position and intensity in the sample with a 1:2 molar ratio of FtsXECL1 to PscBCC (Fig. 2A, Fig. S4C); when additional PscBCC is added, these crosspeaks broaden beyond detection (Fig. S5B and C). A reciprocal 1H-15N HSQC spectroscopy experiment with 15N-labeled PscBCC(47–254) further confirms an interaction with unlabeled FtsXECL1 (Fig. S6B), as multiple crosspeaks shift upon the addition of increasing amounts of FtsXECL1 (Fig. S6B). We measured the binding affinity of the FtsXECL1–PscBCC complex using isothermal titration calorimetry (ITC), which reveals an association equilibrium constant (Ka) of 3.0 × 10⁴ M−1 (Kd ∼ 34 µM) (Table 3, Fig. 2B). These data provide the first biochemical evidence for a direct physical interaction between PscBCC and FtsXECL1 (Fig. 2, Fig. S4 to S6).
FIG 2.
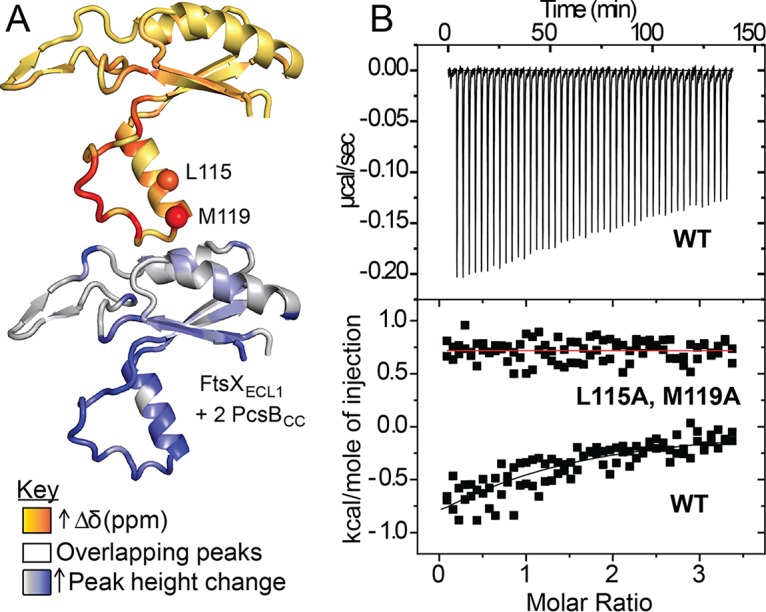
FtsXECL1 binds PscBCC. (A) Significant chemical shifts and peak height changes upon 1H-15N HSQC titration of 50 µM 15N FtsXECL1 with 100 µM unlabeled PscBCC map to the lower lobe of FtsXECL1. Chemical shifts (Δδ, ppm) and peak height changes are mapped as color gradients on the FtsXECL1 structure, orange to red and light gray to blue, respectively. L115 and M119 α carbons are shown as spheres on the upper image. Peaks that overlap in the 1H-15N HSQC spectra are colored white. Chemical shifts and peak height changes upon the addition of 2 molar equivalents of PscBCC to FtsXECL1 are mapped to the structure. (B) Representative titration of PscBCC with wild-type (WT) FtsXECL1 or L115A, M119A FtsXECL1 as monitored by ITC. Conditions used were 50 mM potassium phosphate, 50 mM NaCl, 0.5 mM EDTA, pH 7.0, at 25.0°C. Top, corrected ITC data; bottom, kcal/mole of injection versus time. The black line overlapping the WT data indicates the best fit to a one-site binding model. Fitting parameters are summarized in Table 3. The red line drawn through the L115A M119A FtsXECL1 data is for reference.
TABLE 3.
Thermodynamic parameters of wild-type and mutant FtsXECL1 from direct analysis of isothermal titration calorimetrya
| Protein | Ka (×104 M−1) | Kd (µM)b | ΔH (kcal mol−1) | ΔS (kcal mol−1 K−1) |
|---|---|---|---|---|
| FtsXECL1 | 3.0 ± 0.5 | 34 ± 6 | −2.1 ± 0.2 | 13.4 |
| L115A M119A FtsXECL1 | NAc | NAc | NAc | NAc |
Solution conditions were 50 mM sodium phosphate, 50 mM NaCl, 0.5 mM EDTA, pH 7.0, at 25°C. The chemical model used to fit the data is indicated in supplemental materials and methods in Text S1.
KD, equilibrium dissociation constant.
NA, not applicable since no heat was observed.
Significant chemical shift changes and peak height changes upon 1H-15N HSQC titration of 50 µM 15N-labeled FtsXECL1 with unlabeled PscBCC map to the lower lobe of FtsXECL1. Chemical shift changes (Δδ, ppm) and peak height changes are mapped as color gradients on the FtsXECL1 structure, orange to red and grey to blue, respectively. Peaks that overlap or disappear in the 1H-15N HSQC spectra are colored white and dark grey, respectively. (A) Chemical shift changes and peak height changes upon the addition of 1 molar equivalent of PscBCC to FtsXECL1. (B) Chemical shift changes and peak height changes upon the addition of 4 molar equivalents of PscBCC to FtsXECL1. (C) Chemical shift changes and peak height changes upon the addition of 6 molar equivalents of PscBCC to FtsXECL1. Download FIG S5, EPS file, 8.5 MB (8.7MB, eps) .
Copyright © 2019 Rued et al.
This content is distributed under the terms of the Creative Commons Attribution 4.0 International license.
PscBCC binds to FtsXECL1. (A) Left, 1H-15N HSQC spectrum of 15N-labeled PscBCC(47–254) (in red) overlaid with 1H-15N HSQC spectrum of 15N-labeled PcsB-CC(47–267) (in blue). Right, circular dichroism (CD) spectra of His-PscBCC(47–267) (in blue) and His-PscBCC(47–254) (in red). Primarily α-helical secondary structure is observed. (B) Left, 1H-15N HSQC titration of 50 µM 15N-labeled PscBCC(47–254) with molar equivalents of unlabeled FtsXECL1. The legend above the 1H-15N HSQC spectra indicates the amount of FtsXECL1 added and the spectra peak color corresponding to this amount. Red peaks indicate no FtsXECL1 was added, dark blue peaks indicate 1 molar equivalent FtsXECL1 was added, light blue peaks indicate 2 molar equivalents FtsXECL1 was added, and gold peaks indicate 4 molar equivalents FtsXECL1 was added. Right, portions of the 1H-15N HSQC spectra of 15N-labeled PscBCC(47–254) that have peak shifts upon the addition of increasing amounts of FtsXECL1. Download FIG S6, EPS file, 8.1 MB (8.3MB, eps) .
Copyright © 2019 Rued et al.
This content is distributed under the terms of the Creative Commons Attribution 4.0 International license.
Supplemental materials and methods and appendix. Download Text S1, PDF file, 2.6 MB (2.6MB, pdf) .
Copyright © 2019 Rued et al.
This content is distributed under the terms of the Creative Commons Attribution 4.0 International license.
The interaction region of FtsXECL1 with PscBCC is essential for cell growth and proper morphology.
Having identified the interaction region between FtsXECL1 and PscBCC, we next sought to determine the degree to which this interaction interface mapped by NMR spectroscopy contributes to pneumococcal viability. A multiple-sequence alignment of this region (residues 102 to 155) among bacterial species in which FtsX has been studied and in related streptococcal species (Fig. S7A) reveals that amino acids in this region are either partially or completely conserved (Fig. S7A). We therefore decided to target E109, Q111, L115, M119, W123, F126, and N131 for substitution with alanine, singly or in combination (Fig. S7A). Given the essentiality of the interaction of FtsXECL1 and PscBCC, we predicted that mutating these residues might be lethal (20). To allow for the cross-in of potentially lethal point mutations, we employed the Janus cassette method to insert point mutations at the native site of ftsX into a strain containing an ectopic copy of ftsX+ under a zinc-inducible promoter (Fig. S7B) (33). We then transformed markerless mutant alleles of ftsX in the presence of zinc. This allows for expression of the wild-type ftsX+ and mutant ftsX simultaneously. As long as the mutant ftsX was not dominant negative, we could obtain a strain that expresses the wild-type copy of ftsX+ under zinc induction and mutant ftsX only in the absence of zinc (Fig. S7B).
Residues in the interaction region of FtsXECL1-PcsBCC are conserved, and FtsX depletion results in rounded cells and inhibition of growth. (A) Amino acid alignment of residues 102 to 155 of S. pneumoniae FtsXECL1 with corresponding FtsX sequences from M. tuberculosis, E. coli, Streptococcus gordonii, Streptococcus mitis, Streptococcus mutans, Streptococcus pyogenes, Bacillus cereus, and B. subtilis. The S. pneumoniae sequence is indicated in bold, and the secondary structure from the S. pneumoniae structure is indicated above the alignment. The FtsXECL1-PcsBCC interaction region is indicated by the blue line beneath the alignment, from S. pneumoniae FtsX amino acids 105 to 137. Alignment was obtained by input of the sequences into the Clustal Omega webserver (http://www.ebi.ac.uk/Tools/msa/clustalo/) and then input of the multiple sequence alignment into the ESPript 3.0 webserver (http://espript.ibcp.fr/ESPript/ESPript/). See supplemental materials and methods in Text S1 for additional details. (B) Genetic scheme for cross-in of potentially lethal amino acid changes. In the D39 rpsL1 Δcps wild-type background, wild-type ftsX was placed under the control of the zinc-inducible promoter (PZn) at the bgaA locus (ectopic site) and a Janus cassette (33) [kan-rpsL+]-ftsX was placed at the native site of ftsX in the chromosome (D39 rpsL1 Δcps [kan-rpsL+]-ftsX/bgaA::tet-PZn-ftsX+; strain IU12330). To select for the cross-in of markerless mutant alleles of ftsX that could potentially be lethal, linear DNA amplicons of mutant ftsX were transformed into IU12330 with 0.45 mM ZnCl2, 0.045 mM MnSO4, and streptomycin (for Janus cassette exchange). Resulting strains were propagated and stored with the same Zn and Mn concentrations. After storage, strains were grown without Zn-Mn to determine if the mutant allele of ftsX caused morphological or growth defects. Strains were also grown with Zn-Mn to determine if the mutant allele was dominant negative. (C) Representative growth curves of the FtsX depletion strain versus the wild type. These strains were grown with or without 0.45 mM ZnCl2 supplemented with 0.045 mM MnSO4 (indicated as +Zn). Strains shown are as follows: black circle, D39 rpsL1 Δcps wild-type parent (1, strain IU1824); grey circle, IU1824 +Zn; blue square, D39 rpsL1 Δcps ΔftsX::P-aad9/bgaA::tet-PZn-ftsX+ (2, strain IU12376); light blue square, IU12376 +Zn. This growth curve experiment was repeated three times with similar results. (D) Representative images of strains at 6 h of growth. The genotype of the strain shown is indicated above each panel. No Zn or +Zn indicates whether or not Zn-Mn was added. %, the percentage of cells in the population that are morphologically similar to the images shown. More than 50 cells were counted per experimental run, condition, and strain. These experiments were performed three times independently with similar results. Scale bar shown is 1 µm. (E) Lengths, widths, aspect ratios, and relative cell volumes of strains at 3 h and 6 h of growth. Strains are indicated according to the numbering in panel C. More than 50 cells were measured per strain and condition over two experimental replicates. For statistical analysis, the Kruskal-Wallis test (one-way ANOVA) with Dunn’s multiple comparison posttest was used to determine if lengths, widths, aspect ratios, and relative cell volumes were significantly different between strains and conditions. ns, not significant; *, P < 0.05; ** P < 0.005; ***, P < 0.0005. Download FIG S7, EPS file, 6.2 MB (6.4MB, eps) .
Copyright © 2019 Rued et al.
This content is distributed under the terms of the Creative Commons Attribution 4.0 International license.
Zinc toxicity has been observed to cause aberrant cell morphology and growth inhibition in S. pneumoniae when cells are not supplemented with manganese (34, 35). To rule out any deleterious effects of the zinc-and-manganese (Zn-Mn) addition used to induce ftsX expression, we measured the growth of the parent and the FtsX merodiploid strain in the presence of these metals. To verify that the addition of 0.45 mM ZnCl2 and 0.045 mM MnSO4 (Zn-Mn) did not cause growth or morphological defects, cells were grown in the presence and absence of Zn-Mn and imaged at 3 h and 6 h into the growth curve (Fig. S7C and D). Wild-type cells (strain D39 Δcps rpsL1) had no morphological or growth defects at these time points with or without the addition of Zn-Mn (Fig. S7C and E).
In contrast, the FtsX merodiploid strain (PZn-ftsX ΔftsX) had significant morphological and growth defects at 3 or 6 h in the absence of Zn-Mn (Fig. S7C to E). Cessation of growth and aberrant cell morphology were observed in 90% of cells at 3 h and 95% of cells at 6 h growth (Fig. S7D). These cells were significantly shorter and rounder than wild-type cells (Fig. S7E), and a large variability in their volumes was observed (Fig. S7E), as previously found for a strain expressing ftsX+ under a fucose-inducible promoter (21). If the strain was grown in the presence of Zn-Mn, FtsX was expressed and the strain had no growth or morphological defects (Fig. S7C to E). This indicates the defects observed were solely due to the absence of FtsX.
We next constructed three classes of amino acid substitution or insertion mutants (Table 4) in an effort to disrupt the FtsXECL1–PscBCC interaction defined by NMR spectroscopy. These are designated class I (single amino acid changes), class II (multiple amino acid changes), and class III [insertion of a (Gly3Ser)2 linker] mutants. Class I strains were made by introducing single-amino-acid substitutions in the merodiploid strain and measuring growth or morphology defects (Table 4, Fig. S8). Class I mutants targeted both the α2 helix and the loop region (residues 107 to 120 and 121 to 130, respectively) of the FtsXECL1 helical lobe (Table 4, Fig. 3A, Fig. S8A). Single-amino-acid-substitution mutations of FtsX (including E109A [a change of E to A at position 109], L115A, M119A, W123A, F126A, N131A, and N131D) resulted in morphological defects without Zn-Mn (Table 4, Fig. S8C and D) but did not induce a measurable growth phenotype (Table 4, Fig. S8B). The expression of FtsX(L115A) resulted in cell shape defects (aspect ratio, length, width, and volume) (Fig. S8C and D), while the expression of FtsX(M119A) only resulted in a change in cell volume (Fig. S8D). These differences were not due to misexpression of FtsX, as Western blot analysis indicates that all mutant proteins were expressed at or near wild-type levels (Fig. 4C). Two other single-amino-acid substitutions (E109Q and Q111A) did not strongly affect growth, morphology, or expression (Table 4, Fig. 4D).
TABLE 4.
Amino acid changes made in vivo to disrupt the FtsXECL1-PcsB interactiona
| Category of change(s) madeb |
Amino acid change(s) or location of insertion |
Defect(s) in shape and/or growth |
Location(s) in FtsXECL1 |
|---|---|---|---|
| Class I | E109A | Shape only | α2 helix |
| E109Q | No | α2 helix | |
| Q111A | Noc | α2 helix | |
| L115A | Shape only | α2 helix | |
| M119A | Shape only | α2 helix | |
| W123A | Shape only | Loopd | |
| F126A | Shape only | Loopd | |
| N131A | Shape only | Loopd | |
| N131D | Shape only | Loopd | |
| Class II | E109A N131A | Shape only | α2 helix, loopd |
| Q111A L115C | Shape only | α2 helix | |
| L115A M119A | Yes | α2 helix | |
| E109A Q111A L115A M119A | Yes | α2 helix | |
| F126A W123A N131A | Yes | Loopd | |
| Class IIIe | Residue 51 | Yes | Post-TM1 |
| Residue 78 | Shape only | β-Hairpin | |
| Residue 173 | NAf | Pre-TM2 | |
See the supplemental material for the corresponding strain number and strain construction for each amino acid change or insertion.
Class I, single amino acid changes; class II, multiple amino acid changes; class III, insertion of a (Gly3Ser)2 linker.
In the absence of zinc, this strain had no morphology defects. Morphology defects were observed at 3 h when the strain was expressing both the wild-type copy of FtsX and FtsX(Q111A).
Refers to the unstructured loop after the α2 helix in the helical lobe of the FtsXECL1 structure.
These strains have an insertion of the amino acid sequence GGGSGGGS after the indicated residue.
NA, not applicable, since the strain did not express FtsX with the (Gly3Ser)2 insertion. See Fig. 4E for Western blot data.
FIG 3.

Multiple amino acid changes in the lower lobe of FtsXECL1 cause morphological and growth defects. (A) Amino acid changes made are mapped to the structure of FtsXECL1. The α carbon of each residue is shown as a colored sphere on the structure, and the orange-to-red coloring represents the peak height changes in 1H-15N HSQC spectra upon the addition of 2 molar equivalents of PscBCC to FtsXECL1. (B) Representative growth curves of strains with amino acid changes in the lower lobe of FtsXECL1 compared to the growth of an FtsX depletion strain. These strains were grown without or with 0.45 mM ZnCl2 with 0.045 mM MnSO4 (Zn-Mn; indicated as +Zn). Strains shown are as follows: black circle, strain D39 rpsL1 Δcps wild-type parent (1, strain IU1824); gray circle, IU1824 +Zn; blue square, D39 rpsL1 Δcps ΔftsX::P-aad9/bgaA::tet-PZn-ftsX+ (2, strain IU12376); light blue square, IU12376 +Zn; red triangle, D39 rpsL1 Δcps ftsX(E109A Q111A L115A M119A)/bgaA::tet-PZn-ftsX+ (3, strain IU12861); pink triangle, IU12861 +Zn; green inverted triangle, D39 rpsL1 Δcps ftsX(F126A W123A N131A)/bgaA::tet-PZn-ftsX+ (4, strain IU12864); light green inverted triangle, IU12864 +Zn. This growth curve experiment was repeated three times with similar results. (C) Representative images of strains at 6 h of growth. The genotype or phenotype of the strain is indicated above each panel. No Zn, Zn-Mn was not added; +Zn, Zn-Mn was added; %, percentage of cells in the population that are morphologically similar to the images shown. More than 50 cells per strain, condition, and experimental repeat were analyzed. These experiments were performed three times independently with similar results. Scale bar shown is equal to 1 µm. (D) Lengths, widths, aspect ratios, and relative cell volumes of strains at 6 h of growth. Strains are indicated according to numbering in panel B. More than 50 cells were measured per strain and condition over two experimental replicates. For statistical analysis, the Kruskal-Wallis test (one-way ANOVA) with Dunn’s multiple-comparison posttest was used to determine if lengths, widths, aspect ratios, and relative cell volumes were significantly different between strains and conditions. ns, not significant; *, P < 0.05; **, P < 0.005; ***, P < 0.0005.
FIG 4.

FtsX mutants with amino acid changes are expressed at nearly wild-type levels. Representative blots of anti-FtsX and anti-MreC (Western blotting control for loading) antibodies are shown, with the genotype indicated under each lane. Expected molecular weight (MW) for FtsX is 34.2 kDa, and expected MW for MreC is 29.7 kDa. Samples were grown without Zn and harvested at 6 h of growth. Western blots were imaged as described in supplemental materials and methods in Text S1. (A) FtsX(E109A Q111A L115A M119A) and FtsX(W123A F126A N131A) are expressed at or above wild-type levels without zinc. Lane 1, D39 rpsL1 Δcps (strain IU1824); lane 2, D39 rpsL1 Δcps ftsX(E109A Q111A L115A M119A)/bgaA::tet-PZn-ftsX+ (strain IU12861); lane 3, D39 rpsL1 Δcps ftsX(W123A F126A N131A)/bgaA::tet-PZn-ftsX+ (strain IU12864); lane 4, D39 rpsL1 Δcps ΔftsX/bgaA::tet-PZn-ftsX+ (strain IU13461). (B) FtsX(Q111A L115C) and FtsX(L115A M119A) are expressed at nearly wild-type levels without zinc. Lane 1, D39 rpsL1 Δcps (IU1824); lane 2, D39 rpsL1 Δcps ftsX(Q111A L115C)/bgaA::tet-PZn-ftsX+ (IU13064); lane 3, D39 rpsL1 Δcps ftsX(L115A M119A)/bgaA::tet-PZn-ftsX+ (IU13066); lane 4, D39 rpsL1 Δcps ΔftsX/bgaA::tet-PZn-ftsX+. (C) FtsX(L115A) and FtsX(M119A) are expressed at nearly wild-type levels without zinc. Lane 1, D39 rpsL1 Δcps (IU1824); lane 2, D39 rpsL1 Δcps ftsX(L115A)/bgaA::tet-PZn-ftsX+ (IU12521); lane 3, D39 rpsL1 Δcps ftsX(M119A)/bgaA::tet-PZn-ftsX+ (IU12637); lane 4, D39 rpsL1 Δcps ΔftsX/bgaA::tet-PZn-ftsX+ (IU13461). (D) FtsX(E109Q) and FtsX(N131D) are expressed at nearly wild-type levels without zinc. Lane 1, D39 rpsL1 Δcps (IU1824); lane 2, D39 rpsL1 Δcps ftsX(E109Q)/bgaA::tet-PZn-ftsX+ (IU13088); lane 3, D39 rpsL1 Δcps ftsX(N131D)/bgaA::tet-PZn-ftsX+ (IU13089); lane 4, D39 rpsL1 Δcps ΔftsX/bgaA::tet-PZn-ftsX+ (IU13461). (E) FtsX with (Gly3Ser)2 after residue 51 is expressed, whereas FtsX with (Gly3Ser)2 after residue 173 is not expressed. These are referred to as ftsX N-term ECL1(Gly3Ser)2 and ftsX C-term ECL1(Gly3Ser)2, respectively. Lane 1, D39 rpsL1 Δcps (IU1824); lane 2, D39 rpsL1 Δcps ftsX N-term ECL1(Gly3Ser)2/bgaA::tet-PZn-ftsX+ (IU12629); lane 3, D39 rpsL1 Δcps ftsX C-term ECL1(Gly3Ser)2/bgaA::tet-PZn-ftsX+ (IU12869); lane 4, D39 rpsL1 Δcps ΔftsX/bgaA::tet-PZn-ftsX+ (IU13461). These experiments were performed two to three times independently.
Expression of FtsX(L115A) or FtsX(M119A) results in mild morphological defects. (A) Amino acid changes made are mapped to the structure of FtsXECL1. The α carbon of each residue is shown as a colored sphere. The orange-to-red coloring on the FtsXECL1 structure represents the peak height changes in the 1H-15N HSQC spectra upon the addition of 2 molar equivalents of PscBCC to FtsXECL1. (B) Representative growth curves of strains expressing FtsX(L115A) or FtsX(M119A) versus FtsX depletion and wild-type strains. These strains were grown with or without 0.45 mM ZnCl2 supplemented with 0.045 mM MnSO4 (indicated as +Zn). Strains shown are as follows: black circle, strain D39 rpsL1 Δcps wild-type parent (1, strain IU1824); grey circle, IU1824 +Zn; dark blue square, D39 rpsL1 Δcps ΔftsX::P-aad9/bgaA::tet-PZn-ftsX+ (2, strain IU12376); light blue square, IU12376 +Zn; red triangle, D39 rpsL1 Δcps ftsX(L115A)/bgaA::tet-PZn-ftsX+ (3, strain IU12521); pink triangle, IU12521 +Zn; brown inverted triangle, D39 rpsL1 Δcps ftsX(M119A)/bgaA::tet-PZn-ftsX+ (4, strain IU12637); light brown inverted triangle, IU12637 +Zn. This experiment was performed three times with similar results. (C) Representative images of strains at 6 hours growth. The genotype of the strain shown is indicated above each panel. No Zn or +Zn indicates whether or not Zn-Mn was added. %, percentage of cells in the population that are morphologically similar to the images shown. More than 50 cells per strain per experimental repeat were analyzed. These experiments were performed three times independently with similar results. Scale bar is equal to 1 µm. (D) Lengths, widths, aspect ratios, and relative cell volumes of strains at 6 h of growth. Strains are indicated according to the numbering in panel B. More than 50 cells were measured per strain and condition over two experimental replicates. For statistical analysis, the Kruskal-Wallis test (one-way ANOVA) with Dunn’s multiple comparison posttest was used to determine if lengths, widths, aspect ratios, and relative cell volumes were significantly different between strains and conditions. ns, not significant; *, P < 0.05; **, P < 0.005; ***, P < 0.0005. Download FIG S8, EPS file, 5.8 MB (5.9MB, eps) .
Copyright © 2019 Rued et al.
This content is distributed under the terms of the Creative Commons Attribution 4.0 International license.
In contrast to the somewhat modest physiological impact of class I substitutions, selected class II mutants (Table 4) exhibited severe morphological and growth defects (Fig. 3, Table 4, Fig. S9). In strains with mutations targeting the α2 helix [FtsX(E109A Q111A L115A M119A)] or the coil [FtsX(F126A W123A N131A)], ≥98% of cells had severe growth and morphology defects. The growth and morphology of these strains were similar to those of cells in which ftsX was depleted (Fig. 3B to D). Cells expressing these ftsX alleles became significantly rounder and shorter (Fig. 3D) and showed growth inhibition in the absence of zinc (Fig. 3B). Importantly, in the presence of zinc, the cells were indistinguishable from wild-type cells at 3 h (Fig. 3D). At 6 h with zinc, these cells exhibited changes in width and volume, which could be due to overexpression of FtsX at this time point or the expression of wild-type and mutant FtsX simultaneously (Fig. 3D). Western blotting confirmed that FtsX(E109A Q111A L115A M119A) and FtsX(F126A W123A N131A) were expressed in the absence of zinc at 6 h postdepletion (Fig. 4A). The triple FtsX(F126A W123A N131A) mutant expressed in the absence of zinc migrated slightly higher than wild-type FtsX on an SDS-PAGE gel, but it was expressed (Fig. 4A). Taken together, these results reveal that both the α2 helix and the loop in the helical lobe of FtsXECL1 are important for FtsX function in vivo and confirm the functional importance of the physical interaction of FtsX and PcsB mapped by NMR spectroscopy.
Cells expressing FtsX(L115A M119A) have severe defects in morphology and growth. Cells expressing FtsX(Q111A L115C) have defects in morphology but not growth. (A) Amino acid changes made mapped to the structure of FtsXECL1. The α carbon of each residue is shown as a colored sphere. The orange-to-red coloring on the FtsXECL1 structure represents the peak height changes in the 1H-15N HSQC spectra upon the addition of 2 molar equivalents of PscBCC to FtsXECL1. (B) Representative growth curves of strains expressing FtsX(Q111A L115C) and FtsX(L115A M119A) versus FtsX depletion and wild-type strains. These strains were grown with or without 0.45 mM ZnCl2 and 0.045 mM MnSO4 (indicated as +Zn). Strains shown are as follows: black circle, strain D39 rpsL1 Δcps wild-type parent (1, strain IU1824); grey circle, IU1824 +Zn; blue square, D39 rpsL1 Δcps ΔftsX::P-aad9/bgaA::tet-PZn-ftsX+ (2, strain IU12376); light blue square, IU12376 +Zn; green inverted triangle, D39 rpsL1 Δcps ftsX(Q111A L115C)/bgaA::tet-PZn-ftsX+ (3, strain IU13064); light green inverted triangle, IU13064 +Zn; dark purple diamond, D39 rpsL1 Δcps ftsX(L115A M119A)/bgaA::tet-PZn-ftsX+ (4, strain IU3066); light purple diamond, IU13066 +Zn. This growth curve experiment was repeated three times with similar results. (C) Representative images of strains at 6 h of growth. The genotype of the strain shown is indicated above each panel. No Zn or +Zn indicates whether or not Zn-Mn was added. %, percentage of cells in the population that are morphologically similar to the images shown. More than 50 cells were counted per experimental run, per condition and strain. These experiments were performed three times independently with similar results. Scale bar is equal to 1 µm. (D) Length, width, aspect ratio, and relative cell volume of strains at 6 hours growth. Strains are indicated according to the numbering in panel B. Greater than 50 cells were measured per strain and condition over two experimental replicates. For statistical analysis, a Kruskal-Wallis test (one-way ANOVA) with Dunn’s multiple comparison posttest was used to determine if length, width, aspect ratio, and relative cell volume were significantly different between strains and conditions. ns, not significant; *, P < 0.05; **, P < 0.005; ***, P < 0.0005. Download FIG S9, EPS file, 5.9 MB (6MB, eps) .
Copyright © 2019 Rued et al.
This content is distributed under the terms of the Creative Commons Attribution 4.0 International license.
Some of the class II mutants we characterized had just two amino acid changes in the α2 helix or the extended loop of the helical lobe (Table 4, Fig. S9). We observed that 99% of cells expressing FtsX(L115A M119A) exhibited strong growth and morphology defects at 6 h in the absence of zinc (Table 4, Fig. S9B and C), and these cells displayed decreases in length, width, and volume relative to those of wild-type cells (Fig. S9D). This mutant was expressed at nearly wild-type levels in the absence of zinc (Fig. 4B). These data confirm that the tandem L115A M119A substitution disrupts FtsX function, even though these substitions result in only slight morphological defects as individual single mutations (Table 4, Fig. S8B to D, Fig. S9B to D). Another double mutant, FtsX(Q111A L115C), induced the formation of long chains and a “boxy” cell morphology (Table 4, Fig. S9C). This mutant resulted in shorter cells with a significantly different aspect ratio than the wild type (Fig. S9D), but this strain had no growth phenotype (Fig. S9B). In contrast, another double substitution class II mutant, FtsX(E109A N131A) (Table 4), exhibited no strong morphology or growth defects.
Finally, class III insertion mutants (Table 4) were constructed and used to evaluate whether other regions of FtsXECL1 were important for the FtsXECL1-PcsB interaction or for FtsX function. We inserted a (Gly3Ser)2 flexible linker either approximately where FtsXECL1 is predicted to enter (residue 51) or exit (residue 173) the membrane bilayer or in the β-hairpin, which exhibits significant conformational disorder over a range of timescales (Fig. 1A). An insertion after residue 51 in FtsXECL1 was detrimental to both growth and morphology (Table 4), and this insertion did not disrupt FtsX expression (Fig. 4E). The insertion after residue 173 in FtsXECL1 also caused growth and morphology defects, but this FtsX variant was not expressed in cells (Table 4, Fig. 4E). The β-hairpin (Gly3Ser)2 insertion (Fig. 1B, see appendix in Text S1) was introduced after amino acid 78 of FtsXECL1, which corresponds to the tip of the β-turn in the β-hairpin (Fig. 1B). This strain also exhibited no growth defect, but these cells were significantly smaller, although only at the 3 hr time point (see appendix in Text S1). We conclude that the β-hairpin does not play a major role in FtsX-PcsB interaction, consistent with the NMR mapping experiments.
FtsXECL1(L115A M119A) is stably folded and unable to bind PscBCC.
We reasoned that if the defects observed in class I and class II mutants were due to the disruption of the FtsXECL1–PscBCC interaction, this should affect the affinity of this interaction as measured by ITC. We first characterized the L115A M119A double mutant by 1H-15N NMR and CD spectroscopy to confirm its structural integrity. The CD spectrum resembled that of the wild type, as did the 1H-15N HSQC spectrum, with clear chemical shift perturbations only among those resonances in the immediate vicinity of the double substitution (Fig. S10B). Both pieces of data suggest a local rather than global perturbation of the α2-loop lobe in the FtsXECL1 structure upon introduction of the L115A M119A double substitution. As anticipated, titration of PscBCC(47–267) with FtsXECL1(L115A M119A) reveals no detectable binding (no observable heat) (Fig. 2B, Table 3) compared to the results using wild-type FtsXECL1. These data confirm that the helical lobe of FtsXECL1 interacts with PscBCC and that this interaction is required for viability and proper cell shape.
1H-15N HSQC spectra of 15N-labeled FtsXECL1(E109A Q111A L115A M119A), FtsXECL1(L115A M119A), and FtsXECL1(W123A F126A N131A) show perturbation of residues in the lower lobe of FtsXECL1. (A) 1H-15N HSQC spectrum of 50 µM 15N-labeled FtsXECL1(E109A Q111A L115A M119A) compared to the wild-type FtsXECL1 spectrum. Wild-type FtsXECL1 peaks are indicated in black, and FtsXECL1(E109A Q111A L115A M119A) peaks are indicated in light blue. Below the spectra, peaks that are no longer in the area of the original wild-type peak are indicated by their α carbon as a sphere on the FtsXECL1 structure. Overlapping peaks are indicated in white. (B) 1H-15N HSQC spectrum of 50 µM 15N-labeled FtsXECL1(L115A M119A) compared to the wild-type FtsXECL1 spectrum. Wild-type FtsXECL1 peaks are indicated in black, and FtsXECL1(L115A M119A) peaks are indicated in green. Below the spectra, peaks that are no longer in the area of the original wild-type peak are indicated by their α carbon as a sphere on the FtsXECL1 structure. Overlapping peaks are indicated in white. (C) 1H-15N HSQC spectrum of 50 µM 15N-labeled FtsXECL1(W123A F126A N131A) compared to the wild-type FtsXECL1 spectrum. Wild-type FtsXECL1 peaks are indicated in black, and FtsXECL1(W123A F126A N131A) peaks are indicated in purple. Below the spectra, peaks that are no longer in the area of the original wild-type peak are indicated by their α carbon as a sphere on the FtsXECL1 structure. Overlapping peaks are indicated in white. (D) Circular dichroism (CD) spectroscopy results for wild-type FtsXECL1, FtsXECL1(L115A M119A), FtsXECL1(E109A Q111A L115A M119A), and FtsXECL1(W123A F126A N131A) plotted as the function of mean residue ellipticity (deg · cm2 dmol−1) × 103 versus wavelength (nm). Download FIG S10, EPS file, 19.2 MB (19.7MB, eps) .
Copyright © 2019 Rued et al.
This content is distributed under the terms of the Creative Commons Attribution 4.0 International license.
In contrast to the L115A M119A double mutant, the severely functionally compromised representative triple mutant FtsXECL1(W123A F126A N131A) and quadruple mutant FtsXECL1(E109A Q111A L115A M119A) exhibited more pronounced structural perturbations that nonetheless map only to the helical lobe. The triple mutant was indistinguishable from the L115A M119A and wild-type FtsXECL1 derivatives by CD spectroscopy, while the quadruple mutant exhibited less molar ellipticity, or secondary structure (Fig. S10D). Inspection of their 1H-15N HSQC spectra reveals that although the core and β-hairpin domains essentially resemble those of the wild type, each of these mutants exhibits considerable perturbation of resonances throughout the helical lobe (Fig. S10A and C). Since these mutants are functionally compromised, these structural findings strongly support the conclusion that the structural integrity of the lower lobe is essential for the physical interaction with PcsB and the function of FtsX in pneumococcal cells.
DISCUSSION
This study presents a comprehensive analysis of the solution and X-ray structures of the outward-facing large extracellular loop of FtsX (FtsXECL1) from S. pneumoniae and defines a physical interaction site with the coiled-coil domain of peptidoglycan hydrolase PcsB (PscBCC). Our FtsXECL1 structures reveal a globular fold that, while similar to the large extracellular loop of FtsX from M. tuberculosis (16), is characterized by unique features. The upper β-hairpin distinguishes S. pneumoniae FtsXECL1 from that of M. tuberculosis, and despite being characterized by significant conformational dynamics on a range of timescales, it is not required for the interaction of S. pneumoniae FtsXECL1 with PcsB. The function of this domain is not well defined by our data, but it could play a role in another process, e.g., FtsX dimerization, interaction with the small extracellular loop (ECL2), or interaction with another domain of PcsB. Alternatively, it could be a result of the difference in cell wall architecture between S. pneumoniae and M. tuberculosis. On the other hand, the helical lobe of FtsXECL1, common to the FtsX structures of both S. pneumoniae and M. tuberculosis, is vital for the interaction with PcsB in vitro, and this interface is functionally important in vivo. Increasing numbers of Ala substitutions tested here increasingly disrupt this interaction and ultimately cause dramatic growth and morphology defects, indicating that the helical lobe of FtsXECL1 is essential for regulation of PcsB during cell division. Interestingly, this region of FtsXECL1 corresponds with the region shown to be important for the interaction of M. tuberculosis FtsXECD with its PG hydrolase, RipC (16). This suggests that the helical lobe could be a conserved functional determinant for the interaction of FtsX with cognate hydrolases or adaptor proteins across many species of bacteria.
We propose that the helical lobe of FtsXECL1 is important for the activation of cognate hydrolase activity either directly or indirectly through adaptors (Fig. 5). The exact role of the second extracellular loop of FtsX (FtsXECL2) is unknown, but it may also regulate this process, as temperature-sensitive mutations in pcsB were found to be suppressed by mutations in the coding region for FtsXECL2 (20). Previous work suggests that FtsEX forms a dimer (32), as dimerization of the FtsE ATPase domain is likely a necessary condition for ATP hydrolysis (Fig. 5A) (36, 37). After formation of the complex, ATP hydrolysis by FtsE results in a conformational change in FtsX, releasing PcsB from what we anticipate is an inhibited state (Fig. 5B and C) (22). This interaction is mediated by the helical lobe of FtsXECL1, although the membrane and, possibly, lipid binding by FtsXECL1 and FtsXECL2 itself may also play a role. We propose that the interaction of FtsXECL1 with the PcsB coiled-coil domain communicates release of the PcsB CHAP domain from an inhibited state and, thus, is important for modulating PG hydrolysis by PcsB (Fig. 5B and C).
FIG 5.

Model for the activation of PcsB by FtsXECL1. (A) FtsEX dimerizes to form the active complex. PcsB is secreted into the extracellular milieu. Attraction of PcsB to the area of active FtsX complexes might be mediated by its propensity to interact with membranes (32). The ECL1 and ECL2 loops are indicated on FtsX. FtsXECL1 is shown in green, with the β-hairpin and α-helical lobe shaded in yellow and blue, respectively. (B) After formation of the active complex, ATP hydrolysis by FtsE causes a conformational change in FtsX. (C) PcsB interacts with FtsXECL1 via its coiled-coil domain, and this interaction causes activation of the peptidoglycan hydrolytic activity of PcsB. PcsB, along with other factors in the cell, allows cell division to proceed normally. Functional FtsX, FtsE, and PcsB are all required for efficient cell division.
Recently, the structure of Aggregatibacter actinomycetemcomitans MacB was reported and suggested to be a structural paradigm for the ABC3 transporter superfamily that includes FtsX (38). MacB was proposed to function as a mechanical pump to drive enterotoxin transport through TolC in E. coli (38). Crow et. al found that MacB itself did not transport enterotoxin but drove TolC to transport it instead, due to the lack of a central cavity in the MacB structure (38). As such, they proposed MacB as a model for other so-called “mechanotransmitters” belonging to this same ABC3 transporter superfamily. While this proposed function of mechanotransmission may well characterize MacB and FtsX, the overall structure of FtsXECL1 from S. pneumoniae is clearly distinct from the periplasmic domain of MacB, thus revealing that MacB does not readily provide a structural basis for understanding FtsX-dependent peptidoglycan hydrolases. Future work using reconstituted FtsEX and PcsB complexes will allow for understanding how this common mechanotransmission principle extends throughout the ABC3 superfamily.
MATERIALS AND METHODS
NMR spectroscopy.
Spectra of 15N- or 15N13C-labeled FtsXECL1 were recorded at 298 K on Varian (Agilent) DDR 600- or 800-MHz spectrometers equipped with cryogenic probes in the METACyt Biomolecular NMR Laboratory at Indiana University Bloomington. NMR samples contained 50 mM potassium phosphate, pH 7.0, 50 mM NaCl, and 10% (vol/vol) D2O, with 0.2 mM 4,4-dimethyl-4-silapentane-1-sulfonic acid (DSS) for chemical shift referencing. The typical concentrations of FtsXECL1 were 50 µM for 15N HSQC spectra and 400 µM for triple-resonance and dynamics experiments. 1JHN splittings for residual dipolar couplings (RDCs) were measured using two-dimensional in-phase/anti-phase (2D IPAP) [15N, 1H]-HSQC spectra (39), recorded on an isotropic sample and on a sample aligned with 20 mg/ml phage Pf1 (ASLA Biotech). 1DHN was calculated from 1DHN = 1JHN (anisotropic) – 1JHN (isotropic). Aromatic sidechains were assigned using the HBCBCGCDHD and HBCBCGCDCEHE experiments (40). For experiments detecting PscBCC binding, 15N FtsXECL1 was kept at 50 µM, and 1H-15N HSQC spectra were recorded with the following concentrations of PscBCC(47–267): 0, 50 µM, 100 µM, 200 µM, and 400 µM. nmrPipe, Sparky, CARA (http://cara.nmr.ch), CCPNMR, and NMRbox (41–44) were used for data processing and analysis. Resonance assignments and dynamics data are available in the BMRB under accession code 30523. These NMR data were used to calculate and refine the solution structure of ECL1 (see supplemental materials and methods in Text S1), with the ensemble of the 20 lowest-energy structures (see Table 1 for structure statistics) deposited in the Protein Data Bank (PDB code 6MK7).
X-ray crystallography.
Crystallization screenings were performed by using high-throughput crystallization techniques in a NanoDrop robot with Innovadyne SD-2 microplates (Innovadyne Technologies, Inc.) and screening using PACT Suite and JCSG Suite (Qiagen), JBScreen Classic 1 to 4 and 6 (Jena Bioscience), and Crystal Screen, Crystal Screen 2, and Index HT (Hampton Research). Positive conditions in which crystals grew were optimized by the sitting-drop vapor-diffusion method at 291 K by mixing 1 µl of protein solution and 1 µl of precipitant solution, equilibrated against 150 µl of precipitant solution in the reservoir chamber. The best crystals were obtained under a crystallization condition of a solution containing 0.1 M sodium citrate, pH 5.6, 0.2 M potassium-sodium tartrate, and 2 M ammonium sulfate. These crystals were further optimized by cocrystallization in the presence of detergents dodecyltrimethylammonium chloride (detergent 1 [D1]; 46 µM), n-undecyl-β-d-maltoside (detergent 2 [D2]; 0.59 mM), and n-decyl-β-d-maltoside (detergent 3 [D3]; 1.8 mM). Crystals were cryoprotected in the precipitant solution supplemented with 25% (vol/vol) glycerol prior to flash cooling at 100 K. Diffraction data were collected in the XALOC beamline at the ALBA synchrotron (CELLS-ALBA, Spain), using a Pilatus 6 M detector and a wavelength of 0.979257 Å. Crystals diffracted up to 2.0- to 2.3-Å resolution and belonged to the P 43 21 2 space group. The collected data sets were processed with XDS (45) and Aimless (46). Two FtsXECL1 molecules were found in the asymmetric unit for all three structures, yielding Matthews coefficients of 2.59 Å3/Da (FtsXECL-D1), 3.49 Å3/Da (FtsXECL-D2), and 2.49 Å3/Da (FtsXECL-D1) (47) and solvent contents of 52.5% (FtsXECL-D1), 64.7% (FtsXECL-D2), and 50.7% (FtsXECL-D3). Structure determination was performed by molecular replacement using the online server Morda (http://www.biomexsolutions.co.uk/morda/). Refinement and manual model building were performed with Phenix (48) and Coot (49), respectively. The data for FtsXECL-D1 and FtsXECL-D3 presented translational noncrystallographic symmetry (fractional coordinates of [−0.498, −0.498, 0.50] and height relative to origin of 79.60% for FtsXECL-D1, and fractional coordinates of [−0.498, −0.498, 0.50] and height relative to origin of 78.70% for FtsXECL-D3) that were treated with Phenix (48). The stereochemistry of the final model was checked by MolProbity (50). Data collection and processing statistics are shown in Table 2.
Bacterial strains, plasmids, and growth conditions.
Bacterial strains and plasmids used in this study are listed in the supplemental material. S. pneumoniae strains were derived from IU1945, an unencapsulated derivative of serotype 2 S. pneumoniae strain D39 (51). Strains were grown on Trypticase soy agar II with 5% (vol/vol) defibrinated sheep blood (TSAII-BA) plates or in Becton, Dickinson brain heart infusion (BHI) broth at 37°C in an atmosphere of 5% CO2. E. coli strains for protein expression were derived from strain BL21(DE3) (catalog number C2527H; NEB). E. coli strains were grown in Luria-Bertani (LB) broth or in M9 minimal medium supplemented with 15NH4Cl at 37°C with shaking at 150 rpm. When required, tetracycline (0.25 to 2.5 µg/ml), kanamycin (250 µg/ml), spectinomycin (150 µg/ml), streptomycin (250 µg/ml), ampicillin (100 µg/ml), and/or isopropyl β-d-1-thiogalactopyranoside (IPTG) (1 mM) was added to S. pneumoniae or E. coli culture medium. S. pneumoniae strains requiring zinc for expression of essential genes were grown with 0.45 mM ZnCl2 and 0.045 MnSO4.
Growth curve experiments and phase-contrast microscopy of strains.
For physiological and morphological analyses of strains, cells were inoculated from frozen glycerol stocks into BHI broth, serially diluted, and incubated for 10 to 12 h statically at 37°C in 5% CO2 overnight. If zinc was required for growth of cultures, 0.45 mM ZnCl2 and 0.045 MnSO4 were added to overnight tubes. The next day, cultures ranging from an optical density at 620 nm (OD620) of ≈0.05 to 0.4 were diluted into fresh BHI to an OD620 of ≈0.003 in 4-ml volumes, and two identical cultures for each strain were prepared, one with 0.45 mM ZnCl2–0.045 MnSO4 and one without. These cultures were grown under the same growth conditions as described above. Growth was monitored turbidimetrically every 45 min to 1 h with a Genesys 2 spectrophotometer (Thermo Scientific). For microscopic analyses, samples (1 to 2 μl) were taken at 3 h and 6 h and examined using a Nikon E-400 epifluorescence phase-contrast microscope with a 100× Nikon Plan Apo oil-immersion objective (numerical aperture, 1.40) connected to a CoolSNAP HQ2 charge-coupled device (CCD) camera (Photometrics). Images were processed using NIS-Elements AR software (Nikon), and measurements and calculation of cell width, length, volume, and aspect ratio were performed as described previously (52, 53). Statistical significance was determined using GraphPad Prism (GraphPad Software, Inc.) by comparing values for cell width, length, volume, and aspect ratio measured for at least 50 cells over two experimental replicates. To determine if values were significantly different between strains and conditions, the Kruskal-Wallis test (one-way analysis of variance [ANOVA]) with Dunn’s multiple comparison posttest was used.
For additional materials and methods, please see Text S1.
Data availability.
The ensemble of the 20 lowest-energy structures from using NMR data to calculate and refine the solution structure of ECL1 has been deposited in the Protein Data Bank (PDB code 6MK7). The atomic coordinates of FtsXECL1 determined by cocrystallization in the presence of detergents 1, 2, and 3 have been deposited in the Protein Data Bank with PDB codes 6HE6, 6HEE, and 6HFX, respectively. NMR spectroscopy resonance assignments and dynamics data are available in the BMRB under accession code 30523.
ACKNOWLEDGMENTS
We thank the members of the Winkler and Giedroc laboratories for their helpful discussions and insight, specifically Tiffany Tsui, Julia Martin, Melissa Lamanna, and Hui Peng. We acknowledge the Indiana University Bloomington Department of Chemistry Mass Spectrometry Facility, specifically Jonathan Karty and Angela Hansen for their help with training and setting up mass spectrometry experiments, and the MetaCyt Biomolecular NMR Laboratory. We also thank Daiana Capdevila for her help in acquiring and analyzing the isothermal titration calorimetry data, the Indiana University Biological Mass Spectrometry Facility, and Giovanni Gonzales-Gutierrez in the Physical Biochemistry Instrumentation Facility at Indiana University Bloomington. We thank the staff from ALBA synchrotron facility for help during crystallographic data collection.
This work was supported by NIH grants number R01GM114315 and R01GM127715 to M.E.W. and R35GM118157 to D.P.G. and by predoctoral Quantitative and Chemical Biology (QCB) NIH institutional training grant number T32 GM109825 (to B.E.R.). The work in Spain was supported by grant number BFU2017-90030-P from the Spanish Ministry of Science, Innovation and Universities to J.A.H.
Footnotes
Citation Rued BE, Alcorlo M, Edmonds KA, Martínez-Caballero S, Straume D, Fu Y, Bruce KE, Wu H, Håvarstein LS, Hermoso JA, Winkler ME, Giedroc DP. 2019. Structure of the large extracellular loop of FtsX and its interaction with the essential peptidoglycan hydrolase PcsB in Streptococcus pneumoniae. mBio 10:e02622-18. https://doi.org/10.1128/mBio.02622-18.
Contributor Information
Larry S. McDaniel, University of Mississippi Medical Center.
Waldemar Vollmer, Newcastle University.
Liz Sockett, University of Nottingham.
REFERENCES
- 1.Henriques-Normark B, Normark S. 2010. Commensal pathogens, with a focus on Streptococcus pneumoniae, and interactions with the human host. Exp Cell Res 316:1408–1414. doi: 10.1016/j.yexcr.2010.03.003. [DOI] [PubMed] [Google Scholar]
- 2.Kadioglu A, Weiser JN, Paton JC, Andrew PW. 2008. The role of Streptococcus pneumoniae virulence factors in host respiratory colonization and disease. Nat Rev Microbiol 6:288–301. doi: 10.1038/nrmicro1871. [DOI] [PubMed] [Google Scholar]
- 3.Chao Y, Marks LR, Pettigrew MM, Hakansson AP. 2014. Streptococcus pneumoniae biofilm formation and dispersion during colonization and disease. Front Cell Infect Microbiol 4:194. doi: 10.3389/fcimb.2014.00194. [DOI] [PMC free article] [PubMed] [Google Scholar]
- 4.Feldman C, Anderson R. 2014. Recent advances in our understanding of Streptococcus pneumoniae infection. F1000Prime Rep 6:82. doi: 10.12703/P6-82. [DOI] [PMC free article] [PubMed] [Google Scholar]
- 5.CDC. 2013. Antibiotic resistance threats in the United States, 2013. CDC, Atlanta, GA: https://www.cdc.gov/drugresistance/threat-report-2013/pdf/ar-threats-2013-508.pdf. [Google Scholar]
- 6.Garcia-Bustos J, Tomasz A. 1990. A biological price of antibiotic resistance: major changes in the peptidoglycan structure of penicillin-resistant pneumococci. Proc Natl Acad Sci U S A 87:5415–5419. doi: 10.1073/pnas.87.14.5415. [DOI] [PMC free article] [PubMed] [Google Scholar]
- 7.Massidda O, Novakova L, Vollmer W. 2013. From models to pathogens: how much have we learned about Streptococcus pneumoniae cell division? Environ Microbiol 15:3133–3157. doi: 10.1111/1462-2920.12189. [DOI] [PubMed] [Google Scholar]
- 8.Sham LT, Tsui HC, Land AD, Barendt SM, Winkler ME. 2012. Recent advances in pneumococcal peptidoglycan biosynthesis suggest new vaccine and antimicrobial targets. Curr Opin Microbiol 15:194–203. doi: 10.1016/j.mib.2011.12.013. [DOI] [PMC free article] [PubMed] [Google Scholar]
- 9.Egan AJ, Cleverley RM, Peters K, Lewis RJ, Vollmer W. 2017. Regulation of bacterial cell wall growth. FEBS J 284:851–867. doi: 10.1111/febs.13959. [DOI] [PubMed] [Google Scholar]
- 10.Vollmer W, Blanot D, de Pedro MA. 2008. Peptidoglycan structure and architecture. FEMS Microbiol Rev 32:149–167. doi: 10.1111/j.1574-6976.2007.00094.x. [DOI] [PubMed] [Google Scholar]
- 11.Rajagopal M, Walker S. 2017. Envelope structures of Gram-positive bacteria. Curr Top Microbiol Immunol 404:1–44. doi: 10.1007/82_2015_5021. [DOI] [PMC free article] [PubMed] [Google Scholar]
- 12.Rojas ER, Huang KC. 2018. Regulation of microbial growth by turgor pressure. Curr Opin Microbiol 42:62–70. doi: 10.1016/j.mib.2017.10.015. [DOI] [PubMed] [Google Scholar]
- 13.Holtje JV. 1998. Growth of the stress-bearing and shape-maintaining murein sacculus of Escherichia coli. Microbiol Mol Biol Rev 62:181–203. [DOI] [PMC free article] [PubMed] [Google Scholar]
- 14.Holtje JV, Heidrich C. 2001. Enzymology of elongation and constriction of the murein sacculus of Escherichia coli. Biochimie 83:103–108. doi: 10.1016/S0300-9084(00)01226-8. [DOI] [PubMed] [Google Scholar]
- 15.Alcorlo M, Martinez-Caballero S, Molina R, Hermoso JA. 2017. Carbohydrate recognition and lysis by bacterial peptidoglycan hydrolases. Curr Opin Struct Biol 44:87–100. doi: 10.1016/j.sbi.2017.01.001. [DOI] [PubMed] [Google Scholar]
- 16.Mavrici D, Marakalala MJ, Holton JM, Prigozhin DM, Gee CL, Zhang YJ, Rubin EJ, Alber T. 2014. Mycobacterium tuberculosis FtsX extracellular domain activates the peptidoglycan hydrolase, RipC. Proc Natl Acad Sci U S A 111:8037–8042. doi: 10.1073/pnas.1321812111. [DOI] [PMC free article] [PubMed] [Google Scholar]
- 17.Margulieux KR, Liebov BK, Tirumala V, Singh A, Bushweller JH, Nakamoto RK, Hughes MA. 2017. Bacillus anthracis peptidoglycan integrity is disrupted by the chemokine CXCL10 through the FtsE/X complex. Front Microbiol 8:740. doi: 10.3389/fmicb.2017.00740. [DOI] [PMC free article] [PubMed] [Google Scholar]
- 18.Meier EL, Daitch AK, Yao Q, Bhargava A, Jensen GJ, Goley ED. 2017. FtsEX-mediated regulation of the final stages of cell division reveals morphogenetic plasticity in Caulobacter crescentus. PLoS Genet 13:e1006999. doi: 10.1371/journal.pgen.1006999. [DOI] [PMC free article] [PubMed] [Google Scholar]
- 19.Zielińska A, Billini M, Möll A, Kremer K, Briegel A, Izquierdo Martinez A, Jensen GJ, Thanbichler M. 2017. LytM factors affect the recruitment of autolysins to the cell division site in Caulobacter crescentus. Mol Microbiol 106:419–438. doi: 10.1111/mmi.13775. [DOI] [PubMed] [Google Scholar]
- 20.Sham LT, Jensen KR, Bruce KE, Winkler ME. 2013. Involvement of FtsE ATPase and FtsX extracellular loops 1 and 2 in FtsEX-PcsB complex function in cell division of Streptococcus pneumoniae D39. mBio 4:e00431-13. doi: 10.1128/mBio.00431-13. [DOI] [PMC free article] [PubMed] [Google Scholar]
- 21.Sham LT, Barendt SM, Kopecky KE, Winkler ME. 2011. Essential PcsB putative peptidoglycan hydrolase interacts with the essential FtsXSpn cell division protein in Streptococcus pneumoniae D39. Proc Natl Acad Sci U S A 108:E1061–E1069. doi: 10.1073/pnas.1108323108. [DOI] [PMC free article] [PubMed] [Google Scholar]
- 22.Bartual SG, Straume D, Stamsås GA, Muñoz IG, Alfonso C, Martínez-Ripoll M, Håvarstein LS, Hermoso JA. 2014. Structural basis of PcsB-mediated cell separation in Streptococcus pneumoniae. Nat Commun 5:3842. doi: 10.1038/ncomms4842. [DOI] [PubMed] [Google Scholar]
- 23.Meisner J, Montero Llopis P, Sham LT, Garner E, Bernhardt TG, Rudner DZ. 2013. FtsEX is required for CwlO peptidoglycan hydrolase activity during cell wall elongation in Bacillus subtilis. Mol Microbiol 89:1069–1083. doi: 10.1111/mmi.12330. [DOI] [PMC free article] [PubMed] [Google Scholar]
- 24.Yang DC, Peters NT, Parzych KR, Uehara T, Markovski M, Bernhardt TG. 2011. An ATP-binding cassette transporter-like complex governs cell-wall hydrolysis at the bacterial cytokinetic ring. Proc Natl Acad Sci U S A 108:E1052–E1060. doi: 10.1073/pnas.1107780108. [DOI] [PMC free article] [PubMed] [Google Scholar]
- 25.Yang DC, Tan K, Joachimiak A, Bernhardt TG. 2012. A conformational switch controls cell wall-remodelling enzymes required for bacterial cell division. Mol Microbiol 85:768–781. doi: 10.1111/j.1365-2958.2012.08138.x. [DOI] [PMC free article] [PubMed] [Google Scholar]
- 26.Du S, Pichoff S, Lutkenhaus J. 2016. FtsEX acts on FtsA to regulate divisome assembly and activity. Proc Natl Acad Sci U S A 113:E5052–E5061. doi: 10.1073/pnas.1606656113. [DOI] [PMC free article] [PubMed] [Google Scholar]
- 27.Schmidt KL, Peterson ND, Kustusch RJ, Wissel MC, Graham B, Phillips GJ, Weiss DS. 2004. A predicted ABC transporter, FtsEX, is needed for cell division in Escherichia coli. J Bacteriol 186:785–793. doi: 10.1128/JB.186.3.785-793.2004. [DOI] [PMC free article] [PubMed] [Google Scholar]
- 28.Reddy M. 2007. Role of FtsEX in cell division of Escherichia coli: viability of ftsEX mutants is dependent on functional SufI or high osmotic strength. J Bacteriol 189:98–108. doi: 10.1128/JB.01347-06. [DOI] [PMC free article] [PubMed] [Google Scholar]
- 29.Fu Y, Bruce KE, Rued B, Winkler ME, Giedroc DP. 2016. 1H, 13C, 15N resonance assignments of the extracellular loop 1 domain (ECL1) of Streptococcus pneumoniae D39 FtsX, an essential cell division protein. Biomol NMR Assign 10:89–92. doi: 10.1007/s12104-015-9644-9. [DOI] [PMC free article] [PubMed] [Google Scholar]
- 30.Zweckstetter M. 2008. NMR: prediction of molecular alignment from structure using the PALES software. Nat Protoc 3:679–690. doi: 10.1038/nprot.2008.36. [DOI] [PubMed] [Google Scholar]
- 31.Ishima R. 2014. CPMG relaxation dispersion. Methods Mol Biol 1084:29–49. doi: 10.1007/978-1-62703-658-0_2. [DOI] [PubMed] [Google Scholar]
- 32.Bajaj R, Bruce KE, Davidson AL, Rued BE, Stauffacher CV, Winkler ME. 2016. Biochemical characterization of essential cell division proteins FtsX and FtsE that mediate peptidoglycan hydrolysis by PcsB in Streptococcus pneumoniae. Microbiologyopen 5:738–752. doi: 10.1002/mbo3.366. [DOI] [PMC free article] [PubMed] [Google Scholar]
- 33.Sung CK, Li H, Claverys JP, Morrison DA. 2001. An rpsL cassette, Janus, for gene replacement through negative selection in Streptococcus pneumoniae. Appl Environ Microbiol 67:5190–5196. doi: 10.1128/AEM.67.11.5190-5196.2001. [DOI] [PMC free article] [PubMed] [Google Scholar]
- 34.Jacobsen FE, Kazmierczak KM, Lisher JP, Winkler ME, Giedroc DP. 2011. Interplay between manganese and zinc homeostasis in the human pathogen Streptococcus pneumoniae. Metallomics 3:38–41. doi: 10.1039/C0MT00050G. [DOI] [PMC free article] [PubMed] [Google Scholar]
- 35.Martin JE, Lisher JP, Winkler ME, Giedroc DP. 2017. Perturbation of manganese metabolism disrupts cell division in Streptococcus pneumoniae. Mol Microbiol 104:334–348. doi: 10.1111/mmi.13630. [DOI] [PMC free article] [PubMed] [Google Scholar]
- 36.Locher KP. 2016. Mechanistic diversity in ATP-binding cassette (ABC) transporters. Nat Struct Mol Biol 23:487–493. doi: 10.1038/nsmb.3216. [DOI] [PubMed] [Google Scholar]
- 37.Rees DC, Johnson E, Lewinson O. 2009. ABC transporters: the power to change. Nat Rev Mol Cell Biol 10:218–227. doi: 10.1038/nrm2646. [DOI] [PMC free article] [PubMed] [Google Scholar]
- 38.Crow A, Greene NP, Kaplan E, Koronakis V. 2017. Structure and mechanotransmission mechanism of the MacB ABC transporter superfamily. Proc Natl Acad Sci U S A 114:12572–12577. doi: 10.1073/pnas.1712153114. [DOI] [PMC free article] [PubMed] [Google Scholar]
- 39.Ottiger M, Delaglio F, Bax A. 1998. Measurement of J and dipolar couplings from simplified two-dimensional NMR spectra. J Magn Reson 131:373–378. doi: 10.1006/jmre.1998.1361. [DOI] [PubMed] [Google Scholar]
- 40.Yamazaki T, Forman-Kay JD, Kay LE. 1993. Two-dimensional NMR experiments for correlating carbon-13. beta. and proton.delta./.epsilon. chemical shifts of aromatic residues in 13C-labeled proteins via scalar couplings. J Am Chem Soc 115:11054–11055. doi: 10.1021/ja00076a099. [DOI] [Google Scholar]
- 41.Lee W, Tonelli M, Markley JL. 2015. NMRFAM-SPARKY: enhanced software for biomolecular NMR spectroscopy. Bioinformatics 31:1325–1327. doi: 10.1093/bioinformatics/btu830. [DOI] [PMC free article] [PubMed] [Google Scholar]
- 42.Vranken WF, Boucher W, Stevens TJ, Fogh RH, Pajon A, Llinas M, Ulrich EL, Markley JL, Ionides J, Laue ED. 2005. The CCPN data model for NMR spectroscopy: development of a software pipeline. Proteins 59:687–696. doi: 10.1002/prot.20449. [DOI] [PubMed] [Google Scholar]
- 43.Maciejewski MW, Schuyler AD, Gryk MR, Moraru II, Romero PR, Ulrich EL, Eghbalnia HR, Livny M, Delaglio F, Hoch JC. 2017. NMRbox: a resource for biomolecular NMR computation. Biophys J 112:1529–1534. doi: 10.1016/j.bpj.2017.03.011. [DOI] [PMC free article] [PubMed] [Google Scholar]
- 44.Delaglio F, Grzesiek S, Vuister GW, Zhu G, Pfeifer J, Bax A. 1995. NMRPipe: a multidimensional spectral processing system based on UNIX pipes. J Biomol NMR 6:277–293. [DOI] [PubMed] [Google Scholar]
- 45.Kabsch W. 2010. Xds. Acta Crystallogr D Biol Crystallogr 66:125–132. doi: 10.1107/S0907444909047337. [DOI] [PMC free article] [PubMed] [Google Scholar]
- 46.Evans PR, Murshudov GN. 2013. How good are my data and what is the resolution? Acta Crystallogr D Biol Crystallogr 69:1204–1214. doi: 10.1107/S0907444913000061. [DOI] [PMC free article] [PubMed] [Google Scholar]
- 47.Matthews BW. 1968. Solvent content of protein crystals. J Mol Biol 33:491–497. doi: 10.1016/0022-2836(68)90205-2. [DOI] [PubMed] [Google Scholar]
- 48.Adams PD, Afonine PV, Bunkoczi G, Chen VB, Davis IW, Echols N, Headd JJ, Hung LW, Kapral GJ, Grosse-Kunstleve RW, McCoy AJ, Moriarty NW, Oeffner R, Read RJ, Richardson DC, Richardson JS, Terwilliger TC, Zwart PH. 2010. PHENIX: a comprehensive Python-based system for macromolecular structure solution. Acta Crystallogr D Biol Crystallogr 66:213–221. doi: 10.1107/S0907444909052925. [DOI] [PMC free article] [PubMed] [Google Scholar]
- 49.Emsley P, Lohkamp B, Scott WG, Cowtan K. 2010. Features and development of Coot. Acta Crystallogr D Biol Crystallogr 66:486–501. doi: 10.1107/S0907444910007493. [DOI] [PMC free article] [PubMed] [Google Scholar]
- 50.Chen VB, Arendall WB III, Headd JJ, Keedy DA, Immormino RM, Kapral GJ, Murray LW, Richardson JS, Richardson DC. 2010. MolProbity: all-atom structure validation for macromolecular crystallography. Acta Crystallogr D Biol Crystallogr 66:12–21. doi: 10.1107/S0907444909042073. [DOI] [PMC free article] [PubMed] [Google Scholar]
- 51.Lanie JA, Ng WL, Kazmierczak KM, Andrzejewski TM, Davidsen TM, Wayne KJ, Tettelin H, Glass JI, Winkler ME. 2007. Genome sequence of Avery's virulent serotype 2 strain D39 of Streptococcus pneumoniae and comparison with that of unencapsulated laboratory strain R6. J Bacteriol 189:38–51. doi: 10.1128/JB.01148-06. [DOI] [PMC free article] [PubMed] [Google Scholar]
- 52.Land AD, Tsui HC, Kocaoglu O, Vella SA, Shaw SL, Keen SK, Sham LT, Carlson EE, Winkler ME. 2013. Requirement of essential Pbp2x and GpsB for septal ring closure in Streptococcus pneumoniae D39. Mol Microbiol 90:939–955. doi: 10.1111/mmi.12408. [DOI] [PMC free article] [PubMed] [Google Scholar]
- 53.Tsui HC, Zheng JJ, Magallon AN, Ryan JD, Yunck R, Rued BE, Bernhardt TG, Winkler ME. 2016. Suppression of a deletion mutation in the gene encoding essential PBP2b reveals a new lytic transglycosylase involved in peripheral peptidoglycan synthesis in Streptococcus pneumoniae D39. Mol Microbiol 100:1039–1065. doi: 10.1111/mmi.13366. [DOI] [PMC free article] [PubMed] [Google Scholar]
- 54.Pei J, Kim BH, Grishin NV. 2008. PROMALS3D: a tool for multiple protein sequence and structure alignments. Nucleic Acids Res 36:2295–2300. doi: 10.1093/nar/gkn072. [DOI] [PMC free article] [PubMed] [Google Scholar]
Associated Data
This section collects any data citations, data availability statements, or supplementary materials included in this article.
Supplementary Materials
FtsXECL1 crystal structures solved in this work. (A) Cartoon representation of the asymmetric unit of the FtsXECL1-D1 crystal structure, with chain B colored blue to red from the N terminus to the C terminus of the domain, and chain A shown in gray. The detergent 1 molecule (D1) is represented as sticks. (B) Structural superposition of the six independent crystal structures of FtsXECL1 solved in this work. All chains are presented with a ligand attached, except for chain B in complexes FtsXECL1-D1 and FtsXECL1-D3. (C) Structural superposition of the six independent structures. Color coding is as described for panel B. (D) Polar interactions in the N-terminal region of FtsXECL1-D1 (chain A). The N-terminal region (residues 49 to 59) is represented as sticks. Polar interactions are represented as dashed lines. (E) Stabilization of detergent 2 (D2) by the helical lobe of FtsXECL1. FtsXECL1-D2 complex. n-Undecyl-β-d-maltoside (D2) is represented as white sticks. Relevant residues in the protein are represented as green sticks. (F) Stabilization of detergent 3 (D3) by the helical lobe of FtsXECL1. FtsXECL1-D3 complex. n-Decyl-β-d-maltoside (D3) is represented as white sticks. Relevant residues in the protein are represented as green sticks. Polar interactions are represented by dashed lines. (G) Full stabilization of the detergent tail in FtsXECL1-D3 complex (green ribbon) requires hydrophobic residues from the helical lobe of a second monomer in the crystal (yellow ribbon). Similar packing was observed for the other complexes. Download FIG S1, EPS file, 13.2 MB (13.5MB, eps) .
Copyright © 2019 Rued et al.
This content is distributed under the terms of the Creative Commons Attribution 4.0 International license.
Electron density maps for FtsXECL1. (A) Electron density map for the 2.0-Å-resolution structure of FtsXECL1 monomer (chain A). (B) Electron density map (2Fo − Fc map contoured at 0.8σ) for detergent D1 (dodecyltrimethylammonium chloride). (C) Electron density map (2Fo − Fc map contoured at 1σ) for detergent D2 (n-undecyl-β-d-maltoside). (D) Electron density map (2Fo − Fc map contoured at 1σ) for detergent D3 (n-decyl-β-d-maltoside). Detergents are represented as sticks. Download FIG S2, EPS file, 2.9 MB (3MB, eps) .
Copyright © 2019 Rued et al.
This content is distributed under the terms of the Creative Commons Attribution 4.0 International license.
Dynamics of FtsXECL1 in solution and crystal. (A) 1DHN residual dipolar couplings (RDCs) measured in Pf1 filamentous phage, plotted against the FtsXECL1 sequence. (B) Cα RMSD of the solution structure, mapped onto a representative structure from the NMR ensemble, with increased RMSD shown as increased tube width and redness. (C) Box-and-whisker plot showing the distribution of differences between measured and predicted values for the NMR structure for all measured RDCs, including those that were not used as restraints. Outliers are shown as circles. The dashed line shows the median difference for all NMR structures, and the gray-shaded region contains 95% of difference values for all NMR structures, excluding lightly shaded hypermobile regions with vanishing RDC values (residues 45 to 58, 119 to 133, and 165 to 168). Red X’s mark difference values for the crystal structure with detergent D1. Secondary structure elements are shown above for reference. (D) Average RDC difference values for the crystal structures with D1 mapped onto the structure, with excluded hypermobile regions shown in black. (E) Heteronuclear NOEs (hNOE) for each residue. Secondary structure elements are shown in inset for reference. (F) hNOE values mapped onto a representative structure. Increasing fast-timescale motions are shown with increasing redness and increasing tube thickness. Residues omitted due to peak overlap or absence are shown in black in panels D, F, H, and J. (G) Nuclear spin relaxation rates: R2/R1 for each residue. (H) R2/R1 mapped onto a representative structure, with elevated values indicative of slow-timescale motions shown in blue and decreased values indicative of fast-timescale motions shown in red. (I) Rex exchange rates for each residue, at 600 MHz and 800 MHz plotted in black and gray, respectively. (J) Rex rates at 600 MHz mapped onto a representative structure, with increasing slow-timescale motions shown with increasing blueness and increasing tube thickness. (K) Crystallographic B factors plotted as increasing tube width and redness on the FtsXECL1 structure, for chains A and B with detergents D1 and D3. The detergents are shown as sticks. (L) RMSD of the crystal structures mapped onto chain A of the FtsXECL1-D1 structure, with increasing tube thickness and redness indicative of higher RMSDs. Download FIG S3, EPS file, 8.8 MB (9MB, eps) .
Copyright © 2019 Rued et al.
This content is distributed under the terms of the Creative Commons Attribution 4.0 International license.
NMR chemical shift perturbation experiments demonstrate that the PcsB coiled-coil domain interacts with FtsXECL1. (A) 1H-15N HSQC titration of 50 µM 15N-labeled FtsXECL1 with molar equivalents of unlabeled PcsB coiled-coil domain [PscBCC(47–267)]. The legend beside the 1H-15N HSQC spectra indicates the amount of PscBCC added and the spectrum peak color corresponding to this amount. Red peaks indicate no PscBCC added, dark blue peaks indicate 1 molar equivalent PscBCC added, light blue peaks indicate 2 molar equivalents PscBCC added, dark purple peaks indicate 4 molar equivalents PscBCC added, light purple peaks indicate 6 molar equivalents PscBCC added. Labeled peaks on the 1H-15N HSQC indicate residues shifting more than one or two standard deviations from the mean value when 2 molar equivalents of PscBCC were added. (B) Zoomed depiction of residues F126 and M119 from 1H-15N HSQC titration of 15N-labeled FtsXECL1 with unlabeled PscBCC, as examples of peaks with significant shifts (see panel C). The legend to panel A indicates the amount of PscBCC added and the spectrum peak color corresponding to this amount. (C) Chemical shift (Δδ, ppm) per residue of FtsXECL1 upon the addition of 2 molar equivalents of PscBCC is shown in red. The secondary structure is indicated above the plot. The black line on the plot (2 SD) represents the threshold of 2 standard deviations from the average chemical shift upon the addition of 2 equivalents of PscBCC. Peak height change before and after addition of 2 molar equivalents of PscBCC to FtsXECL1 is shown in blue. Download FIG S4, EPS file, 4.3 MB (4.4MB, eps) .
Copyright © 2019 Rued et al.
This content is distributed under the terms of the Creative Commons Attribution 4.0 International license.
Significant chemical shift changes and peak height changes upon 1H-15N HSQC titration of 50 µM 15N-labeled FtsXECL1 with unlabeled PscBCC map to the lower lobe of FtsXECL1. Chemical shift changes (Δδ, ppm) and peak height changes are mapped as color gradients on the FtsXECL1 structure, orange to red and grey to blue, respectively. Peaks that overlap or disappear in the 1H-15N HSQC spectra are colored white and dark grey, respectively. (A) Chemical shift changes and peak height changes upon the addition of 1 molar equivalent of PscBCC to FtsXECL1. (B) Chemical shift changes and peak height changes upon the addition of 4 molar equivalents of PscBCC to FtsXECL1. (C) Chemical shift changes and peak height changes upon the addition of 6 molar equivalents of PscBCC to FtsXECL1. Download FIG S5, EPS file, 8.5 MB (8.7MB, eps) .
Copyright © 2019 Rued et al.
This content is distributed under the terms of the Creative Commons Attribution 4.0 International license.
PscBCC binds to FtsXECL1. (A) Left, 1H-15N HSQC spectrum of 15N-labeled PscBCC(47–254) (in red) overlaid with 1H-15N HSQC spectrum of 15N-labeled PcsB-CC(47–267) (in blue). Right, circular dichroism (CD) spectra of His-PscBCC(47–267) (in blue) and His-PscBCC(47–254) (in red). Primarily α-helical secondary structure is observed. (B) Left, 1H-15N HSQC titration of 50 µM 15N-labeled PscBCC(47–254) with molar equivalents of unlabeled FtsXECL1. The legend above the 1H-15N HSQC spectra indicates the amount of FtsXECL1 added and the spectra peak color corresponding to this amount. Red peaks indicate no FtsXECL1 was added, dark blue peaks indicate 1 molar equivalent FtsXECL1 was added, light blue peaks indicate 2 molar equivalents FtsXECL1 was added, and gold peaks indicate 4 molar equivalents FtsXECL1 was added. Right, portions of the 1H-15N HSQC spectra of 15N-labeled PscBCC(47–254) that have peak shifts upon the addition of increasing amounts of FtsXECL1. Download FIG S6, EPS file, 8.1 MB (8.3MB, eps) .
Copyright © 2019 Rued et al.
This content is distributed under the terms of the Creative Commons Attribution 4.0 International license.
Supplemental materials and methods and appendix. Download Text S1, PDF file, 2.6 MB (2.6MB, pdf) .
Copyright © 2019 Rued et al.
This content is distributed under the terms of the Creative Commons Attribution 4.0 International license.
Residues in the interaction region of FtsXECL1-PcsBCC are conserved, and FtsX depletion results in rounded cells and inhibition of growth. (A) Amino acid alignment of residues 102 to 155 of S. pneumoniae FtsXECL1 with corresponding FtsX sequences from M. tuberculosis, E. coli, Streptococcus gordonii, Streptococcus mitis, Streptococcus mutans, Streptococcus pyogenes, Bacillus cereus, and B. subtilis. The S. pneumoniae sequence is indicated in bold, and the secondary structure from the S. pneumoniae structure is indicated above the alignment. The FtsXECL1-PcsBCC interaction region is indicated by the blue line beneath the alignment, from S. pneumoniae FtsX amino acids 105 to 137. Alignment was obtained by input of the sequences into the Clustal Omega webserver (http://www.ebi.ac.uk/Tools/msa/clustalo/) and then input of the multiple sequence alignment into the ESPript 3.0 webserver (http://espript.ibcp.fr/ESPript/ESPript/). See supplemental materials and methods in Text S1 for additional details. (B) Genetic scheme for cross-in of potentially lethal amino acid changes. In the D39 rpsL1 Δcps wild-type background, wild-type ftsX was placed under the control of the zinc-inducible promoter (PZn) at the bgaA locus (ectopic site) and a Janus cassette (33) [kan-rpsL+]-ftsX was placed at the native site of ftsX in the chromosome (D39 rpsL1 Δcps [kan-rpsL+]-ftsX/bgaA::tet-PZn-ftsX+; strain IU12330). To select for the cross-in of markerless mutant alleles of ftsX that could potentially be lethal, linear DNA amplicons of mutant ftsX were transformed into IU12330 with 0.45 mM ZnCl2, 0.045 mM MnSO4, and streptomycin (for Janus cassette exchange). Resulting strains were propagated and stored with the same Zn and Mn concentrations. After storage, strains were grown without Zn-Mn to determine if the mutant allele of ftsX caused morphological or growth defects. Strains were also grown with Zn-Mn to determine if the mutant allele was dominant negative. (C) Representative growth curves of the FtsX depletion strain versus the wild type. These strains were grown with or without 0.45 mM ZnCl2 supplemented with 0.045 mM MnSO4 (indicated as +Zn). Strains shown are as follows: black circle, D39 rpsL1 Δcps wild-type parent (1, strain IU1824); grey circle, IU1824 +Zn; blue square, D39 rpsL1 Δcps ΔftsX::P-aad9/bgaA::tet-PZn-ftsX+ (2, strain IU12376); light blue square, IU12376 +Zn. This growth curve experiment was repeated three times with similar results. (D) Representative images of strains at 6 h of growth. The genotype of the strain shown is indicated above each panel. No Zn or +Zn indicates whether or not Zn-Mn was added. %, the percentage of cells in the population that are morphologically similar to the images shown. More than 50 cells were counted per experimental run, condition, and strain. These experiments were performed three times independently with similar results. Scale bar shown is 1 µm. (E) Lengths, widths, aspect ratios, and relative cell volumes of strains at 3 h and 6 h of growth. Strains are indicated according to the numbering in panel C. More than 50 cells were measured per strain and condition over two experimental replicates. For statistical analysis, the Kruskal-Wallis test (one-way ANOVA) with Dunn’s multiple comparison posttest was used to determine if lengths, widths, aspect ratios, and relative cell volumes were significantly different between strains and conditions. ns, not significant; *, P < 0.05; ** P < 0.005; ***, P < 0.0005. Download FIG S7, EPS file, 6.2 MB (6.4MB, eps) .
Copyright © 2019 Rued et al.
This content is distributed under the terms of the Creative Commons Attribution 4.0 International license.
Expression of FtsX(L115A) or FtsX(M119A) results in mild morphological defects. (A) Amino acid changes made are mapped to the structure of FtsXECL1. The α carbon of each residue is shown as a colored sphere. The orange-to-red coloring on the FtsXECL1 structure represents the peak height changes in the 1H-15N HSQC spectra upon the addition of 2 molar equivalents of PscBCC to FtsXECL1. (B) Representative growth curves of strains expressing FtsX(L115A) or FtsX(M119A) versus FtsX depletion and wild-type strains. These strains were grown with or without 0.45 mM ZnCl2 supplemented with 0.045 mM MnSO4 (indicated as +Zn). Strains shown are as follows: black circle, strain D39 rpsL1 Δcps wild-type parent (1, strain IU1824); grey circle, IU1824 +Zn; dark blue square, D39 rpsL1 Δcps ΔftsX::P-aad9/bgaA::tet-PZn-ftsX+ (2, strain IU12376); light blue square, IU12376 +Zn; red triangle, D39 rpsL1 Δcps ftsX(L115A)/bgaA::tet-PZn-ftsX+ (3, strain IU12521); pink triangle, IU12521 +Zn; brown inverted triangle, D39 rpsL1 Δcps ftsX(M119A)/bgaA::tet-PZn-ftsX+ (4, strain IU12637); light brown inverted triangle, IU12637 +Zn. This experiment was performed three times with similar results. (C) Representative images of strains at 6 hours growth. The genotype of the strain shown is indicated above each panel. No Zn or +Zn indicates whether or not Zn-Mn was added. %, percentage of cells in the population that are morphologically similar to the images shown. More than 50 cells per strain per experimental repeat were analyzed. These experiments were performed three times independently with similar results. Scale bar is equal to 1 µm. (D) Lengths, widths, aspect ratios, and relative cell volumes of strains at 6 h of growth. Strains are indicated according to the numbering in panel B. More than 50 cells were measured per strain and condition over two experimental replicates. For statistical analysis, the Kruskal-Wallis test (one-way ANOVA) with Dunn’s multiple comparison posttest was used to determine if lengths, widths, aspect ratios, and relative cell volumes were significantly different between strains and conditions. ns, not significant; *, P < 0.05; **, P < 0.005; ***, P < 0.0005. Download FIG S8, EPS file, 5.8 MB (5.9MB, eps) .
Copyright © 2019 Rued et al.
This content is distributed under the terms of the Creative Commons Attribution 4.0 International license.
Cells expressing FtsX(L115A M119A) have severe defects in morphology and growth. Cells expressing FtsX(Q111A L115C) have defects in morphology but not growth. (A) Amino acid changes made mapped to the structure of FtsXECL1. The α carbon of each residue is shown as a colored sphere. The orange-to-red coloring on the FtsXECL1 structure represents the peak height changes in the 1H-15N HSQC spectra upon the addition of 2 molar equivalents of PscBCC to FtsXECL1. (B) Representative growth curves of strains expressing FtsX(Q111A L115C) and FtsX(L115A M119A) versus FtsX depletion and wild-type strains. These strains were grown with or without 0.45 mM ZnCl2 and 0.045 mM MnSO4 (indicated as +Zn). Strains shown are as follows: black circle, strain D39 rpsL1 Δcps wild-type parent (1, strain IU1824); grey circle, IU1824 +Zn; blue square, D39 rpsL1 Δcps ΔftsX::P-aad9/bgaA::tet-PZn-ftsX+ (2, strain IU12376); light blue square, IU12376 +Zn; green inverted triangle, D39 rpsL1 Δcps ftsX(Q111A L115C)/bgaA::tet-PZn-ftsX+ (3, strain IU13064); light green inverted triangle, IU13064 +Zn; dark purple diamond, D39 rpsL1 Δcps ftsX(L115A M119A)/bgaA::tet-PZn-ftsX+ (4, strain IU3066); light purple diamond, IU13066 +Zn. This growth curve experiment was repeated three times with similar results. (C) Representative images of strains at 6 h of growth. The genotype of the strain shown is indicated above each panel. No Zn or +Zn indicates whether or not Zn-Mn was added. %, percentage of cells in the population that are morphologically similar to the images shown. More than 50 cells were counted per experimental run, per condition and strain. These experiments were performed three times independently with similar results. Scale bar is equal to 1 µm. (D) Length, width, aspect ratio, and relative cell volume of strains at 6 hours growth. Strains are indicated according to the numbering in panel B. Greater than 50 cells were measured per strain and condition over two experimental replicates. For statistical analysis, a Kruskal-Wallis test (one-way ANOVA) with Dunn’s multiple comparison posttest was used to determine if length, width, aspect ratio, and relative cell volume were significantly different between strains and conditions. ns, not significant; *, P < 0.05; **, P < 0.005; ***, P < 0.0005. Download FIG S9, EPS file, 5.9 MB (6MB, eps) .
Copyright © 2019 Rued et al.
This content is distributed under the terms of the Creative Commons Attribution 4.0 International license.
1H-15N HSQC spectra of 15N-labeled FtsXECL1(E109A Q111A L115A M119A), FtsXECL1(L115A M119A), and FtsXECL1(W123A F126A N131A) show perturbation of residues in the lower lobe of FtsXECL1. (A) 1H-15N HSQC spectrum of 50 µM 15N-labeled FtsXECL1(E109A Q111A L115A M119A) compared to the wild-type FtsXECL1 spectrum. Wild-type FtsXECL1 peaks are indicated in black, and FtsXECL1(E109A Q111A L115A M119A) peaks are indicated in light blue. Below the spectra, peaks that are no longer in the area of the original wild-type peak are indicated by their α carbon as a sphere on the FtsXECL1 structure. Overlapping peaks are indicated in white. (B) 1H-15N HSQC spectrum of 50 µM 15N-labeled FtsXECL1(L115A M119A) compared to the wild-type FtsXECL1 spectrum. Wild-type FtsXECL1 peaks are indicated in black, and FtsXECL1(L115A M119A) peaks are indicated in green. Below the spectra, peaks that are no longer in the area of the original wild-type peak are indicated by their α carbon as a sphere on the FtsXECL1 structure. Overlapping peaks are indicated in white. (C) 1H-15N HSQC spectrum of 50 µM 15N-labeled FtsXECL1(W123A F126A N131A) compared to the wild-type FtsXECL1 spectrum. Wild-type FtsXECL1 peaks are indicated in black, and FtsXECL1(W123A F126A N131A) peaks are indicated in purple. Below the spectra, peaks that are no longer in the area of the original wild-type peak are indicated by their α carbon as a sphere on the FtsXECL1 structure. Overlapping peaks are indicated in white. (D) Circular dichroism (CD) spectroscopy results for wild-type FtsXECL1, FtsXECL1(L115A M119A), FtsXECL1(E109A Q111A L115A M119A), and FtsXECL1(W123A F126A N131A) plotted as the function of mean residue ellipticity (deg · cm2 dmol−1) × 103 versus wavelength (nm). Download FIG S10, EPS file, 19.2 MB (19.7MB, eps) .
Copyright © 2019 Rued et al.
This content is distributed under the terms of the Creative Commons Attribution 4.0 International license.
Data Availability Statement
The ensemble of the 20 lowest-energy structures from using NMR data to calculate and refine the solution structure of ECL1 has been deposited in the Protein Data Bank (PDB code 6MK7). The atomic coordinates of FtsXECL1 determined by cocrystallization in the presence of detergents 1, 2, and 3 have been deposited in the Protein Data Bank with PDB codes 6HE6, 6HEE, and 6HFX, respectively. NMR spectroscopy resonance assignments and dynamics data are available in the BMRB under accession code 30523.