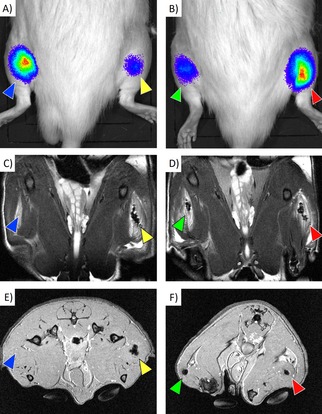
Figure 7.

In vivo imaging of the engrafted cells: Bioluminescence images (A, B), coronal T2‐weighted MR images (C, D), and transversal T2*‐weighted MR images (E, F) of rats with transplanted cells. Both labeled and unlabeled cells were detectable by bioluminescence imaging. Unlabeled cells (blue arrows) provided no detectable MR signal, whereas cells labeled at 0.2 mM (yellow arrows), 0.1 mM (green arrows) and 0.05 mM (red arrows) were detectable as distinct hypointense areas.
