Figure 6.
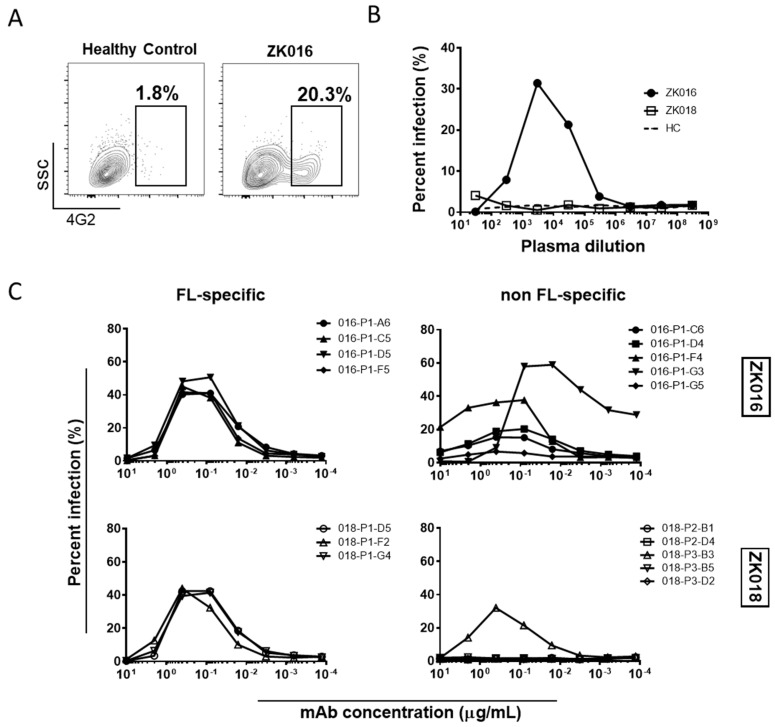
ZIKV plasmablast responses enhance DENV2 infection in vitro. (A) Representative flow cytometry plots comparing ADE activity of plasma from ZK016 vs. healthy control. Boxed population represents DENV2-infected cells based on positive 4G2 staining. Plots shown display ADE at plasma dilution of 1:3000. (B) DENV2 ADE activities of plasma from ZK016, ZK018 and a flavivirus-naïve healthy donor (dotted line). (C) DENV2 ADE activities of FL-specific and non FL-specific mAbs from ZK016 and ZK018.

