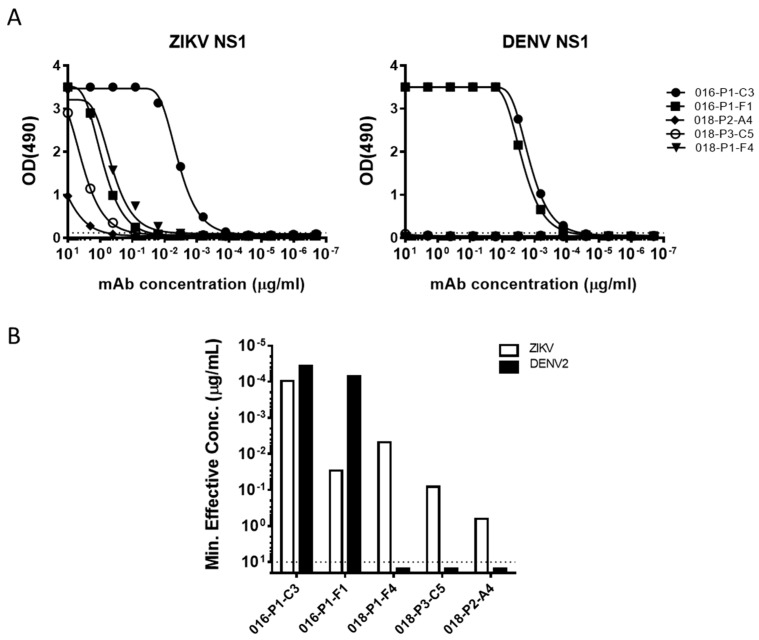
Figure 7.
ZIKV infection drives activation of NS1-specific plasmablast responses. (A) Binding curves of ZK016 and ZK018 NS1-specific mAbs. Antibodies were tested for binding to ZIKV and DENV2 recombinant NS1 proteins by ELISA. The dotted lines represent three times the background signal obtained with plain blocking buffer. (B) Binding activity of mAbs to ZIKV (white bar) or DENV2 (black bar) recombinant NS1 protein by ELISA. The values plotted represent the minimum concentrations required to obtain three times the background signal. The dotted line indicates the maximum concentration of mAbs tested in ELISA (10 μg/mL). Results plotted are representative of two or more independent ELISA experiments.

