Figure 1.

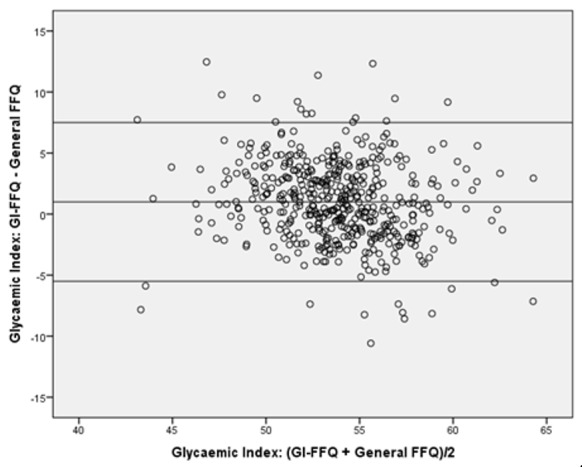
Bland-Altman plot for glycaemic index showing the relative validity of the GI-FFQ versus the general-FFQ. Middle line indicates the mean; upper and lower lines indicate borders based on mean ± SD × 1.96 (i.e., 1.0+/−6.5).

Bland-Altman plot for glycaemic index showing the relative validity of the GI-FFQ versus the general-FFQ. Middle line indicates the mean; upper and lower lines indicate borders based on mean ± SD × 1.96 (i.e., 1.0+/−6.5).