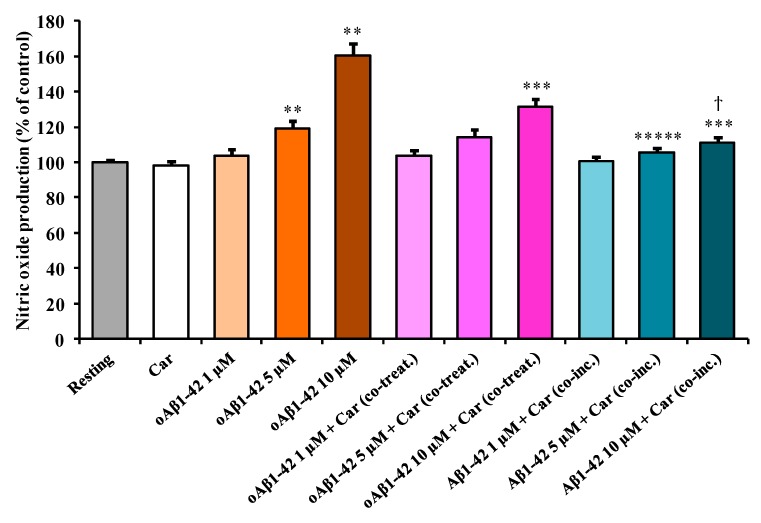
Figure 2.
The change in the NO production induced by treating BV-2 cells with Aβ1-42 and effects of carnosine. BV-2 cells were treated for 24 h with increasing oAβ1-42 concentrations (1, 5, or 10 µM), in the absence or presence of carnosine (Car, 1 mM) (oAβ1-42 + Car (co-treat.), or with a solution consisting of Aβ1-42 monomers previously incubated in the presence of carnosine (1 mM) during the oligomerization process (Aβ1-42 + Car (co-inc.)). Data are the mean of 5 independent experiments and are expressed as the percent variation with respect to the NO production recorded in resting cells. Standard deviations are represented by vertical bars. ** Significantly different from resting cells, p < 0.001, *** significantly different from corresponding treatment with no carnosine, p < 0.001, ***** significantly different from corresponding treatment with no carnosine, p < 0.05, ϯ significantly different from cells treated with 10 µM oAβ1-42 + Car (co-treat), p < 0.001.

